Publisher’s version / Version de l'éditeur:
Vous avez des questions? Nous pouvons vous aider. Pour communiquer directement avec un auteur, consultez la première page de la revue dans laquelle son article a été publié afin de trouver ses coordonnées. Si vous n’arrivez pas à les repérer, communiquez avec nous à PublicationsArchive-ArchivesPublications@nrc-cnrc.gc.ca.
Questions? Contact the NRC Publications Archive team at
PublicationsArchive-ArchivesPublications@nrc-cnrc.gc.ca. If you wish to email the authors directly, please see the first page of the publication for their contact information.
https://publications-cnrc.canada.ca/fra/droits
L’accès à ce site Web et l’utilisation de son contenu sont assujettis aux conditions présentées dans le site LISEZ CES CONDITIONS ATTENTIVEMENT AVANT D’UTILISER CE SITE WEB.
8th International Conference of Health Buildings [Proceedings], pp. 1-4,
2006-06-04
READ THESE TERMS AND CONDITIONS CAREFULLY BEFORE USING THIS WEBSITE. https://nrc-publications.canada.ca/eng/copyright
NRC Publications Archive Record / Notice des Archives des publications du CNRC :
https://nrc-publications.canada.ca/eng/view/object/?id=b9b041b7-bf3b-4f3d-a871-30de5735e219
https://publications-cnrc.canada.ca/fra/voir/objet/?id=b9b041b7-bf3b-4f3d-a871-30de5735e219
NRC Publications Archive
Archives des publications du CNRC
This publication could be one of several versions: author’s original, accepted manuscript or the publisher’s version. / La version de cette publication peut être l’une des suivantes : la version prépublication de l’auteur, la version acceptée du manuscrit ou la version de l’éditeur.
Access and use of this website and the material on it are subject to the Terms and Conditions set forth at
The effects of material temperature on VOC emissions: a case study
with a mock-up radiant floor system
The effects of material
temperature on VOC emissions: a
case study with a mock-up
radiant floor system
Won, D.Y.; Nong, G.
NRCC-54568
A version of this document is published in
8th International Conference of Healthy Buildings (Lisbon, Portugal, June 4-8, 2006), pp. 1-4
The material in this document is covered by the provisions of the Copyright Act, by Canadian laws, policies, regulations and international agreements. Such provisions serve to identify the information source and, in specific instances, to prohibit reproduction of materials without written permission. For more information visit http://laws.justice.gc.ca/en/showtdm/cs/C-42
Les renseignements dans ce document sont protégés par la Loi sur le droit d’auteur, par les lois, les politiques et les règlements du Canada et des accords internationaux. Ces dispositions permettent d’identifier la source de l’information et, dans certains cas, d’interdire la copie de documents sans permission écrite. Pour obtenir de plus amples renseignements : http://lois.justice.gc.ca/fr/showtdm/cs/C-42
The effects of material temperature on VOC emissions: A case study with a
mock-up radiant heating floor system
D. Won and G. Nong
1
Institute for Research in Construction, National Research Council Canada Bldg. M-24, 1200 Montreal Road, Ottawa, Ontario, Canada, K1K OR6
email: doyun.won@nrc-cnrc.gc.ca
Summary: This study is to investigate the effect of the building material temperature on VOC emissions. Small-scale chamber tests were conducted on a floor assembly that simulates a radiant heating floor system. The temperature of the plywood surface in contact with the heated “floor” was controlled at five different levels from 23 to 43 oC. The experimental results were used to estimate the diffusion coefficient for a mass-transfer model that was developed for this study. The results indicate that the diffusion coefficient increased with material surface temperature up to 33 oC. After that, the diffusion coefficient was independent of material temperature. A correlation equation was determined to predict diffusion coefficient as a function of material temperature. The relationship can be used to investigate the effects of a radiant heating floor system on air concentrations and subsequent exposure of occupants.
Keywords: material emissions, volatile organic compounds, temperature
1 Introduction
Radiant heating systems use temperature-controlled floor, walls, or ceiling as a primary heating source. In North America, radiant heating systems are gaining popularity because of their advantages in energy savings and improved thermal comfort. The energy savings and thermal comfort aspects of radiant heating systems have been extensively studied. No research, however, has been published to evaluate the effect of the heated surface on its VOC emissions.
It has been known that emissions of volatile organic compounds (VOCs) from building materials are affected by air temperature [1,2,3,4]. Therefore, the elevated temperature of a radiant heating floor assembly may have similar effects on VOC emissions. The objective of this study is to determine the effect of material temperature on VOC emissions from a radiant heating floor system as a function of material temperature.
2 Method
2.1 Experimental set-up
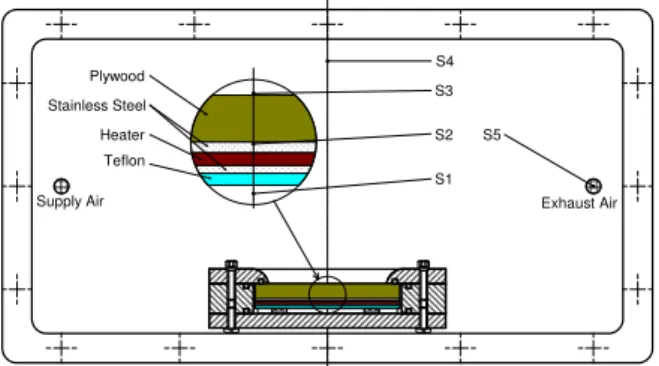
An experimental system was set up to simulate a wood subfloor radiant system, consisting of five layers of materials: Teflon sheet, two stainless steel sheets, silicone heater and plywood. Fig. 1 presents the schematic diagram of the experimental set-up including the cross-sectional view of a floor assembly secured in a specimen holder.
A plywood panel (11 mm thickness, Douglas fir) was purchased at a local store. The panel was cut into small pieces (0.19 m x 0.1 m) with a clean saw
after the purchase. The small specimens were stored in a clean Tedlar bag until they were used in experiments.
Fig. 1. Cross-sectional view of small-scale chamber with a radiant heating floor assembly.
Fig. 1 also shows locations where temperature was monitored with T-type thermo couples: S1 in the air space below the Teflon layer, S2 on the bottom surface of plywood, S3 on the upper surface of plywood, S4 in the chamber air and S5 in the exhaust air. The temperature at S2 was controlled at
five levels: 23, 28, 33, 38 and 43 oC. Temperature
measurements at all locations were stable for the duration of an experiment with a relative standard deviation (RSD) of 0.2 to 1.2%.
2.2 Chamber test
The chamber tests were conducted in accordance with the ASTM Standard D5116 [5]. Each chamber test lasted approximately 100 hours. A plywood
S5 S4
Supply Air Exhaust Air
Plywood Heater Teflon S1 S3 S2 Stainless Steel
specimen (139.2 – 143.6 g, 0.019 m2) was secured into the specimen holder as shown in Fig. 1. The chamber was operated at ~50% RH and 1 air change per hour. Chamber exhaust air was collected on multi-bed sorbent tubes to obtain VOC concentration profiles of the chamber air over time. At the end of an experiment, all sampled tubes were subjected to the thermal desorption and the gas chromatography/mass spectrometry (GC/MS) analysis.
2.3 Model development
Comparing emission data (e.g., chamber concentrations or emission factors) is one way of determining the effects of material temperature on VOC emissions. However, it may not be the most effective method as the emission factors and chamber concentrations are also affected by other factors such as depletion of VOC sources. Comparing parameters that can represent fundamental mass transfer mechanisms can provide a better way to quantify the effects of environmental factors [6].
To apply the model parameter comparison method, it is necessary to estimate the model parameters of a mass-transfer based model for VOC emissions from a test specimen. Assuming one-dimensional diffusion in the specimen, the concentration of a chemical within a material specimen can be expressed by Eq. (1).
2 2 x C D t C m m m ∂ ∂ = ∂ ∂ (1)
where Cm is the concentration of a chemical in the
specimen (mg m-3), x is the distance upwards from
the bottom of the specimen (m), t is time (h), Dm is
the diffusion coefficient of a chemical in the specimen (m2 s-1).
The following initial and boundary conditions were used to solve Eq. (1).
0 at = =C t Cm o (2) 0 at 0 = = ∂ ∂ x x Cm (3)
l
x
C
m≈
0
at
=
(4)where Co is the initial concentration of a chemical
in the specimen (mg m-3) and l is the thickness of
the specimen (m).
The initial condition, Co, can be obtained
independently of chamber tests. The procedure for estimating Co is explained in the next section. The
first boundary condition (Eq. (3)) indicates that there is no mass flow at the bottom of the system. The second boundary condition (Eq. (4)) assumes the top surface of the specimen is exposed to an infinite atmosphere. Since the chamber has a finite atmosphere, the secondary boundary condition may need to be improved for more accurate simulations. However, because the concentrations in chamber air are relatively low the simplified boundary
condition might be good enough to illustrate the potential usage of a mass-transfer model for quantifying the effects of material temperature on VOC emissions.
Solving Eq. (1) using the Laplace transform for the afore-mentioned initial and boundary conditions leads to Eq. (5):
(
)
(
)
+ − + + − =∑
∞ = x l n l t n D n C C n m n o m 2 1 2 cos 4 1 2 exp 1 2 ) 1 ( 4 0 2 2 2π π π (5) Based on Eq. (5), the total amount of a chemical left the specimen at time t (Mt) is:(
)
(
)
∑
∞ = ∞ − + − + = 0 2 2 2 2 2 4 1 2 exp 1 1 2 1 8 n m t l t n D n M M π π (6) For a large t, the first term of the infinite series in Eq. (6) is important and, therefore, Eq. (6) becomes: 2 2 2 8 ln 4 1 ln π π + − = − ∞ t l D M Mt m (7)where M∞ is the total amount (mg) of a chemical
left at an infinite t, which can be estimated from Co.
Plotting the logarithmic term on the left-hand side of Eq. (7) versus time can lead to the diffusion coefficient using the following equation.
2 2 4 π l S Dm=− (8)
where S is the slope estimated from the time and ln (1-Mt/Moo) profile.
2.4 Measurements of Co in plywood
A direct thermal desorption method was used to
measure the initial concentration (Co) of chemicals
in the specimen. A small section (~ 0.05 g) was cut from the original specimen with a clean knife. The sample was put in a clean empty glass tube designed to hold adsorbents for air sampling (Supelco, glass tube for Perkin Elmer ATD 400). Both ends of the tube were blocked with 1 cm of glass wool. The tube was thermally desorbed at 250
o
C for 20 minutes with ATD 400. The desorbed chemicals were consequently analyzed with GC/MS under the same condition as that of the air sample analysis. The same tube was thermally desorbed two more times at the same temperature
(250 oC) and at a higher temperature (300 oC) in
consecutive runs. If the eluted compounds are more than 10% of the results of the first run, the procedures were restarted with a new specimen at higher temperatures until the 10% criterion was met. The resulting initial concentration was 19.3 g
m-3 for α-pinene, 1.1 for camphene, 2.3 for
3 Results and discussion
3.1 Chamber air concentrations
The most abundant organic chemicals emitted from the plywood were terpenes including α-pinene, camphene, β-α-pinene, 3-carene, and limonene. Fig. 2 compares the air concentrations of limonene at the five different temperature levels as
an example. The air concentration at 23 oC appears
to be the lowest but the concentrations at the other four temperature levels are almost inseparable. Similar results were observed for other chemicals.
Fig. 2. Example chamber air concentration (limonene).
3.2 Comparison of emission factors
Assuming a steady-state, the emission factors were calculated by the following equation:
A Q C
EF= a (9)
where EF is the emission factor (mg m2 h-1) and A
is the surface area of the specimen (m2). Comparing
emission factors instead of air concentrations is to account for the slight difference in Q or A for each experiment.
Fig. 3. Emission factors of β-pinene for different temperatures at 24, 48, 72 and 100 h.
Fig. 3 presents emission factors at the 24, 48, 72, and 100 hour for β-pinene as a function of the temperature at S2. The emission factors at 24 h increase linearly with increasing temperature up to
33 oC. The similar trend can be found at 72 h and
100 h, but it is not obvious at 48 h. Similar results were observed for other VOCs. This exercise confirms that a point-to-point comparison of emission factors can lead to inconsistent results.
3.3 Comparison of diffusion coefficients
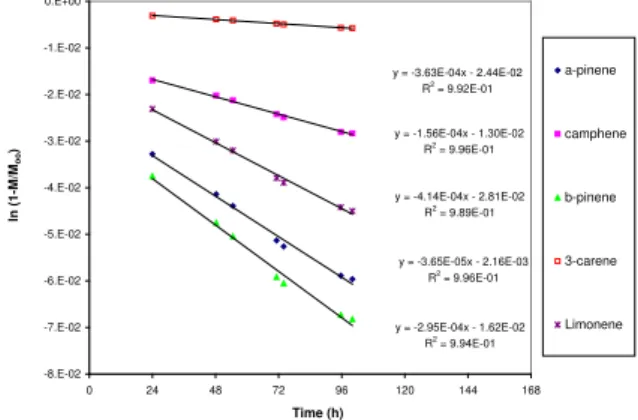
Fig. 4 presents the plot of ln (1-Mt/Moo) versus
time associated with the 33 oC experiment. Because
the preliminary plot of ln (1-Mt/Moo) versus time
(not shown) indicated a change in slope at around the 24 h, the data obtained before the 24 h were not
used for estimating Dm. The excellent R2 values
indicate the validity of the assumption that 24 h is a long enough time for the application of Eq. (8).
Similar levels of R2 were observed for other
experiments.
Fig. 4. The profile of Ln(1-M/Moo) for 33 oC experiment.
The resulting Dm is shown as a function of
material temperature at S2 in Fig. 5. For all
chemicals, Dm increases almost linearly as the
material surface temperature increases to about 33
o
C. After 33 oC, Dm appears to be independent of
surface temperature. The lines in Fig. 5 are from a regression equation (Eq. (11)) between diffusion
coefficient (Dm) and material temperature (T). The
sigmoidal equation with three parameters was chosen from the equation library of SigmaPlot to reflect the linear range and no effect range.
− − + = b T T a D o m exp 1 (11)
where Dm is the diffusion coefficient (m
2
s-1), T is the material temperature at S2 (oC), and a, b, and To
are constants. 0.0001 0.001 0.01 0.1 1 0 24 48 72 96 120 Elapsed time (h) C h a m b e r a ir c o n c e n tr a ti o n ( m g m -3) 23 oC 28 oC 33 oC 38 oC 43 oC 0.00 0.02 0.04 0.06 20 25 30 35 40 45 Temperature at S2 (oC) E m issio n f ac to r ( mg m -2 h -1) 24 h 48 h 72 h 100 h y = -3.63E-04x - 2.44E-02 R2 = 9.92E-01 y = -1.56E-04x - 1.30E-02 R2 = 9.96E-01 y = -3.65E-05x - 2.16E-03 R2 = 9.96E-01 y = -2.95E-04x - 1.62E-02 R2 = 9.94E-01 y = -4.14E-04x - 2.81E-02 R2 = 9.89E-01 -8.E-02 -7.E-02 -6.E-02 -5.E-02 -4.E-02 -3.E-02 -2.E-02 -1.E-02 0.E+00 0 24 48 72 96 120 144 168 Time (h) ln (1-M /M o o ) a-pinene camphene b-pinene 3-carene Limonene
Fig. 5. Diffusion coefficient as a function of temperature at S2.
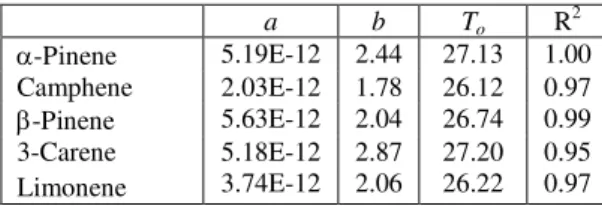
The model constants are summarized in Table 1 along with R2 values. All R2 values are over 0.95,
indicating the regression models can predict Dm
reasonably well within the experimental range. Table 1. Parameters for the sigmoidal relationship
between Dm and material temperature at S2.
a b To R 2 α-Pinene 5.19E-12 2.44 27.13 1.00 Camphene 2.03E-12 1.78 26.12 0.97 β-Pinene 5.63E-12 2.04 26.74 0.99 3-Carene 5.18E-12 2.87 27.20 0.95 Limonene 3.74E-12 2.06 26.22 0.97
It is instructive to compare the results with those
of previous studies. It was reported that Dm of
chemicals in a paint coating was proportional either to air temperature linearly or to air temperature raised to the power of 1.5 to 3.3 [6]. It should be noted that the highest air temperature in the
previous study [6] was 33.5 oC, which corresponds
to the linear range in this experiment. The Arrehnius-type equation, which is most frequently used to describe the relationship between diffusion coefficient and temperature, was observed to work marginally well for the linear region between 23 and 33 oC.
4 Conclusion
A plywood assembly simulating a radiant heating floor system was tested in a small-scale chamber for VOC emissions under five different material temperatures. Based on a mass-transfer model for VOC emissions from dry materials, diffusion coefficients were estimated using the measured data. The results showed that there is a linear relationship between diffusion coefficient of a chemical emitted from the plywood specimen and
material temperature up to 33 oC. Between 33 oC
and 43 oC of material temperature, there was no
temperature effect on the diffusion coefficient.
This study suggests that VOC emissions from a radiant heating floor assembly can be more than that of a conventional floor system. Since there is a finite source of VOC in building materials, the effects may not be long-term (e.g., years). However, the effects may have implications on the maximum concentration in a space and, therefore, the short-term (e.g., months) exposure to occupants.
The effects of material temperature on VOC emissions were not clearly determined by the point-to-point comparison method with which concentrations or emission factors were compared at a particular elapsed time. This indicates that the model-parameter comparison method would be a better quantification method than the point-to-point comparison method.
Acknowledgements
The authors would like to thank Dr. Wenping Yang and Ms. Ewa Lusztyk for the help with the GC/MS.
References
[1] S. Sollinger, K. Levsen and G. Wunsch. Indoor pollution by organic emissions from textile floor coverings: Climate test chamber studies under static conditions. Atmospheric Environment. 28 (1994) 2349-2378.
[2] J.F. Van der Wal, A.W. Hoogeveen and P. Wouda. The influence of temperature on the emission of volatile organic compounds from PVC flooring, carpet, and paint. Indoor Air. 7 (1997) 215-221.
[3] L. Fang, G. Clausen and P.O. Fanger. Impact of temperature and humidity on chemical and sensory emissions from building materials. Indoor Air. 9 (1999) 193-201.
[4] W.S. Cain, R. Schmidt, B.P. Leaderer, J.F. Gent and L.G. Berglund, L.G. Emission of VOCs from materials used in buildings: Analytical and sensory aspects. ASHRAE Transactions. 108 (2002) 283-295.
[5] ASTM. ASTM Standard D5116-97: Standard guide for small-scale environmental chamber determinations of organic emissions from indoor materials/products. 1997. American Society for Testing and Materials.
[6] D. Won and C.Y. Shaw. Quantification of factors affecting VOC emissions from architectural coatings. Atmospheric Environment (submitted for review). (2006). 0.0E+00 2.0E-12 4.0E-12 6.0E-12 8.0E-12 20 30 40 50 Temperature at S2 (oC) Dm (m 2 s -1) a-pinene camphene b-pinene 3-carene Limonene