1
Supporting Information
Azo-Containing Polymers with Degradation On-Demand Feature
Mathieu A. Ayer1
, Yoan C. Simon1,2
, Christoph Weder1
*
1
Adolphe Merkle Institute, University of Fribourg, Chemin des Verdiers 4, CH-1700 Fribourg, Switzerland
2
School of Polymers and High Performance Materials, The University of Southern Mississippi, 118 College Dr., Hattiesburg MS 39406, USA
2 Table of content
Figures S1-S2. FT-IR spectra of azo-PA, ref-PA, azo-PU, and ref-PU. 3 Figures S3-S18. 1
H and 13
C NMR spectra of azo-PA, ref-PA, azo-PU, and ref-PU. 5 Elemental Analyses of pristine and heated azo-PA, ref-PA, azo-PU, and ref-PU. 25 Figures S19-S20. TGA traces of azo-PA, ref-PA, azo-PU, and ref-PU. 27 Figures S21-S24. DSC traces of azo-PA, ref-PA, azo-PU, and ref-PU. 29 Figures S25-S26. DMA traces of azo-PA, ref-PA, azo-PU, and ref-PU. 33 Figures S27-S28. Heating in solution (THF): SEC traces of polyurethanes. 35 Figures S29-S31. Heating in the solid state: SEC traces of polyurethanes. 37 Figures S32-S34. UV light irradiation in solution (THF): UV-Vis spectrum of the azo
compound 2 and SEC traces of polyurethanes. 40
Figures S35-S40. UV light irradiation in the solid state of polyurethanes: UV-Vis spectra, set-up picture, SEC traces and temperature vs. time diagrams. 43 Figures S41-S42. UV light irradiation in the solid state of polyamides: SEC traces and
temperature vs. time diagrams. 48
Figures S43-S45. UV light irradiation in the solid state of dogbone shaped specimens of polyurethanes: set-up pictures and temperature vs. time diagrams. 50 Table S46. Stress-strain data for pristine, heated and irradiated polyurethanes. 53 Figures S47-S51. Visible light irradiation in the solid state: lamp emission spectrum, SEC traces of polyurethanes and temperature vs. time diagrams. 54
3 Fourier transformation infrared (FT-IR) spectra
4000 3500 3000 Wavenumber (cm2500 2000 1500 1000 -1 ) Tr ans mi ttanc e Azo-PA Ref-PA Figure S1. FT-IR spectra of the azo-containing polyamide azo-PA (red) and the reference polymer ref-PA (black).
4 4000 3500 3000 Wavenumber (cm2500 2000 1500 1000 -1 ) Tr ans mi ttanc e Azo-PU Ref-PU
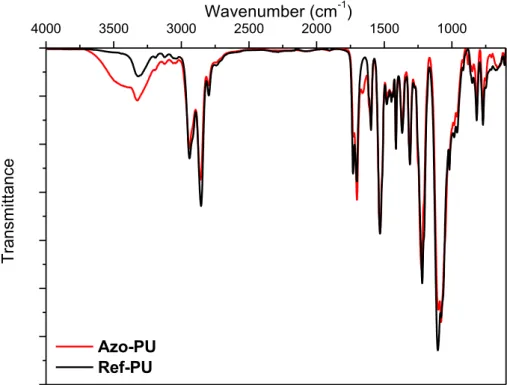
Figure S2. FT-IR spectra of the azo-containing polyurethane azo-PU (red) and the reference polymer ref-PU (black).
5 Figure S3. 400 MHz 1H NMR spectrum of
6 Figure S4. 100 MHz 13
7 Figure S5a. 400 MHz 1H NMR spectrum in CDCl
3
8 Figure S5b. Magnified 400 MHz 1
H NMR spectra in CDCl3 of pristine and heated (solid state, 140 °C for 5 min) azo-PA
Pristine azo-PA
9 Figure S6. 100 MHz 13
C NMR spectrum in CDCl3
10 Figure S7. 400 MHz 1H NMR spectrum of
11 Figure S8. 100 MHz 13
12 Figure S9. 400 MHz 1H NMR spectrum in CDCl
3
13 Figure S10. 100 MHz 13C NMR spectrum in CDCl
3
14 Figure S11. 400 MHz 1H NMR spectrum of azo-PU in THF-d
15 Figure S12. 100 MHz 13
16 Figure S13a. 400 MHz 1H NMR spectrum in THF-d
8
17 Figure S13b. 400 MHz 1
H NMR spectrum in THF-d8
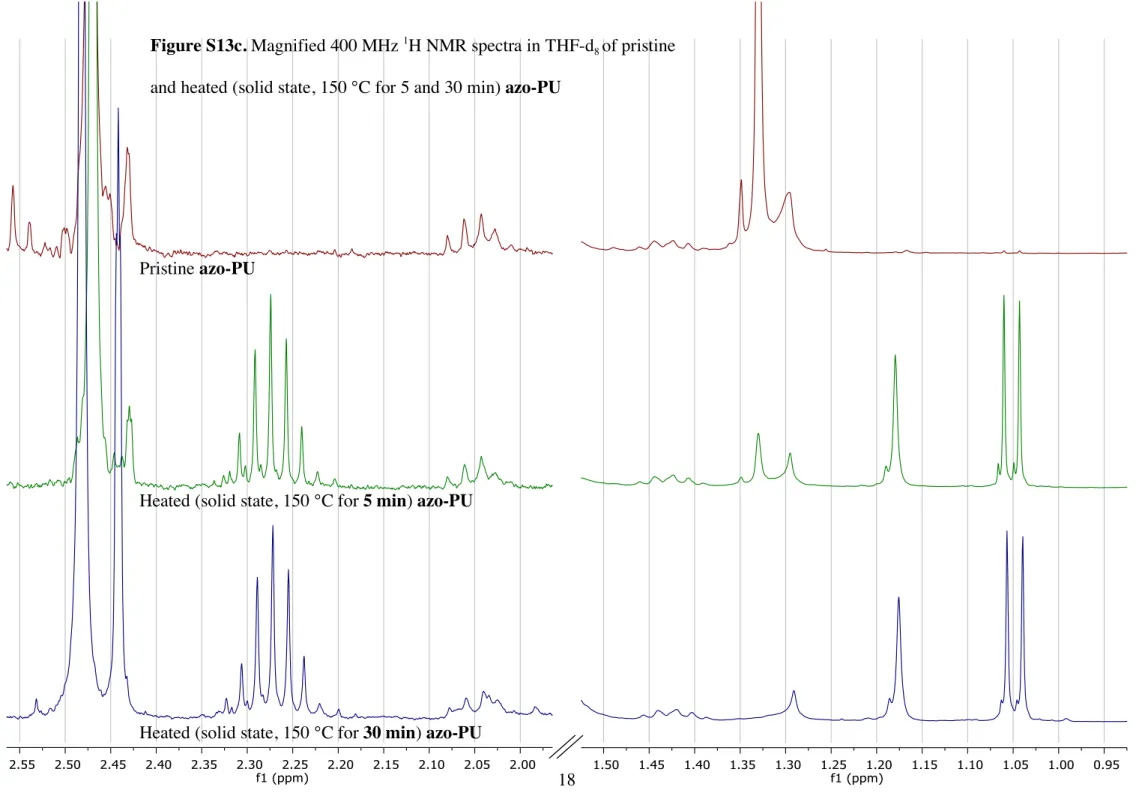
18 Figure S13c. Magnified 400 MHz 1
H NMR spectra in THF-d8 of pristine
and heated (solid state, 150 °C for 5 and 30 min) azo-PU
Pristine azo-PU
Heated (solid state, 150 °C for 5 min) azo-PU
19 Figure S14a. 100 MHz 13C NMR spectrum in THF-d
8 of
20 Figure S14b. 100 MHz 13
C NMR spectrum in THF-d8 of
21 Figure S15. 400 MHz 1
22 Figure S16. 100 MHz 13
23 Figure S17. 400 MHz 1
H NMR spectrum in THF-d8
24 Figure S18. 100 MHz 13
C NMR spectrum in THF-d8
25
Elemental analyses (EA) of pristine and heated azo-PA, ref-PA, azo-PU, and ref-PU Pristine azo-PA
Anal. Calcd: C, 57.03; H, 9.41; N, 2.04. Found: C, 56.5; H, 9.8; N, 2.0.
Heated azo-PA (solid state, 140 °C for 5 min)
Anal. Calcd: C, 57.19; H, 9.45; N, 1.75.*
Found: C, 56.0; H, 9.7; N, 1.8.
*
Assuming dissociation of all azo groups, complete release of N2, and quantitative recombination
of the radicals produced.
Pristine ref-PA
Anal. Calcd: C, 57.30; H, 9.51; N, 1.47. Found: C, 56.2; H, 9.9; N, 1.4.
Heated ref-PA (solid state, 140 °C for 5 min)
26 Pristine azo-PU
Anal. Calcd: C, 66.29; H, 8.98; N, 4.20. Found: C, 65.62; 9.25; N, 3.88.
Heated azo-PU (solid state, 150 °C for 5 min)
Anal. Calcd: C, 66.59; H, 9.06; N, 3.73.*
Found: C, 65.69; 9.20; N, 3.57.
*
Assuming dissociation of all azo groups, complete release of N2, carbon-centered radicals
formed and further reaction, i.e. proton abstraction or recombination.
Pristine ref-PU
Anal. Calcd: C, 66.90; H, 9.27; N, 2.99. Found: C, 66.33; H, 9.53; N, 2.87.
Heated ref-PU (solid state, 150 °C for 5 min)
27 Thermogravimetric analyses (TGA)
50 100 150 200 250 300 350 400 450 500 0 20 40 60 80 100 100 150 200 250 300 350 96 97 98 99 100 Mas s % Rema ini ng Temperature (°C) Azo-PA Ref-PA
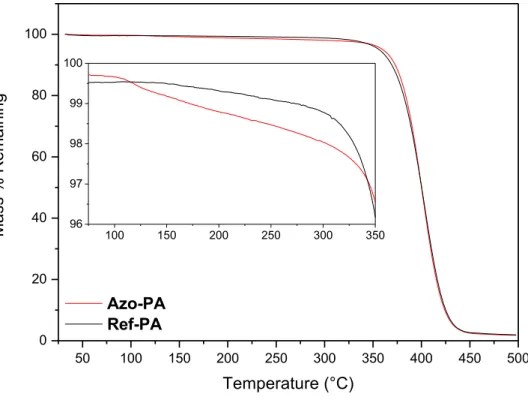
Figure S19. TGA traces of the azo-containing polyamide azo-PA (red) and the reference polymer ref-PA (black) performed under N2 at a heating rate of 10 °C/min. The samples were
dried prior to measurement.
28 50 100 150 200 250 300 350 400 450 500 0 20 40 60 80 100 75 100 125 150 175 200 225 250 275 300 96 97 98 99 100 101 Mas s % Rema ini ng Temperature (°C) Azo-PU Ref-PU
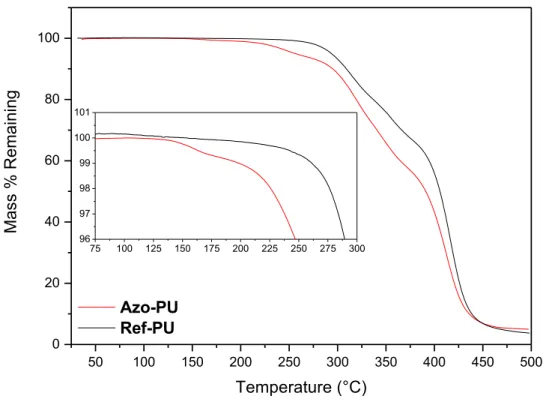
Figure S20. TGA traces of the azo-containing polyamide azo-PU (red) and the reference polymer ref-PU (black) performed under N2 at a heating rate of 10 °C/min. The samples were
dried prior to measurement.
29 Differential scanning calorimetry (DSC)
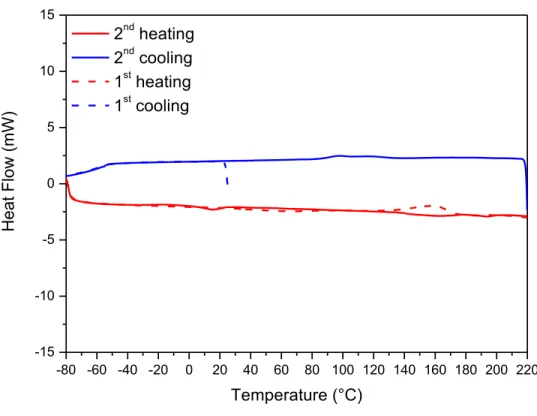
-80 -60 -40 -20 0 20 40 60 80 100 120 140 160 180 200 220 -15 -10 -5 0 5 10 15 Heat Flow (mW ) Temperature (°C) 2nd heating 2nd cooling 1st heating 1st cooling
(a)
-80 -60 -40 -20 0 20 40 60 -15 -10 -5 0 5 10 15 Heat Flow (mW ) Temperature (°C) 2nd heating 2nd cooling 1st heating 1st cooling(b)
Figure S21. DSC thermograms of the azo-containing polyamide azo-PA recorded under N2 at
heating and cooling rates of 10 °C/min in the range from (a) -80 to 220 °C and (b) -80 to 60 °C. The samples (polymer film pieces) were dried prior to the measurements.
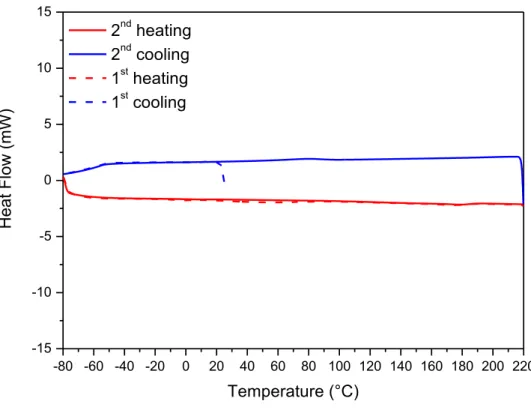
30 -80 -60 -40 -20 0 20 40 60 80 100 120 140 160 180 200 220 -15 -10 -5 0 5 10 15 Heat Flow (mW ) Temperature (°C) 2nd heating 2nd cooling 1st heating 1st cooling
(a)
-80 -60 -40 -20 0 20 40 60 -15 -10 -5 0 5 10 15 Heat Flow (mW ) Temperature (°C) 2nd heating 2nd cooling 1st heating 1st cooling(b)
Figure S22. DSC thermograms of the reference polyamide ref-PA recorded under N2 at heating
and cooling rates of 10 °C/min in the range from (a) -80 to 220 °C and (b) -80 to 60 °C. The samples (polymer film pieces) were dried prior to measurement.
31 -80 -60 -40 -20 0 20 40 60 80 100 120 140 160 180 200 220 -15 -10 -5 0 5 10 15 Heat Flow (mW ) Temperature (°C) 2nd heating 2nd cooling 1st heating 1st cooling Figure S23. DSC thermograms of the azo-containing polyurethane azo-PU recorded under N2 at
heating and cooling rates of 10°C/min. The sample (polymer film piece) was dried prior to measurement.
32 -80 -60 -40 -20 0 20 40 60 80 100 120 140 160 180 200 220 -15 -10 -5 0 5 10 15 Heat Flow (mW ) Temperature (°C) 2nd heating 2nd cooling 1st heating 1st cooling Figure S24. DSC thermogram of the reference polyurethane ref-PU recorded under N2 at heating
and cooling rates of 10°C/min. The sample (polymer film piece) was dried prior to measurement.
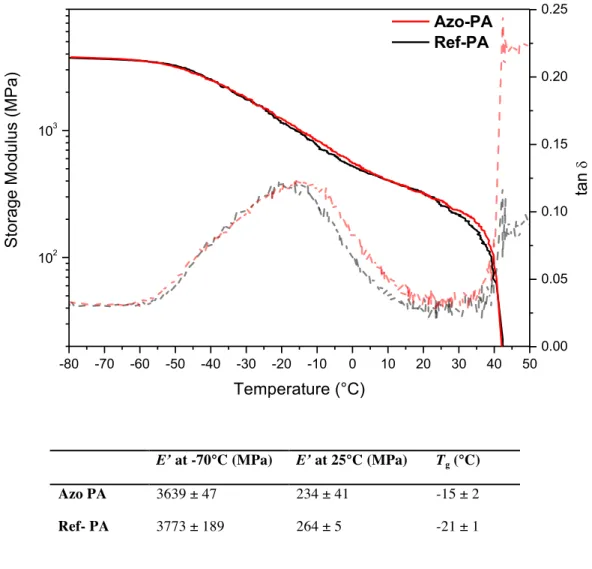
33 Dynamic mechanical analyses (DMA)
E’ at -70°C (MPa) E’ at 25°C (MPa) Tg (°C)
Azo PA 3639 ± 47 234 ± 41 -15 ± 2
Ref- PA 3773 ± 189 264 ± 5 -21 ± 1
Figure S25. Representative dynamic mechanical analysis (DMA) traces of films of the azo-containing polyamide azo-PA (solid red line) and the reference polymer ref-PA (black line). The loss tangent (tan δ) traces of the azo-PA (dashed red line) and the reference polymer ref-PA (dashed black line) are also shown. The measurements were carried out at a heating rate of 3 °C/min and a frequency of 1 Hz under N2. The storage moduli (E’) at -70 and 25 °C and the glass
transition temperatures (Tg, determined from the maxima of the tan δ traces) are also reported.
Values indicated in the table are averages of 3 samples.
-80 -70 -60 -50 -40 -30 -20 -10 0 10 20 30 40 50 102 103 Storage Modul us (MPa) Temperature (°C) Azo-PA Ref-PA 0.00 0.05 0.10 0.15 0.20 0.25 tan d
34
E’ at -70°C (MPa) E’ at 25°C (MPa) E’ at 50°C (MPa) Tg (°C)
Azo-PU 2104 ± 274 18 ± 3 11 ± 3 -38 ± 4
Ref-PU 1993 ± 135 6 ± 3 5 ± 3 -41 ± 2
Figure S26. Representative dynamic mechanical analysis (DMA) traces of films of the azo-containing polyurethane azo-PU (solid red line) and the reference polymer ref-PU (black line). The loss tangent (tan δ) traces of the azo-PU (dashed red line) and the reference polymer ref-PU (dashed black line) are also shown. The measurements were carried out at a heating rate of 3 °C/min and a frequency of 1 Hz under N2. The storage moduli (E’) at -70 and 25 °C and the glass
transition temperatures (Tg, determined from the maxima of the tan δ traces) are also reported.
Values indicated in the table are averages of 3 samples.
-80 -60 -40 -20 0 20 40 60 80 100 120 140 160 180 10-1 100 101 102 103 104 Storage Modul us (MPa) Temperature (°C) Azo-PU Ref-PU 0.0 0.1 0.2 0.3 0.4 0.5 0.6 0.7 0.8 0.9 1.0 tan d
35
Heating in solution (THF): size exclusion chromatography (SEC) traces of polyurethanes
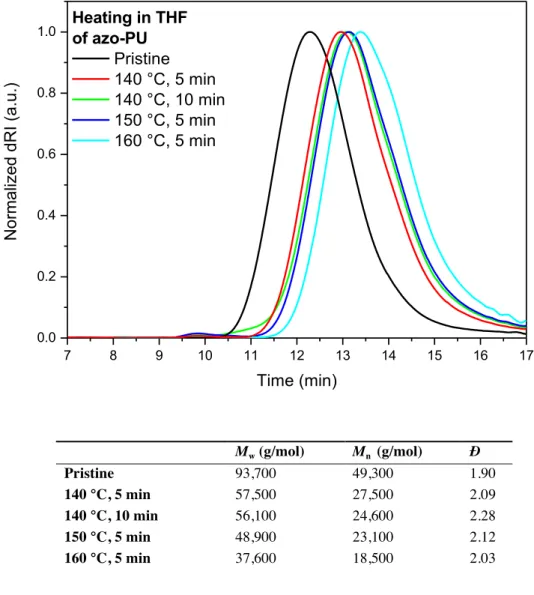
7 8 9 10 11 12 13 14 15 16 17 0.0 0.2 0.4 0.6 0.8 1.0 Normali zed dRI (a.u.) Time (min) Heating in THF of azo-PU Pristine 140 °C, 5 min 140 °C, 10 min 150 °C, 5 min 160 °C, 5 min Mw (g/mol) Mn (g/mol) Đ Pristine 93,700 49,300 1.90 140 °C, 5 min 57,500 27,500 2.09 140 °C, 10 min 56,100 24,600 2.28 150 °C, 5 min 48,900 23,100 2.12 160 °C, 5 min 37,600 18,500 2.03
Figure S27. Size exclusion chromatography (SEC) traces of a pristine sample of the azo-containing polyurethane azo-PU (black line) and samples of azo-PU after heat treatment in solution (THF, microwave synthesizer), at 140 °C for 5 min (red line), 140 °C for 10 min (green line), 150 °C for 5 min (blue line) and 160 °C for 5 min (magenta line). The weight-average (Mw)
and number-average molecular weight (Mn) values are indicated in the table as well as the
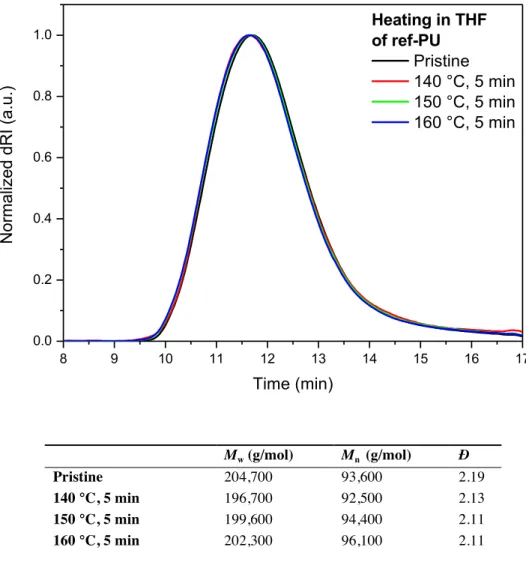
36 8 9 10 11 12 13 14 15 16 17 0.0 0.2 0.4 0.6 0.8 1.0 Normali zed dRI (a.u.) Time (min) Heating in THF of ref-PU Pristine 140 °C, 5 min 150 °C, 5 min 160 °C, 5 min Mw (g/mol) Mn (g/mol) Đ Pristine 204,700 93,600 2.19 140 °C, 5 min 196,700 92,500 2.13 150 °C, 5 min 199,600 94,400 2.11 160 °C, 5 min 202,300 96,100 2.11
Figure S28. Size exclusion chromatography (SEC) traces of a pristine sample of the reference polyurethane ref-PU (black line) and samples of ref-PU after heat treatment in solution (THF, microwave synthesizer), at 140 °C for 5 min (red line), 150 °C for 5 min (green line) and 160 °C for 5 min (blue line). The weight-average (Mw) and number-average molecular weight (Mn)
37
Heating in the solid state: size exclusion chromatography (SEC) traces of polyurethanes
10 11 12 13 14 15 16 17 0.0 0.2 0.4 0.6 0.8 1.0 Normali zed dRI (a.u.) Time (min) Heating in the solid state
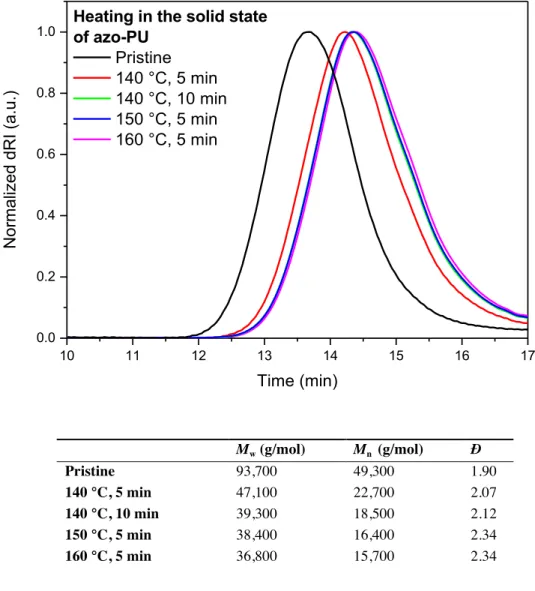
of azo-PU Pristine 140 °C, 5 min 140 °C, 10 min 150 °C, 5 min 160 °C, 5 min Mw (g/mol) Mn (g/mol) Đ Pristine 93,700 49,300 1.90 140 °C, 5 min 47,100 22,700 2.07 140 °C, 10 min 39,300 18,500 2.12 150 °C, 5 min 38,400 16,400 2.34 160 °C, 5 min 36,800 15,700 2.34
Figure S29. Size exclusion chromatography (SEC) traces of a pristine sample of the azo-containing polyurethane azo-PU (black line) and samples of azo-PU after heat treatment in the solid state (pre-heated hot press), 140 °C for 5 min (red line), 140 °C for 10 min (green line), 150 °C for 5 min (blue line) and 160 °C for 5 min (magenta line). The weight-average (Mw) and
number-average molecular weight (Mn) values are indicated in the table as well as the dispersity
38 10 11 12 13 14 15 16 17 0.0 0.2 0.4 0.6 0.8 1.0 Normali zed dRI (a.u.) Time (min) Heating in the solid state
of ref-PU Pristine 140 °C, 5 min 150 °C, 5 min 160 °C, 5 min Mw (g/mol) Mn (g/mol) Đ Pristine 204,700 93,600 2.19 140 °C, 5 min 210,800 93,700 2.25 150 °C, 5 min 208,200 91,800 2.27 160 °C, 5 min 196,400 91,000 2.16
Figure S30. Size exclusion chromatography (SEC) traces of a pristine sample of the reference polyurethane ref-PU (black line) and samples of ref-PU after heat treatment in the solid state (pre-heated hot press), 140 °C for 5 min (red line), 150 °C for 5 min (green line) and 160 °C for 5 min (blue line). The weight-average (Mw) and number-average molecular weight (Mn) values are
indicated in the table as well as the dispersity value (Đ).
39 8 9 10 11 12 13 14 15 16 17 0.0 0.2 0.4 0.6 0.8 1.0 Normali zed dRI (a.u.) Time (min) Heating in the solid state
at 150 °C for 30 min Azo-PU Pristine Heated Ref-PU Pristine Heated Mw (g/mol) Mn (g/mol) Đ Pristine azo-PU 93,700 49,300 1.90 150 °C, 30 min 36,400 14,100 2.58 Pristine ref-PU 204,700 93,600 2.19 150 °C, 30 min 228,800 98,100 2.33
Figure S31. Size exclusion chromatography (SEC) traces of pristine samples of the azo-containing and reference polyurethanes azo-PU and ref-PU (red and black dashed lines) and samples of azo-PU and ref-PU after heat treatment in the solid state (pre-heated hot press) at 150 °C for 30 min (red and black solid lines). The weight-average (Mw) and number-average
40
UV light irradiation in solution (THF): UV-Vis spectrum of the azo compound 2 and size exclusion chromatography (SEC) traces of polyurethanes
300 400 500 600 700 800 0.0 0.1 0.2 0.3 0.4 Abs orbance Wavelength (nm) Compound 2 in water (0.028 M) 2
Figure S32. UV-Vis spectrum of the azo compound 2 in water (0.028 M). The extinction coefficient (371 nm) is 12.32 L· mol-1· cm-1
41 8 9 10 11 12 13 14 15 16 17 0.0 0.2 0.4 0.6 0.8 1.0 Normali zed dRI (a.u.) Time (min) UV irradiation in THF of azo-PU Pristine 7.5 sec 15 sec 15 sec with CCl4 30 sec 60 sec Mw (g/mol) Mn (g/mol) Đ Pristine 93,700 49,300 1.90 7.5 sec 53,100 30,900 1.72 15 sec 41,200 23,700 1.74 15 sec with CCl4 44,500 24,400 1.82 30 sec 41,200 22,200 1.76 60 sec 36,000 21,000 1.71
Figure S33. Size exclusion chromatography (SEC) traces of a pristine sample of azo-containing polyurethane azo-PU (black line) and samples of azo-PU after exposure to UV light in solution (THF, 320-390 nm, 600 mW/cm2), for 7.5 sec (red line), for 15 sec (green line), for 15 sec with
CCl4 (blue line), for 30 sec (magenta line) and for 60 sec (cyan line). The weight-average (Mw)
and number-average molecular weight (Mn) values are indicated in the table as well as the
42 8 9 10 11 12 13 14 15 16 17 0.0 0.2 0.4 0.6 0.8 1.0 Normali zed dRI (a.u.) Time (min) UV irradiation in THF of ref-PU Pristine 7.5 sec 15 sec 15 sec with CCl4 30 sec 60 sec Mw (g/mol) Mn (g/mol) Đ Pristine 204,700 93,600 2.19 7.5 sec 189,700 93,800 2.02 15 sec 200,300 95,400 2.10 15 sec with CCl4 234,400 97,800 2.40 30 sec 255,900 105,800 2.42 60 sec 277,600 110,600 2.51
Figure S34. Size exclusion chromatography (SEC) traces of a pristine sample of the reference polyurethane ref-PU (black line) and samples of ref-PU after exposure to UV light in solution (THF, 320-390nm, 600 mW/cm2
), for 7.5 sec (red line), for 15 sec (green line), for 15 sec with CCl4 (blue line), for 30 sec (magenta line) and for 60 sec (cyan line). The weight-average (Mw)
and number-average molecular weight (Mn) values are indicated in the table as well as the
43
UV light irradiation in the solid state of polyurethanes: UV-Vis spectra, set-up picture, size exclusion chromatography (SEC) traces and temperature vs. time diagrams
300 400 500 600 700 800 0.00 0.25 0.50 0.75 1.00 1.25 1.50 1.75 2.00 Abs orbance Wavelength (nm) Azo-PU Ref-PU
Figure S35. UV-Vis spectra of solid state samples of the azo-containing polyurethane azo-PU (red line) and the reference polymer ref-PU (black line).
Figure S36. Picture depicting the set-up used for the light irradiation processes. The sample (5x5 mm) deposited on a glass slide was irradiated from the top (15 mm distance) and its temperature was monitored with an IR camera from the left.
IR camera Sample Optical fiber Lamp
44 10 11 12 13 14 15 16 17 0.0 0.2 0.4 0.6 0.8 1.0 Normali zed dRI (a.u.) Time (min) UV irradiation in the
solid state of azo-PU Pristine 7.5 sec 15 sec 30 sec 60 sec Mw (g/mol) Mn (g/mol) Đ Pristine 93,700 49,300 1.90 7.5 sec 40,200 20,000 2.01 15 sec 49,300 15,700 3.14 30 sec 65,500 15,200 4.31 60 sec 47,000 14,900 3.15
Figure S37. Size exclusion chromatography (SEC) traces of a pristine sample of the azo-containing polyurethane azo-PU (black line) and samples of azo-PU after exposure to UV light in the solid state (320-390 nm, 600 mW/cm2
), for 7.5 sec (red line), for 15 sec (green line), for 30 sec (blue line) and for 60 sec (magenta line). The weight average (Mw) and number average
45 0 20 40 60 80 100 120 20 25 30 35 40 45 Temperatur e (°C) Time (sec) UV irradiation in the solid state of azo-PU
7.5 sec 15 sec 30 sec 60 sec
Figure S38. Temperature vs. time curves of azo-containing polyurethane azo-PU samples irradiated with UV light in the solid state (320-390 nm, 600 mW/cm2
), for 7.5 sec (red line), for 15 sec (green line), for 30 sec (blue line) and for 60 sec (magenta line). The temperature was monitored with an IR camera.
46 10 11 12 13 14 15 16 17 0.0 0.2 0.4 0.6 0.8 1.0 Normali zed dRI (a.u.) Time (min) UV irradiation in the
solid state of ref-PU Pristine 30 sec 60 sec Mw (g/mol) Mn (g/mol) Đ Pristine 204,700 93,600 2.19 30 sec 244,000 93,400 2.61 60 sec 333,500 110,600 3.02
Figure S39. Size exclusion chromatography (SEC) traces of a pristine sample of the reference polyurethane ref-PU (black line) and samples of ref-PU after exposure to UV light in the solid state (320-390 nm, 600 mW/cm2
), for 30 sec (red line) and for 60 sec (green line). The weight-average (Mw) and number-average molecular weight (Mn) values are indicated in the table as well
47 0 20 40 60 80 100 120 20 25 30 35 40 45 Temperatur e (°C) Time (sec) UV irradiation in the solid state of ref-PU
30 sec 60 sec
Figure S40. Temperature vs. time curves of reference polyurethane ref-PU samples irradiated with UV light in the solid state (320-390 nm, 600 mW/cm2
), for 30 sec (red line) and 60 sec (green line). The temperature was monitored with an IR camera.
48
UV light irradiation in the solid state of polyamides: size exclusion chromatography (SEC) traces and temperature vs. time diagrams
8 9 10 11 12 13 14 15 16 17 0.0 0.2 0.4 0.6 0.8 1.0 Normali zed dRI (a.u.) Time (min) UV irradiation in the
solid state of azo-PA Pristine 15 sec 30 sec Mw (g/mol) Mn (g/mol) Đ Pristine 33,000 23,400 1.41 15 sec 34,000 23,300 1.46 30 sec 34,100 23,300 1.46
Figure S41. Size exclusion chromatography (SEC) traces of a pristine sample of the azo-containing polyamide azo-PA (black line) and samples of azo-PA after exposure to UV light in the solid state (320-390 nm, 600 mW/cm2
), for 15 sec (red line) and for 30 sec (green line). The weight average (Mw) and number average molecular weight (Mn) values are indicated in the table
49 0 20 40 60 80 100 20 25 30 35 40 45 Temperatur e (°C) Time (sec) UV irradiation in the solid state of azo-PA
15 sec 30 sec
Figure S42. Temperature vs. time curves of azo-containing polyamide azo-PA samples irradiated with UV light in the solid state (320-390 nm, 600 mW/cm2
), for 15 sec (red line) and for 30 sec (green line). The temperature was monitored with an IR camera.
50
UV light irradiation in the solid state of dogbone shaped specimens of polyurethanes: set-up pictures and temperature vs. time diagrams
Figure S43. Pictures depicting (a) the set-up used for the UV light irradiation of dogbone shaped specimens of azo-containing and reference polyurethanes azo-PU and ref-PU prior to the stress-strain measurements and (b) two azo-PU dogbone shaped specimens, the top one was irradiated while the bottom one is pristine. The scale is in cm.
(a)
(b)
51 0 10 20 30 40 50 60 70 20 22 24 26 28 30 32 34 36 38 40
UV irradiated dogbone shaped azo-PU specimen
Temperatur e (°C) Time (sec) Temperature elevation (°C) 30 sec irradiations 10.7 ± 0.6
Figure S44. Representative temperature vs. time curve of a dogbone shaped specimen of the azo-containing polyurethane azo-PU irradiated with UV light (320-390 nm, 600 mW/cm2
, 30 sec). The temperature was monitored with an IR camera. The temperature elevation value indicated in the table is an average obtained of the 3 samples used for the stress-strain measurements.
52 0 10 20 30 40 50 60 70 20 22 24 26 28 30 32 34 36 38 40
UV irradiated dogbone shaped ref-PU specimen
Temperatur e (°C) Time (sec) Temperature elevation (°C) 30 sec irradiations 8.0 ± 1.0
Figure S45. Representative temperature vs. time curve of a dogbone shaped specimen of the reference polyurethane ref-PU irradiated with UV light (320-390 nm, 600 mW/cm2
, 30 sec). The temperature was monitored with an IR camera. The temperature elevation value indicated in the table is an average of the 3 samples used for the stress-strain measurements.
53
Stress-strain data for pristine, heated and irradiated polyurethanes
Table S46. Elongation and stress at break values, and Young’s modulus values derived from stress-strain measurements of pristine and samples exposed to heat or UV light.
Elongation at breakc (%) Stress at break c (MPa) Young’s modulusd (MPa) Pristine azo-PU 556 ± 25 81 ± 9 41 ± 1 Heateda 270 ± 35 9 ± 1 24 ± 1 Irradiatedb 333 ± 6 13 ± 1 35 ± 2 Pristine ref-PU 574 ± 14 67 ± 2 19 ± 1 Heateda 606 ± 70 64 ± 19 22 ± 1 Irradiatedb 563 ± 18 75 ± 5 24 ± 1 a
The heat treatment (pre-heated hot press, 150 °C for 5 min) undergone by the samples was applied prior to cut them into a dogbone shape. b
The UV irradiation (320-390 nm, 600 mW/cm2
, 30 sec) was performed in the central area of the dogbone shaped specimens after cutting. c
The elongation and stress at break values are averages from 3 samples. d
The Young’s modulus values are averages from the same 3 samples and derived from the slope of the stress-strain curves between 0.5 and 1.0 %.
54
Visible light irradiation in the solid state: lamp emission spectrum, size exclusion chromatography (SEC) traces of polyurethanes and temperature vs. time diagrams
300 350 400 450 500 550 600 650 700 750 800 850 900 0 1x10⁴ 2x10⁴ 3x10⁴ 4x10⁴ 5x10⁴ 6x10⁴ 7x10⁴ C ou nt s (s -1 ) Wavelength (nm)
Figure S47. Emission spectrum of the visible light emitting source used (Hönle UV lamp equipped with a 390-500 nm filter).
55 10 11 12 13 14 15 16 17 0.0 0.2 0.4 0.6 0.8 1.0 Normali zed dRI (a.u.) Time (min) Visible light irradiation in
the solid state of azo-PU Pristine 30 sec 60 sec Mw (g/mol) Mn (g/mol) Đ Pristine 93,700 49,300 1.90 30 sec 48,000 23,000 2.09 60 sec 35,900 15,800 2.27
Figure S48. Size exclusion chromatography (SEC) traces of a pristine sample of the azo-containing polyurethane azo-PU (black line) and samples of azo-PU after exposure to visible light in the solid state (390-500 nm, 600 mW/cm2
), for 30 sec (red line) and for 60 sec (green line). The weight-average (Mw) and number-average molecular weight (Mn) values are indicated
in the table as well as the dispersity value (Đ).
56 0 20 40 60 80 20 22 24 26 28 30 32 34 36 38 40 Temperatur e (°C) Time (sec)
Visible light irradiation in the solid state of azo-PU
30 sec 60 sec
Figure S49. Temperature vs. time curves of azo-containing polyurethane azo-PU samples irradiated with visible light in the solid state (390-500 nm, 600 mW/cm2
), for 30 sec (red line) and 60 sec (green line). The temperature was monitored with an IR camera.
57 10 11 12 13 14 15 16 17 0.0 0.2 0.4 0.6 0.8 1.0 Normali zed dRI (a.u.) Time (min)
Visible light irradiation in the solid state of ref-PU
Pristine 60 sec Mw (g/mol) Mn (g/mol) Đ Pristine 204,700 93,600 2.19 60 sec 199,500 92,500 2.16
Figure S50. Size exclusion chromatography (SEC) traces of a pristine sample of the reference polyurethane ref-PU (black line) and samples of ref-PU after exposure to visible light in the solid state (390-500 nm, 600 mW/cm2
) for 60 sec (red line). The weight-average (Mw) and
number-average molecular weight (Mn) values are indicated in the table as well as the dispersity
value (Đ).
58 0 10 20 30 40 50 60 70 80 90 20 22 24 26 28 30 32 34 36 38 40 Temperatur e (°C) Time (sec)
Visible light irradiation in the solid state of ref-PU
60 sec
Figure S51. Temperature vs. time curve of a reference polyurethane ref-PU sample irradiated with visible light in the solid state (390-500 nm, 600 mW/cm2
) for 60 sec. The temperature was monitored with an IR camera.