HAL Id: hal-00685117
https://hal.archives-ouvertes.fr/hal-00685117
Submitted on 4 Apr 2012
HAL is a multi-disciplinary open access
archive for the deposit and dissemination of
sci-entific research documents, whether they are
pub-lished or not. The documents may come from
teaching and research institutions in France or
abroad, or from public or private research centers.
L’archive ouverte pluridisciplinaire HAL, est
destinée au dépôt et à la diffusion de documents
scientifiques de niveau recherche, publiés ou non,
émanant des établissements d’enseignement et de
recherche français ou étrangers, des laboratoires
publics ou privés.
New reactor dedicated to in operando studies of model
catalysts by means of surface x-ray diffraction and
grazing incidence small angle x-ray scattering
Marie-Claire Saint-Lager, Aude Bailly, Pierre Dolle, Robert Baudoing-Savois,
Pierre Taunier, Stéphanie Garaudée, Sylvain Cuccaro, Sabine Douillet, Olivier
Geaymond, Gilles Perroux, et al.
To cite this version:
Marie-Claire Saint-Lager, Aude Bailly, Pierre Dolle, Robert Baudoing-Savois, Pierre Taunier, et al..
New reactor dedicated to in operando studies of model catalysts by means of surface x-ray
diffrac-tion and grazing incidence small angle x-ray scattering. Review of Scientific Instruments, American
Institute of Physics, 2007, 78 (8), pp.083902. �10.1063/1.2766821�. �hal-00685117�
New reactor dedicated to in operando studies of model catalysts
by means of surface x-ray diffraction and grazing incidence small
angle x-ray scattering
M.-C. Saint-Lager,a兲 A. Bailly,b兲P. Dolle, R. Baudoing-Savois, P. Taunier, S. Garaudée, S. Cuccaro, S. Douillet, O. Geaymond, G. Perroux, and O. Tissot
Institut Néel, CNRS and Université Joseph Fourier, BP 166, F-38042 Grenoble Cedex 9, France
J.-S. Micha, O. Ulrich, and F. Rieutord
CEA/DRFMC, 17 rue des Martyrs, 38054 Grenoble Cedex 9, France
共Received 11 April 2007; accepted 29 June 2007; published online 9 August 2007兲
A new experimental setup has been developed to enable in situ studies of catalyst surfaces during chemical reactions by means of surface x-ray diffraction共SXRD兲 and grazing incidence small angle x-ray scattering. The x-ray reactor chamber was designed for both ultrahigh-vacuum 共UHV兲 and reactive gas environments. A laser beam heating of the sample was implemented; the sample temperature reaches 1100 K in UHV and 600 K in the presence of reactive gases. The reactor equipment allows dynamical observations of the surface with various, perfectly mixed gases at controlled partial pressures. It can run in two modes: as a bath reactor in the pressure range of 1 – 1000 mbars and as a continuous flow cell for pressure lower than 10−3 mbar. The reactor is connected to an UHV preparation chamber also equipped with low energy electron diffraction and Auger spectroscopy. This setup is thus perfectly well suited to extend in situ studies to more complex surfaces, such as epitaxial films or supported nanoparticles. It offers the possibility to follow the chemically induced changes of the morphology, the structure, the composition, and growth processes of the model catalyst surface during exposure to reactive gases. As an example the Pd8Ni92共110兲 surface structure was followed by SXRD under a few millibars of hydrogen and during butadiene hydrogenation while the reaction was monitored by quadrupole mass spectrometry. This experiment evidenced the great sensitivity of the diffracted intensity to the subtle interaction between the surface atoms and the gas molecules. © 2007 American Institute of Physics.
关DOI:10.1063/1.2766821兴
I. INTRODUCTION
In the field of catalysis, surface science aims to better understand of the catalytic process at both the atomic and molecular scales. By contrast to industrial applications or other research approaches where microporous catalysts or powders of supported nanoparticles are used, surface science deals with model catalysts such as extended flat surfaces of single crystals elaborated in ultrahigh-vacuum共UHV兲 envi-ronment. However, more recently, studying systems closer to real catalysts and in 共semi-兲 realistic reaction conditions is becoming a very active research field of surface science. Par-ticularly, many efforts are done to bridge the so-called “pres-sure and material gaps,” experimentally but also theoreti-cally. Regarding this last point, the most common approach uses first-principles atomistic total energy combined with gas phase thermodynamics.1,2The atomic structure predicted by minimizing the total energy of the surface exposed to a gas phase at high pressure can be quite different from the one at low pressure. On the experimental side many developments
have been done to directly monitor the surface during cata-lytic reaction. New surface science tools must be conceived and designed to be compatible with the high pressure of reactive gases. Some standard surface science probes are in first view ruled out, particularly those which strongly interact with matter. Even though sophisticated devices involving differentially pumped pressure cells allow to perform x-ray photoemission, electron microscopy, low energy ion scatter-ing, and soft x-ray absorption in high pressure conditions, some other techniques are much more evident such as scan-ning tunnelling microscopy 共STM兲 even if in situ measure-ments need well-adapted instrumeasure-ments.1 Other techniques dealing more with the interaction of molecules with surfaces such as polarized reflection absorption infrared spectroscopy3 共RAIRS兲 and sum frequency generation4 共SFG兲.
Actually one of the most promising techniques for in situ structural investigations of surfaces is surface x-ray diffrac-tion共SXRD兲 which is, compared to low energy electron dif-fraction共LEED兲, not restricted to low pressure environments nor to noninsulating samples. The original setup devoted to in situ measurements of solid/gas interfaces by SXRD was built on the ID03 beamline at the European Synchrotron Ra-diation Facility共ESRF兲.5Thanks to this instrument, a strong
a兲Author to whom correspondence should addressed; electronic mail:
marie-claire.saint-lager@grenoble.cnrs.fr
b兲Present address: CEA-LETI, Minatec, 17 rue des Martyrs, 38054 Grenoble
Cedex 09, France.
temperature-dependant structural change of the Ni共110兲 sur-face was evidenced in the presence of a few millibars of carbon monoxide共CO兲. At room temperature, the high pres-sure and UHV structures are identical, whereas at 400 K, the CO high pressure induces a restructuring of the Ni substrate that develops strained共111兲 microfacets.6The modifications of the Pd8Ni92共110兲 surface under butadiene and hydrogen, as well as during butadiene hydrogenation at elevated pres-sure, at 300 K, were also studied with this high pressure chamber.7 The 共N⫻1兲 reconstruction was found to be still present. The main changes were observed for a surface peak intensity under pure hydrogen and during butadiene hydro-genation. Another experiment was devoted to the structural characterization of the surface oxide during CO oxidation on Pt共110兲.8This work illustrated the good complementarity be-tween in situ SXRD and STM. Morphology changes of the surface during CO oxidation corresponding to the activity cycle were first evidenced by STM共Ref. 9兲 and were then
correlated to the structural changes by SXRD. These experi-ments allowed to clearly show that the oxide surface is the more active.
The purpose of this new experimental setup was to ex-tend SXRD studies to more complex surfaces such as thin epitaxial films or supported nanoparticles. This needs to con-nect the x-ray reactor to an auxiliary UHV chamber to pre-pare these complex surfaces just before the x-ray experiment. In addition such a chamber can be equipped with Auger elec-tron spectroscopy共AES兲 allowing to also chemically probe the surface.
For supported nanoparticles, information about their morphology共size, shape, cluster density, etc.兲 are crucial and a particularly relevant technique is grazing incidence small angle x-ray scattering 共GISAXS兲. One of the first experi-ments was done on gold aggregates deposited on a flat sur-face of silicon.10 In situ measurements during Pd nanopar-ticle growth on MgO共100兲 共Ref.11兲 show how GISAXS can
be very promising for in situ catalytic reactions. Several works report in situ GISAXS during nanoparticle growth for catalysis but in UHV conditions.12Very recently the thermal stability of supported platinum clusters was studied by in situ GISAXS in UHV and in the presence of hydrogen,13 but none of them concerns measurements under pressures corre-sponding to realistic reaction conditions.
For well organized supported nanoparticles the same in-formation, added to the structure, can be extracted from SXRD. Such a study was performed during the oxidation of Pd nanoparticules on MgO共100兲.14
In this work, the sample was not in situ prepared and was thus exposed to air before the SXRD measurements.
This article is divided into two main parts. First, a de-tailed description of the setup is given. The second one pre-sents the first experimental results it allowed to obtain by SXRD during butadiene hydrogenation on Pd8Ni92共110兲.
II. DESIGN OF THE EXPERIMENTAL SETUP A. Global requirements
The aim of this new experimental setup is thus to study model catalysts which are prepared under UHV environment
and then analyzed by SXRD or GISAXS under catalytic re-action conditions. To meet this purpose a geometry with two horizontally connected chambers was chosen: the x-ray reac-tor chamber and an UHV chamber. The sample is prepared and characterized in the UHV chamber. It is then transferred under UHV conditions in the x-ray reactor, designed for both UHV and reactive gas environments to perform in operando studies. This latter point means that a special attention was paid to the choice of the materials inside the reactor.
The whole setup was designed to be mounted on the “Goniomètre Multi-Techniques”共GMT兲 of the French BM32 beamline at ESRF.15This diffractometer is a versatile instru-ment dedicated to surface and interface studies. Although it can handle heavy and large experimental setups, the avail-able space is limited. Another feature of the setup is the possibility of easily moving it between the laboratory and synchrotron environments allowing classical studies共sample preparation and reaction conditions兲 prior to allocated beam time at ESRF.
B. Goniometer head and coupling to the GMT diffractometer
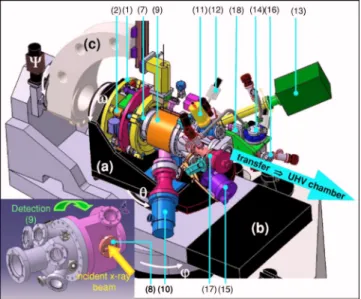
The labels used in the following description refer to Figs.1–3. The design of the whole setup is represented in Fig.1. The GMT diffractometer geometry is of the “2 + 2” type.16 The sample surface is held in a vertical position; defines the polar incident beam angle and, the azimuthal rotation. The detector motions arefor the out-of-plane ro-tation and for the in-plane one.
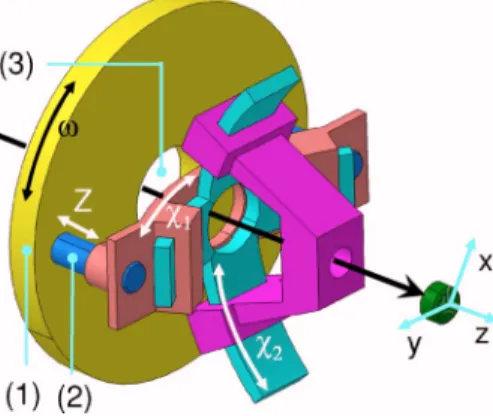
SXRD and GISAXS require a grazing incidence angle together with a highly accurate positioning of the sample surface inside the incident x-ray beam. This is ensured by a goniometer head with three degrees of freedom共see Fig.2兲:
two crossed tilts,1and2, with perpendicular rotation axes, which allow the alignment of the surface sample normal with the axis of the rotation, and the Z translation to put the surface sample at the diffractometer homocenter.
FIG. 1.共Color online兲 Overview of the reactor mounted on the GMT dif-fractometer. The reactor is set on thetable共a兲, 共b兲 is thedetector table and共c兲 is thedetector arm. The reactor equipments are detailed in the text. The large arrow indicates the UHV transfer to the preparation chamber.
The whole mechanics is held on the large circular flange 共1兲 fixed on the circle of the GMT diffractometer. The Z translation is guided by four prestressed columns 共2兲 and geared by one motor and two screws; its amplitude is ±2 mm with a twist less than 0.01°. The Z positioning accuracy and reproductiveness are ±1m, controlled by an encoder 共Ren-ishaw RGH24W兲 with 0.2m resolution. The two rocker cradles of the1and2rotations are also represented in Fig.
2. Their amplitude is ±2° with a confusion circle diameter less than 2m. Figure 4 illustrates the accuracy and the reproducibility of these motions as record with TiO2 surface oxide in the direct beam for the Z translation关Fig.4共a兲兴 and
on the reflectivity for the two1and2rotations关Figs.4共b兲
and4共c兲, respectively兴.
As shown on the section of the goniometer head and of the reactor chamber共Fig.3兲, the design is very compact
fit-ting into the limited available space of the table关label 共a兲 in Fig. 1兴. The distances between the diffractometer
ho-mocenter are 275 mm to the vertical support and 252 mm to the horizontal platform. The whole mechanics stands within a cylinder共D⫻H=400⫻100 mm2兲 offering a free axial cy-lindrical hole of 120 mm diameter共3兲. This available space inside the mechanics is occupied by an extension of the
re-actor chamber made of a bellows共4兲. The end of this exten-sion is fixed on the goniometer head by a welded flange共5兲 which moves with the 1, 2, Z, and motions and onto which the sample holder 共6兲 is mounted. This bellows 共4兲 allows for the 1, 2, and Z motions of the sample holder inside the main volume of the reactor, which is fixed onto the circle of the GMT diffractometer. The coupling between the movable extension, including the sample holder共6兲, and the fixed part of the reactor chamber is made by a CF63 RNN-250/3 differentially pumped rotary platform from Thermionics共7兲 enabling the rotation共360°兲.
The movable part of the reactor chamber can be baked with a heating removable device installed, at the atmosphere, in a tube 共21兲 within the sample holder. A stainless steel screen surrounds the bellows 共4兲 to protect the mechanics FIG. 2.共Color online兲 The three degrees of freedom of the goniometer head:
1,2, and Z. The relative scales are not respected to evidence the assembly
principle. The straight black arrow indicates the laser beam path.
FIG. 3. Vertical cross section of the mechanics and of the reactor. The laser beam device used for the sample heat-ing is also shown.
FIG. 4.共Color online兲 共a兲 Intensity of the x-ray direct beam recorded during the Z translation of the TiO2sample after its surface normal was aligned
with theof the diffractometer. The working position is defined when the intensity is divided by two. Between the two curves, several motions were performed;,1, and2rotations, and Z translation. The shift between the
two curves is less than 2m, showing the high accuracy and the reproduc-tiveness of the motions.关共b兲 and 共c兲兴 1and 2 variations on the TiO2
reflectivity taken around an incident angle two times the critical angle共0.13° at 18 keV兲. As for 共a兲 several motions separated the two curves on each figure and their discrepancy is less than 5°/1000°.
during the bakeout. In addition zirconium oxide insulators are inserted between the end flange共5兲 of the reactor and its mounting on the mechanics. Two thermocouples are also set in the mechanics to monitor its temperature during the bakeout.
C. The reactor chamber
The reactor, in which the sample is studied under reac-tive conditions with the synchrotron beam, is made of stain-less steel. For clarity, it can be divided into three main parts. The first is the movable part described just above. It includes the sample holder and its heating device共discussed in Part Sec. II D兲.
The second part is the main body of the chamber: it is equipped with two beryllium windows共Brushwellman com-pany兲 for the incoming and scattering x-ray beams. The re-actor shape is a cylinder truncated on the side of the incident x-ray beam共see insert in Fig.1and the cross section in Fig.
3兲. This was especially designed to be compatible with
GISAXS and to allow the addition of antiscattering slits. The entrance beryllium window is mounted on a CF40 port共8兲. The large exit beryllium window共9兲 is welded on the cylin-drical part of the reactor chamber共200 mm diameter兲 allow-ing the detection of scattered beams from −1° up to 95° in the in-plane direction 共兲 and from −1° up to 40° in the out-of-plane one共兲.
The third part is equipped with several ports for the re-actor equipment.
• A turbomolecular pump 共10兲, protected by an automated butterfly valve, is installed on a CF63 port for pumping down to UHV共pumping speed: 210 l/s for N2兲.
• Three pressure gauges allow the pressure monitoring from 10−10mbar up to 1 bar: a cold cathode gauge 共11兲 for UHV and two capacitance diaphragm gauges共12兲 for 10−4 up to 1 mbar and for 1 up to 1000 mbars.
• The gas composition in the reactor can be monitored by a quadrupole mass spectrometer共Prisma™ QMS 200 M1 of Pfeiffer兲 共13兲 mounted behind a CF40 gate valve. For pres-sures higher than 10−6mbar, the reactants and products are sampled through a leak valve.
• A subsidiary turbomolecular pump共14兲 is hung on the re-actor chamber共pumping speed: 60 l/s for N2兲 and coupled to an UHV gauge. It supplies pumping for the equipments which must not be exposed to a high pressure of gases such as the mass spectrometer and the ion sputtering gun. • The sample temperature is measured with an external in-frared pyrometer共15兲 共Impac IPE 140 MB 10兲 pointing to the sample surface through a sapphire view port. The spec-tral band is 3 – 5m and the nominal temperature range is 300– 1300 K with 0.1 K resolution for the emissivity ranging from 0.1 to 1. The minimum readable temperature depends on the emissivity: 300 K for =1 and 350 K for =0.1.
• Two view ports allow one to look inside the reactor. They are localized in the vertical plane, symmetric relative to the sample surface normal, and are used for laser alignment of the normal along the axis.
• The gas input共16兲 is isolated by an electropneumatic CF16 gate valve in line with a stainless steel microvalve and a 0.6 l reservoir with a capacitive pressure gauge 共10−4– 1 mbar兲. This setting allows two operation modes:
共i兲 Fast expansion of the high pressure of a reactive mixture by the remote opening of the electropneu-matic valve. The surface diffraction and gas analy-ses are thus performed instantaneously and simul-taneously just after the expansion and then followed in a static mode. The reactor turbomo-lecular pump has been previously isolated from the reactor chamber by closing its electropneumatic CF63 butterfly valve. The two electropneumatic valves are controlled by a pilot regulated by the chamber and the reservoir pressures. In this con-figuration the microvalve acts to diminish the speed of the gas flux to avoid a shock wave in the reactor during the expansion.
共ii兲 Low pressure gas exposures 共⬍10−3mbar兲 are made in a dynamical mode: the two electropneu-matic valves are opened and the gas flux is manu-ally regulated by the microvalve aperture.
The reservoir is connected to the gas manifold where gases and the reactive mixture are stored before being introduced in the reactor. It is equipped with a 1 – 1000 mbars capacitive pressure gauge. The manifold is pumped with an ancillary pumping station共primary and turbomolecular pumps兲. This station can also be connected to the reactor for rough pump-ing after gas exposures at pressure close to the atmosphere. • An ion sputtering gun共17兲 can be mounted behind a CF40
gate valve ensuring its isolation during gas exposures. It is also connected to the subsidiary turbomolecular pump共14兲 via a right-angle CF16 valve. When the ion gun is mounted on the reactor it allows the preparation of single crystal surfaces in UHV environment, directly in the reactor, with-out any transfer to the preparation chamber.
The reactor ends with a CF63 gate valve共18兲 to connect it to the UHV chamber. The reactor total volume is approxi-matively 5.5 l.
D. Sample heating
The sample is heated by a laser beam as first done by Kuhrs and et al.17 A high-power fiber-coupled laser diode 共Jenoptik JOLD-50-CPXI兲 generates a 808 nm beam with a power of up to 50 W. The external power supply 共Delta Electronika SM 156100兲 delivers an operating current up to 45 A corresponding to the maximum heating power. The stable working temperature of the diode is achieved by water cooling.
The scheme of Fig.3shows the laser heating setup. The laser beam is guided up to the reactor by a multimode fiber 共600m diameter兲 ended by an SMA connector with an op-tical aperture of 0.22共corresponding to the sine of the aper-ture angle兲. The collimation is achieved by an optical system 共19兲 chosen to give a spot with a diameter of 10–11 mm at the sample position. This collimation optics is held at the entrance of the mechanics; a ball bearing coupling avoids
twisting of the optical fiber during azimuthal rotation of the goniometer head. The whole optical system and the fiber can be removed during the reactor bakeout. The collimated beam 共20兲 enters a stainless steel tube 共21兲 supported by the reactor end flange共5兲. The other end of this tube is welded to a silica window and it ensures the reactor airtightness. Even if the silica reflectivity is low for the laser wavelength, it is not negligible and for the maximum diode power the reflected part can reach almost 4 W. To avoid damages of the diode by the power reflected back in the fiber, the silica window is tilted 5° relative to the laser beam. It is surrounded, inside the reactor, by a concentric cylinder共6兲 ended by a support which is fixed on an alumina thermal insulating ring. On this support, sample holder共Molybloc兲 共22兲 can be locked with a mechanical transfer rod. The sample mounting on the Moly-bloc is shown on Fig.5.
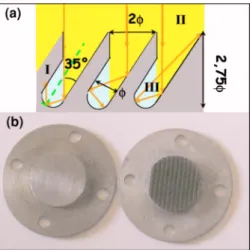
Compared to the setup of Kuhrs et al.,17only one 50 W laser diode was used but the efficiency of the heating was improved. The most common metals used in catalysis are, for example, platinum or palladium, which have a very high reflectivity in the near infrared region. For this reason, most of the laser beam is lost by backreflection. An absorber was thus inserted on the path of the laser beam, in close contact with the sample in order to heat it by thermal conduction. For catalytic reactions involving hydrogen and hydrocar-bons, a molybdenum piece can be used to absorb the incident laser power. Nevertheless, the Mo reflectivity, even for a rough surface, is still equal to 0.55 at 808 nm. Darkening the absorber was not enough to make it as close as possible to a blackbody. The absorption was thus made more efficient thanks to tilted ribs machined on the laser beam illuminated side of the absorber共see Fig. 6兲. The rib geometry was
op-timized in order to trap most of the photons by way of a multiple-reflection process共at least two reflections兲. The la-ser diode power supply can be controlled by a PID pilot regulated by the sample temperature measured by the IR pyrometer.
The performance of this laser heating was checked by measuring the temperature on the absorber and on the sample. The emissivity used for the IR pyrometer was cali-brated with the help of a thermocouple provisionally in-stalled at the end of a wobble stick. As shown in Fig.7, the sample surface temperature can reach 1100 K in UHV. In reactive gas environment the maximum temperature is lim-ited to 600 K. It is limlim-ited by the thermal exchange with the air. But also because above this temperature the interaction of the molecules with the reactor walls and the sample holder becomes non-negligible compared to the sample surface activity.
E. The UHV preparation chamber
The UHV preparation chamber is connected to the reac-tor by a communication UHV chamber through which the sample mounted on its Molybloc共Fig.5兲 moved with a
me-chanical transfer rod. The UHV chamber is also equipped with a small ancillary load-lock chamber for extracting the sample of the setup back to air and installing an another one. The pumping is achieved with turbomolecular, ionic, and titanium sublimation pumps.
There are two working levels separated by 136 mm height:共i兲 the transfer level and 共ii兲 the preparation and char-acterization level with an electron bombardment source and a Knudsen-type evaporator for deposition, a retractable quartz microbalance to calibrate the flux, a retractable LEED/AES共Omicron NanoTechnology兲, an electron gun for medium energy electron diffraction 共MEED兲, and an ion sputtering gun共argon and oxygen ions兲. In this chamber the FIG. 5.共Color online兲 Pictures of 共a兲 the sample mounted on a Molybloc
and共b兲 the different parts needed for mounting the sample on the Molybloc.
FIG. 6.共Color online兲 共a兲Scheme of photon trapping between the ribs 共I兲, machined in the laser beam illuminated side of the absorber. Each photon of the laser beam共II兲 is reflected at least two times before escaping from the trap, region III is the space between the ribs where the laser beam goes after the first reflection.共b兲 Top view of the machined Mo absorber 共on the right兲 with a width 2between two ribs equal to 1 mm, compared to an Mo flat surface共on the left兲. At normal incidence the machined surface looks darker than the flat one.
FIG. 7.共Color online兲 Temperature on the Mo absorber and on the surface sample in UHV as a function of the current supplied to the laser diodes. The measurement was done with a thermocouple mounted on a wobble stick for the Mo absorber and with the IR pyrometer for the sample. In both cases the errors bars are inside the symbols.
Molybloc with the sample is locked on an oven with heating by electron bombardment.
The sample holder is mounted on a manipulator with two perpendicular horizontal translations, and a vertical translation 共parallel to the surface sample兲, plus a rotation around the vertical axis. Several view ports are also installed, two of them are at an angle of 55° symmetric relative to the surface normal to offer the possibility of performing surface differential reflectivity spectroscopy共SDRS兲.
III. FIRST RESULTS AND PERFORMANCE: SURFACE X-RAY DIFFRACTION DURING BUTADIENE
HYDROGENATION ON Pd8Ni92„110…
To assess the performance of this setup, SXRD was per-formed during butadiene hydrogenation on the共110兲 surface of the Pd8Ni92alloy. The ion gun was installed on the reactor chamber to clean the surface sample and the UHV prepara-tion chamber was not necessary. First of all we checked that without the sample no reaction occurs in the reactor cham-ber.
A. Previous results
This study was the continuation of a published work.7In this article we showed that the 共N⫻1兲 reconstruction 共N = 5 – 6兲 observed for the clean Pd8Ni92共110兲 consits of undu-lating outer dense rows, constituted mainly of Pd atoms which segregate to the surface. In the alloy surface plane, the Pd–Pd interatomic distances are shorter than in pure palla-dium. On the contrary the first interlayer spacing is larger. This reconstruction allows partial relaxation, of the strain due to the 10% lattice mismatch between Pd and Ni atoms.
The共N⫻1兲 surface reconstruction was still visible in the presence of butadiene, hydrogen, and even during the buta-diene hydrogenation performed under elevated pressure 共5–50 mbars兲 at 300 K. The main modifications concerned the surface diffraction peak intensities. A large and fast de-crease of the共0 1 0.028兲 surface peak intensity was observed at the beginning of the butadiene hydrogenation reaction 共0.5 mbar butadiene and 5 mbar hydrogen兲. Afterwards the intensity of this surface diffraction peak gently evolved dur-ing the course of the reaction correlative to the two steps of the reaction. It turned out that the large intensity decrease at the beginning of the reaction was the same as that observed under 5 mbars, of pure hydrogen. Moreover a similar
behav-ior for the 共01兲 rod in the presence of pure hydrogen and during butadiene hydrogenation experiments was observed. This led us to conclude that the role of hydrogen was essen-tial during the reaction. But, as pointed out in Ref. 7, this was in apparent contradiction with generally admitted con-cepts issued from the kinetics of this reaction on Pd-based catalysts. Thus, the aim of this new experiment was 共i兲 to reproduce the previous results obtained with the high-pressure chamber of ID03 共Ref. 5兲 to check the new setup
and共ii兲 to extend the data collection over additional points in the reciprocal space to better understand the respective role of each component of the reactive gas mixture on the struc-tural changes.
B. UHV results
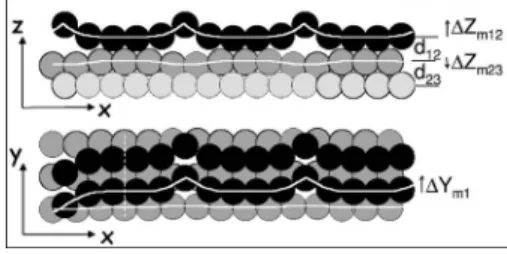
The Pd8Ni92共110兲 surface was prepared by a series of Ar+sputtering and annealing at 1000 K until an共N⫻1兲 re-construction similar to that already observed7was obtained. The SXRD data were recorded at a beam energy of 18 keV, at grazing incidence 共0.2°兲. Measurements were first per-formed under UHV in a base pressure of 2.10−9 mbar. The 共N⫻1兲 reconstruction model, sketched on Fig.8, was used to fit the data along the 共10兲, 共01兲, 共11兲, and 共02兲 crystal truncation rods 共CTRs兲 and their equivalents. As shown in TableI, the geometrical parameters were found very close to those previously reported.7
C. Results under high pressure of hydrogen and under reaction conditions
The surface was then exposed to 10 mbars of hydrogen 共N55 gas purity兲 and the intensities at 共1 0 0.03兲 and 共0 1 FIG. 8. Side and top views of the structure of the clean Pd8Ni92共110兲共5
⫻1兲 surface as deduced from surface x-ray diffraction data in Ref.7. X and Y are in the surface plane共X corresponding to the dense rows 关11¯0兴兲 and Z is perpendicular to the surface. The dark circles represent surface Pd atoms and the light ones the bulk共Pd or Ni兲 atoms.
TABLE I. Structural parameters obtained for the Pd8Ni92共110兲 reconstruction, as checked in Fig.8and obtained
by fitting SXRD data. Three different sets of values are reported: in UHV from Ref.7, in UHV with the present experimental setup and this work under 10 mbars of hydrogen.is the surface roughness, c1and c2are the Pd
concentrations in the surface layers 1 and 2, respectively,⌬d12is the global shift of interlayer distance between
the first and the second atomic layers relative to the bulk reference,⌬d23is the same for layers 2 and 3,⌬Ym1
is the amplitude of the in-plane row oscillation for the first layer,⌬Zm12is the amplitude of the out-of-plane row
oscillation for the first layer, and⌬Zm23is amplitude of the out-of-plane row oscillation for the second layer.
exp  c1 c2 ⌬d12 ⌬d23 ⌬Ym12 ⌬Zm12 ⌬Zm23
UHVa 0.34 1 0.1 0.057 0.00 0.42 0.32 −0.1
UHV 0.31 1 0.1 0.052 0.046 0.35 0.35 −0.2
h2 0.31 1 0.1 0.063 0.042 0.5 0.3 −0.2
aReference7.
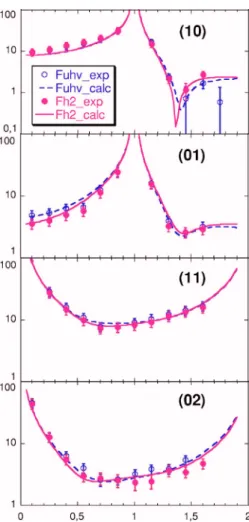
0.03兲 were followed for several hours. The first one did not vary, while the second dropped at the very beginning of the exposure and then kept a constant value. Interestingly, it re-covered its initial intensity after pumping hydrogen. As the diffracted intensities are stable during the hydrogen exposure it was possible to record the共10兲, 共01兲, 共11兲, and 共02兲 CTRs and their equivalents under 10 mbar hydrogen in order to compare the structure to the UHV one. Figure9 shows the experimental structure factor together with the calculated ones. The same model as in UHV was used to fit the data recorded under hydrogen pressure but with different param-eters as shown in TableI. The two main differences concern 共i兲 the expansion of the first interlayer spacing indicating the presence of subsurface hydrogen and共ii兲 an enhancement of the amplitude of the surface dense rows modulation in the Y direction.
The surface was finally studied under 5 mbars of a butadiene/hydrogen mixture with the ratio 1:8共N25 gas pu-rity for butadiene兲. Figure 10共a兲shows the evolution of the partial pressures of butadiene, butenes, and butane in the reactor. With the reaction is totally selective with respect to butenes during the whole time of butadiene conversion. The reactor volume being large, the reaction rate was initially
slow but was significantly accelerated by increasing the sample temperature from room temperature 共300 K兲 up to 500 K. Once the butadiene was completely converted into butenes, the hydrogenation of butenes to butane starts.
Figures 10共b兲 and 10共c兲 show the diffracted intensities recorded simultaneously at共0 1 0.03兲 and at 共1 0 0.03兲. The first values 共region 2兲 correspond to the exposure to pure hydrogen, before and after the CTR recording for the struc-ture determination described just before. It can be seen in Fig.10共b兲that the intensity at共0 1 0.03兲 is reduced by about 40°% compared to its UHV value共region 1兲 as soon as hy-drogen is introduced and it stays constant all the time during CTR measurement. Afterwards, it recovers its UHV value when hydrogen is evacuated共region 3兲. On the contrary the 共1 0 0.03兲 intensity is not influenced by the hydrogen pres-sure as shown in Fig.10共c兲.
The reactive mixture introduction 共region 4兲 induces a small intensity drop of both diffraction peaks followed by a gentle decrease during the first hydrogenation step 共conver-FIG. 9.共Color online兲 Comparison between the experimental 共circles兲 and
the calculated共line兲 structure factors along the 共10兲, 共01兲, 共11兲, and 共02兲 CTRs. Empty circles are for UHV measurements and filled ones are for those under 10 mbar H2.
FIG. 10.共Color online兲 共a兲 1,3-butadiene hydrogenation monitored by mass spectrometry.关共b兲 and 共c兲兴 Diffracted intensity evolution during the reaction at共0 1 0.03兲 and 共1 0 0.03兲, respectively. The time scale is the same for the three figures; the Y scale was normalized to the butadiene initial value for the partial pressure in共a兲 and to the UHV value for each diffracted intensity plot in共b兲 and 共c兲. In region 1 the sample is cleaned in UHV, in region 2 it is exposed to 10 mbars, of hydrogen 共during the exposure CTR data re-ported in Fig.9are recorded兲, and in 3 the reactor chamber was pumped down to UHV. The black vertical arrow indicates the moment when the reactive mixture is introduced, regions 4 and 5 correspond to the butadiene conversion into butenes at 300 K and then at 500 K, respectively. In region 6 the butene conversion into butane takes place.
sion of butadiene into butenes兲. This behavior is almost not modified when the sample temperature is increased up to 470 K to speed up the reaction共region 5兲. Once the butadi-ene is totally transformed, the surface diffraction peak inten-sities start to slowly increase while the second part of the reaction, butene hydrogenation into butane, is in progress 共region 6兲.
D. Discussion
The present results for the 共0 1 0.03兲 surface peak are consistent with those of the previously published work.7 However, since it was possible to record more data at the same time, the present experiment gives a more precise de-scription of the Pd8Ni92共110兲 surface during the butadiene hydrogenation. First, and quite significantly, the surface ap-pears to be clearly not the same under pure hydrogen as under the reactive mixture. The correlation between the dif-fracted intensities and the two steps of the reaction evidences that the catalyst surface atoms interact differently with the reactive molecules during the two steps. Indeed, the selectiv-ity of this surface with respect to butenes, defined by the ratio 关butenes/关butenes+butane兴兴, is high. It depends on the relative adsorption coefficient of butadiene and butenes on the surface in reaction conditions. It is higher on palla-dium for butadiene than for butenes.18Thus, as long as buta-diene is present in the gas phase, it prevents butane forma-tion by removing butenes from the active sites at the surface.19
It was checked that on a sputtered unannealed Pd8Ni92共110兲 surface, which means disordered and without Pd segregation, no significant reaction occurred under the same butadiene and hydrogen pressures. This stresses that the strong enhancement of the activity of the alloy surface compared to pure Pd共more than one order of magnitude19兲 is directly linked to the strained palladium atoms. It can be assumed that the amplitude of the diffracted intensity varia-tion is roughly correlated with the strength of the binding between the surface atoms and the gas molecules. Indeed, the curves in Figs.10共b兲and10共c兲show that the intensity loss is less important during the second step of the reaction when butenes are absorbed at the surface compared to the first step. Moreover, as already reported,7 the effect of pure butadiene on the diffracted intensity is less important compared to the reactive mixture including hydrogen. This supports the fact that the butadiene absorption mode may be different under a high pressure of hydrogen compared to a free-hydrogen environment.
IV. FURTHER DEVELOPMENT
A new experimental setup has been designed allowing to follow by SXRD and GISAXS the surface structure under 共semi-兲 realistic reaction conditions of model catalysts elabo-rated in an UHV environment. It was tested by studying the Pd8Ni92共110兲 surface during the butadiene hydrogenation and under hydrogen pressure. The high accuracy of the sample positioning in the incident x-ray beam allowed to record surface diffraction data at grazing incidence. The sample surface was cleaned in an UHV environment 共Ar+
sputtering and annealing兲. The surface structure was then monitored under a few millibars of reactive gases, while the reaction products were followed by mass spectrometry. This experiment evidenced the great sensitivity of the diffracted intensity to the subtle interaction between the surface atoms and the reactant molecules. The efficiency of SXRD for such studies is now well established, the limit coming from the common use of point detector. This means long time in order to record the relevant data to determine the structure and to wholly catch the structural changes. Improvements will be obtained by implementing two dimensional 共2D兲 detector.
More recently new experiments were realized with this setup by adding transfer to the connected UHV preparation chamber. It allowed to successfully perform Auger electron spectroscopy in order to probe the chemical surface compo-sition variation induced by reactive gases. The Au30Pd70共111兲 alloy surface was studied under few millibars of hydrogen and during butadiene hydrogenation; the results will be published elsewhere. Concerning the GISAXS facil-ity, studies in 共semi-兲 realistic conditions of supported gold nanoparticles, directly elaborated in the connected UHV chamber, are under progress and will be the subject of a further publication.
ACKNOWLEDGMENTS
All the CNRS-SERAS staff are gratefully acknowledged for their help as well as the staff of the BM32 CRG beam-line. The authors would also acknowledge S. Ferrer, O. Ro-bach, H. Isern 共who worked on the ESRF ID03 beamline during the setup building兲, Y. Jugnet, 共IRCE-Villeurbanne兲, and M. De Santis共Institut Néel Grenoble兲 for fruitful discus-sions. The authors also thank the ESRF and CNRS security offices for their advices concerning the laser beam and the gas manifold installations, as well as ESRF and their com-mittees for beam time allocation. The authors associated to these thank J.-P. Levy who is now retired.
1See B. L. M. Hendricksen, S. Bobaru, and J. Frenken, Top. Catal. 36, 43
共2005兲, and references therein.
2D. Loffreda, L. Piccolo, and P. Sautet, Phys. Rev. B 71, 113414共2005兲. 3Y. Jugnet, F. J. Cadete Santos Aires, C. Deranlot, L. Piccolo, and J. C.
Bertolini, Surf. Sci. 521, L639共2002兲.
4T. Dellwig, G. Rupprechter, H. Unterhalt, and H.-J. Freund, Phys. Rev.
Lett. 85, 776共2000兲.
5P. Bernard, K. F. Peters, J. Alvarez, and S. Ferrer, Rev. Sci. Instrum. 70,
1478共1999兲.
6K. F. Peters, C. J. Walker, P. Steadman, O. Robach, H. Isern, and S. Ferrer,
Phys. Rev. Lett. 86, 5325共2001兲.
7M.-C. Saint-Lager et al., Surf. Sci. 587, 229共2005兲. 8M. D. Ackermann et al., Phys. Rev. Lett. 95, 255505共2005兲.
9B. L. M. Hendriksen and J. W. M. Frenken, Phys. Rev. Lett. 89, 046101
共2002兲.
10A. Naudon and D. Thibaudière, J. Appl. Crystallogr. 30, 822共1997兲. 11G. Renaud et al., Science 300, 1416共2003兲.
12R. E. Winans, S. Vajda, B. Lee, S. J. Riley, S. Seifert, G. Y. Tikhonov, and
N. A. Tomczyk, J. Phys. Chem. B 108, 18105共2004兲; B. Lee, S. Seifert, S. J. Riley, G. Tikhonov, N. A. Tomczyk, S. Vajda, and R. E. Winans, J. Chem. Phys. 123, 074701共2005兲; G. Renaud, AIP Conf. Proc. 748 共Mod-ern Trends in Physics Research兲, 63 共2005兲.
13S. Vajda, R. E. Winans, J. W. Elam, B. Lee, M. J. Pellin, S. Seifert, G. Y.
Tikhonov, and N. A. Tomczyk, Top. Catal. 39, 161共2006兲.
14N. Kasper, A. Stierle, P. Nolte, Y. Jin-Phillipp, T. Wagner, D. G. de
Oteyza, and H. Dosch, Surf. Sci. 600, 2860共2006兲.
15http://www.esrf.fr/exp_facilities/BM32/index.htm
16K. W. Evans-Lutterodt and M.-T. Tang, J. Appl. Crystallogr. 28, 318
共1995兲.
17C. Kuhrs, M. Swoboda, and W. Weiss, Top. Catal. 15, 13共2001兲. 18See J. C. Bertolini and Y. Jugnet, in The Chemical Physics of Solid
Sur-faces, Surface Alloys and Alloy SurSur-faces, edited by D. P. Woodruff 共Elsevier, New York, 2002兲, Vol. 10, Chap. 11, p. 404, and references therein.
19A. C. Michel, L. Lianos, J. L. Rousset, P. Delichère, N. S. Prakash, J.