OATAO is an open access repository that collects the work of Toulouse
researchers and makes it freely available over the web where possible
Any correspondence concerning this service should be sent
to the repository administrator:
[email protected]
This is an author’s version published in:
http://oatao.univ-toulouse.fr/21412
To cite this version:
Saillard, Romain
and Viguier, Bernard
and Odemer, Grégory
and
Pugliara, Alessandro
and Fori, Benoit and Blanc, Christine
Influence of
the microstructure on the corrosion behaviour of 2024 aluminium alloy
coated with a trivalent chromium conversion layer. (2018) Corrosion Science,
142. 119-132. ISSN 0010-938X
Influence of the microstructure on the corrosion behaviour of 2024
aluminium alloy coated with a trivalent chromium conversion layer
R. Saillard
a, B. Viguier
a, G. Odemer
a, A. Pugliara
a, B. Fori
b, C. Blanc
a,⁎aCIRIMAT, Université de Toulouse, CNRS, INP-ENSIACET, 4 allée Emile Monso, BP 44362, 31030 Toulouse Cedex 4, France bMECAPROTEC Industries, 34 Boulevard de Joffrery, BP 30204, 31605 Muret Cedex, France
A R T I C L E I N F O Keywords: A. Aluminium A. Copper A. Intermetallics A. Metal coatings B. Cyclic voltammetry B. EIS A B S T R A C T
The influence of 2024 aluminium alloy microstructure on the protective properties of trivalent chromium process (TCP) coatings was studied: samples aged at 190 °C were analysed by comparison to a T3 state. The surface Cu coverage after deoxidation was higher for long-aged samples because nanometer scale Cu-rich pre-cipitates formed during ageing behaved as distinct electrochemical entities and contributed to the formation of copper deposits. The growth mechanisms and kinetics of TCP coatings were directly related to the surface Cu coverage: thicker but more defective TCP coatings formed on long-aged samples leading to the lowest anti-corrosion properties.
1. Introduction
Aluminium alloys are largely used in the aeronautical field because of their low density close to 2.7 g cm−3 and their high mechanical properties due to the addition of some alloying elements such as copper, zinc or lithium [1]. However, these alloying elements lead to a het-erogeneous microstructure and increase the alloy susceptibility to lo-calised corrosion [2–6].
2024 aluminium alloy (AA 2024) is one of the most used alloys for aircraft manufacturing. Copper and magnesium are the major alloying elements in this alloy; they are involved in the formation of inter-metallic coarse particles (IMCs), the composition of which is widely discussed in the literature [7–10]. When the alloy is exposed to an aqueous solution, these particles can act as anodic sites or cathodic sites compared to the aluminium matrix, and even evolve, due to composi-tion changes, from anodic to cathodic sites [4,5,11,12]. Such differ-ences in electrochemical reactivity lead to galvanic coupling processes between matrix and IMCs associated with pitting corrosion [4,13,14].
To protect the alloy against corrosion, surface treatments are used, such as conversion processes for parts that require electrical con-ductivity. For more than 50 years, chromate treatments based on hex-avalent chromium have been used for their outstanding anti-corrosion properties: they show good barrier properties, are less susceptible to chloride adsorption and correspond to self-healing coatings [15–18]. Nevertheless, hexavalent chromium is harmful for the health and the environment and is destined to disappear to comply with the REACH
regulation (Registration, Evaluation and Authorisation of CHemicals) [18,19]. In this framework, manufacturers in the aeronautics field have developed new conversion processes based on trivalent chromium and referred as TCP (Trivalent Chromium Process).
Actually, TCP coatings are considered as promising solutions to replace hexavalent chromium-rich coatings. However, their antic-orrosion properties strongly depend on the underlying microstructure. Qi et al. studied the growth mechanism of a TCP coating on AA 2024-T351 focusing on the difference between the coating developed on the matrix and that grown on IMCs [20]. They observed a thicker TCP coating on S-phase particles, the formation of the conversion layer being controlled by the local increase of pH [21,22]. After dealloying, S-phase particles constituted cathodic sites where protons and oxygen reduction occurred. Due to the local increase of pH they produced, those reactions promoted the precipitation of TCP coating, i.e. chro-mium- and zirconium-rich layer [11]. Moreover, Meng et al. studied the effect of copper content in a 7xxx aluminium alloy on the protective properties of chromate conversion coatings [23]. With copper content in the range [0.013–2.0 wt. %], they observed better corrosion re-sistance for samples with low copper content. The authors attributed the detrimental effect of copper to the copper enrichment of the sample surface after pre-treatments for samples containing a high copper amount. However, depending on the initial copper amount of the alloy, copper does not exist in the same chemical form. In the AA 2024, copper is involved in IMCs (Al-Cu-Mg or Al-Cu-Mn-Fe types); it is pre-sent in supersaturated solid solution (α-Al) but can be prepre-sent also,
⁎Corresponding author.
E-mail address:[email protected](C. Blanc).
following composition: 40 g L−1of sodium tripolyphosphate, 40 g L−1 of borax and 5 mL L−1of Turco 4215 additive. Afterwards they were deoxidised in the Socosurf A1858/A1806 bath (Socomore, France), i.e. a pH = 1 sulfo-nitro-ferric solution, for 5 min at 50 °C. After degreasing and deoxidation, the pre-treated samples were first immersed for
10 min in the TCS conversion solution (32% v/v Socosurf TCS provided by Socomore, France, pH between 3.8 and 4) without bath agitation at 40 °C; during this step, the open circuit potential was measured for all samples to study the growth kinetics of the TCP coatings. This step was followed by an immersion of the coated samples in the post-treatment PACS solution (10% v/v Socosurf PACS provided by Socomore, France, 5% v/v H202at 35% v/v in water, pH between 4.2 and 5.3) at room temperature for 5 min. All the conversion steps were followed by a rinsing step under reverse osmosis water. All reactants used are of in-dustrial quality. Finally, samples were dried at 60 °C during 10 min. For coated samples, all tests were performed at least 48 h after the con-version treatment.
2.3. Experimental methods and techniques
2.3.1. Analysis of the microstructure and characterisation of the TCP coatings
An optical microscope (OM, MA200 by Nikon) was used to observe the samples after electrochemical etching with a Flick reagent (3.5 ml of HBF4in 96.5 ml of deionised water) to determine the grain size. OM observations also allowed different types of IMCs to be observed but, for a more accurate analysis, IMCs were characterised by using a Scanning Electron Microscope (SEM VEGA 3 by TESCAN) coupled with Energy Dispersive X-ray spectroscopy (EDS BRUKER). All analyses were per-formed at an accelerating voltage of 15 kV. Observation of finer pre-cipitates required the use of a Scanning Electron Microscope with a Field Emission Gun (FEG-SEM FEI HELIOS 600i) for intergranular pre-cipitates and a Transmission Electron Microscope with a Field Emission Gun operated at 200 kV (FEG-TEM JEOL JEM 2100F) for intragranular hardening precipitates. For the TEM observations, the samples were ground with abrasive paper SiC 1200, 2400 and 4000 down to 100 μm, cut in discs of 3 mm diameter and electropolished at −15 °C in TenuPol-5with 900 ml of CH3OH and 300 ml of HNO3. Both SEM and FEG-TEM observations were performed using apparatus available in the Raimond Castaing Microanalysis Center (Toulouse, France). Hardness measurements performed with a micro-hardness instrument (Omnimet-2100 by BUEHLER)with a Vickers indenter and a 500 g load completed the characterisation of the specimens.
Concerning the TCP coatings, samples were prepared with a Scanning Electron Microscope – Focused Ion Beam (FEI HELIOS 600i) using a Gallium Ionic Canon. In a first step, they were covered by a gold deposit then an electronic carbon coating (thickness of 0.5 μm) using Naphtalene (C10H8) as a precursor (experimental conditions: 5 kV and 2.5 nA). Then, a 3 μm thick ionic platinum coating was deposited using Methylcyclopentadieny(tri-methyl)platinium (C5H4CH3Pt(CH3)3)) as a precursor (experimental conditions: 30 kV and 0.43 nA). Cutting was operated at 30 kV and 47 nA to 80 pA.
2.3.2. Electrochemical measurements
All the electrochemical measurements were performed with a three electrodes cell (with a platinum electrode as counter electrode and a saturated calomel electrode as reference) by using a VSP-128 Biologic potentiostat. The corrosion behaviour was analysed for uncoated and coated samples in a 10−1M Na
2SO4+ 10-3M NaCl solution and in a 0.5 M NaCl solution respectively. The NaCl solution was considered as representative of the electrolyte used for industrial tests performed for coated samples but was too aggressive for uncoated samples. For un-coated samples, open circuit potential (OCP) measurements were per-formed by recording values with a 1 s interval for 90 min.
Table 1
Chemical composition of the 2024 aluminium alloy (weight percent).
Elements Al Si Fe Cu Mn Mg Cr Ni Zn Ti Zr
wt. % Bal. 0.08 0.15 4.4 0.51 1.4 0.01 54 ppm 0.17 0.02 0.01
depending on the metallurgical state, in the form of hardening pre-cipitates (clusters of solute elements, GP zones and S’/S-Al2CuMg or θ’/ θ-Al2Cu phases). Considering the ability to define a critical feature sizes in the context of corrosion of Al-alloys as shown by Ralston et al. [14], an analysis of the effect of copper on the anticorrosion properties of the TCP coatings depending on its chemical form would be clearly of both scientific and industrial interest.
Therefore, this study attempts to provide some new insights about the role of the alloy microstructure on the anticorrosion properties of TCP coatings and focussed on AA 2024 and its major alloying element, i.e. copper. Different samples corresponding to ageing treatments from a T3 state at 190 °C for durations between 0 to 72 h were considered in order to have a set of samples with copper in different chemical forms. Clearly, such ageing treatments will lead to a decrease of the me-chanical properties of the alloy and do not have an industrial interest from this point of view. However, the aim here is to increase the knowledge concerning the influence of copper on the protective prop-erties of the TCP coatings, as requested by the industrial partners of the NEPAL project in which this work was involved. Therefore, the dif-ferent microstructures were studied by Scanning Electron Microscopy with a Field Emission Gun (FEG-SEM) and Transmission Electron Microscopy with a Field Emission Gun (FEG-TEM). Their corrosion behaviour was studied by open circuit potential and potentiodynamic polarisation measurements. Then, the copper enrichment of the sample surface after pre-treatments was measured by cyclic voltammetry. Finally, the growth kinetics and morphology of the TCP coatings on both T3 and aged AA 2024 samples were studied and the corrosion behaviour of the coated samples was evaluated by open circuit poten-tial and electrochemical impedance spectroscopy measurements. 2. Materials and methods
2.1. Materials
The material studied was AA 2024 cold rolled 3 mm thin sheet with the chemical composition given in Table 1. The alloy was provided in the T3 metallurgical state, i.e. hot rolled, cold rolled, solution heat treated, water quenched, stress relieved and naturally aged at room temperature. Samples in T3 state were referred as T3-reference samples. Then, in order to induce copper precipitation, heat treatments were performed for some T3 samples. The heat treatments consisted in an ageing at 190 °C for 1 h, 12 h or 72 h from the T3 metallurgical state; the samples were referred as 190-1, 190-12 and 190-72 aged samples respectively. Before the experiments, all samples were ground with abrasive paper SiC 1200, 2400 and 4000 then polished with diamond paste down to 1 μm. Then, they were ultrasonically cleaned in demi-neralised water for 30 s.
2.2. Preparation of the TCP coated samples
The whole TCP included a first step of pre-treatment followed by a second step of conversion layer growth. Regarding the pre-treatment step, the samples were first degreased with acetone. Then, they were degreased for 20 min at 60 °C in a pH = 9 alkaline solution with the
the frequency range studied was [105
–10−2] Hz. All the experiments were carried out in electrochemical cells (Gamry Instruments PTC1™ Paint Test Cell) with an exposed area of 10 cm². For all samples and all conditions, at least 3 EIS diagrams were plotted to ensure the re-producibility of the results.
In order to determine the copper content after each step of the pre-treatments, cyclic voltammetry (CV) experiments were done in a dea-erated solution purged by nitrogen gas. The electrolyte was a pH 8.4 borate buffer solution with the following composition: 8.17 g L−1of sodium borate (Na2B4O7) and 7.07 g L−1of boric acid (H3BO3). The CV experiments consisted in three CV scans from −0.70 V/SCE to 0.3 V/ SCE then back to −1.2 V/SCE at a sweep rate of 1 mV s−1. Samples were held at −0.70 V/SCE for 5 min before the first cycle, 10 min be-fore the second and 20 min bebe-fore the third. The first two cycles al-lowed the signal corresponding to aluminium oxidation to be reduced. Therefore, only the third cycle was analysed to calculate the surface copper coverage by determining the area under Cu(0) → Cu(I) peak as explained by Scully [24,25] and Davenport [26].
3. Results and discussion
3.1. Microstructure and corrosion behaviour of uncoated samples 3.1.1. Microstructure of the T3-reference and aged AA 2024 samples
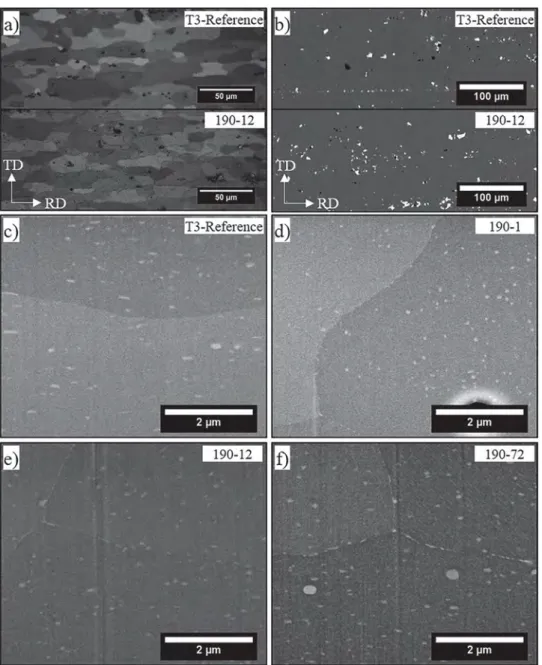
Results showed that, at the OM and SEM scales, both T3-reference and aged samples showed an equivalent microstructure. All AA 2024 samples had a recrystallised microstructure as shown inFig. 1a for the T3-reference and 190-12 samples. This was easily explained by the thermo-mechanical treatment applied which allowed enough strain energy to be stored to promote recrystallisation during the solution heat treatment [27]. The grain size was not affected by the ageing treatment at 190 °C (Fig. 1a). The samples showed an average grain size of about 22 μm in the rolling direction RD and 19.2 μm in the transverse direc-tion TD [28]. SEM observations revealed two types of IMCs (Fig. 1b), i.e. Al2CuMg particles (S-phase) with a spherical shape (mean surface area close to 2.4 μm²) and Al-Cu-Mn-Fe type IMCs with an irregular shape (mean surface area close to 7.3 μm²). The composition of the last was investigated in many works [10,29–32]. At the FEG-SEM scale, while no intergranular precipitation was visible for the T3-reference sample (Fig. 1c), observations revealed the grain boundaries for the aged samples (Fig. 1d, e and f) due to the presence of large inter-granular precipitates in relation with the ageing treatment at 190 °C. The influence of the ageing duration was evident with less visible grain boundaries for the 190-1 aged sample (Fig. 1d) due to a lower pre-cipitation rate while, for the 190-72 sample, numerous and large in-tergranular precipitates were easily seen in the FEG-SEM micrograph (Fig. 1f).
To go further, TEM analyses were performed for both T3-reference and aged samples (Fig. 2). At this scale, observations revealed dis-persoid particles (shown by a black arrow inFig. 2b) with an average size of 200 nm and composed of Cr, Zr or Mn. Several authors identified dispersoids as T-phase with the Al20Cu2Mn3 stoichiometry [32,33]. Dispersoids were formed during homogenisation and could not be dissolved with the ageing treatment due to their low solubility. They were helpful to control the recrystallisation process as can be seen in
Fig. 2a and d, where grain boundaries are pinned by dispersoids (shown by a white arrow).
Then, hardening precipitates were observed also as fine acicular precipitates (Fig. 2c, d and e). As largely described in the literature, two
sequences of precipitation can be distinguished for Cu and Mg-con-taining Al alloys, i.e. precipitation of intermediates of θ-phase (Al2Cu) and precipitation of intermediates of S-phase (Al2CuMg) [34–36], with the θ:S ratio depending on Cu:Mg ratio. For a ratio close to 3:1, char-acteristic of the alloy studied in this work, the precipitation sequence can be described as proposed by Bagaryatsky [36]:
SSS → GPB zone → S’’/GPB2 → S’ → S-Al2CuMg
where SSS symbolises the supersaturated solid solution and GPB are the Guinier Preston Bagaryatsky zones which correspond to a short range ordering of Cu and Mg atoms [36] and result from interactions between Cu-Mg co-clusters and dislocations [33,37,38]. S’’ or GPB2 is an or-thorhombic phase (space group Imm2) coherent with the matrix with a reported Al5Cu3Mg3stoichiometry [31,39]. Finally, both S’ and S-phase are orthorhombic (space group Cmcm) with a similar Al2CuMg stoi-chiometry [40]. The difference between the two last phases is that S’-phase is semi-coherent with the matrix whereas S-S’-phase is incoherent with lattice parameters slightly different [31,41]. For the T3-reference sample (Fig. 2a), no GPB zone was observed, even with HRTEM ob-servations (not shown here). However, their presence was strongly suspected due to natural ageing and hardness values close to 141 HV compared to a freshly solution treated sample (hardness close to 123 HV) [42]. GPB zones were known for their hardening property by distorting the lattice of the adjacent matrix, thereby creating obstacles to dislocation motion [38]. After 1 h of ageing at 190 °C, significant change in the microstructure was observed with the precipitation of fine intragranular precipitates that were clearly noticed inFig. 2c. For 190-12 and 190-72 samples, a dense needle-shape precipitation was noticed in the grains (Fig. 2d and e), with bigger precipitates after 72 h of ageing treatment than after only 12 h.Fig. 3showed an intragranular precipitate for the 190-12 sample observed in HRTEM (Fig. 3a) and the corresponding Fast Fourier Transform (FFT) pattern (Fig. 3b). By comparing inter-planar distances with calculations of reciprocal space carried out under a crystallography software (Fig. 3e), the precipitate was identified as the S/S’-phase base-centered orthorhombic Al2CuMg of Cmcm space group [33,40,43].
Moreover, as previously observed at the FEG-SEM scale, inter-granular precipitates formed when the ageing treatment duration was increased (Fig. 2b, d and e). Fine spaced intergranular precipitates were present for 190-1 sample (Fig. 2b). As the heat treatment duration in-creased, these precipitates became larger and formed continuous pre-cipitation at the grain boundaries (Fig. 2d and e). Fig. 3showed an intergranular precipitate for the 190-12 sample observed in HRTEM (Fig. 3c) as well as the corresponding FFT pattern (Fig. 3d). By com-paring inter-planar distances with calculations of reciprocal space (Fig. 3e), the precipitate was identified, as for the intragranular one, as the S/S’-phase base-centered orthorhombic Al2CuMg of Cmcm space group [44]. Finally,Fig. 2e showed the presence of a Precipitate Free Zone (PFZ) due to the intergranular precipitation and subsequent de-pletion in Cu of the surrounding matrix for 190-72 samples (same ob-servation for 190-12 samples).
3.1.2. Corrosion behaviour of the uncoated AA 2024 samples
Fig. 4showed OCP curves for the T3-reference and aged AA 2024 samples in 10−1M Na
2SO4+ 10−3M NaCl. Samples were immersed for 90 min and, for each sample, a corrosion potential (Ecorr) value was calculated by considering the mean of the OCP values for the last 30 min: Ecorrvalues are reported inTable 2. Results showed a global decrease of the corrosion potential with the ageing duration. A first strong decrease of Ecorr (82 mV) was noticed after 1 h at 190 °C and could be linked with the intergranular and very fine intragranular Cu-rich precipitation observed for the 190-1 sample (Fig. 2b and c), leading to a first decrease of the Cu amount in solid solution. Then, a second decrease of Ecorrwith a smaller amplitude (about 30 mV) was observed for both the 190-12 and 190-72 samples, for which a continuous Potentiodynamic polarisation curves were plotted after 90 min at the
corrosion potential (Ecorr). Anodic and cathodic parts were recorded − separately from Ecorr at a potential sweep rate of 0.07 mV s 1. The corrosion resistance of the coated samples was characterised by OCP measurements and electrochemical impedance spectroscopy (EIS) with measurements performed at Ecorr for different immersion times until 21 days. The amplitude of the potential disturbance was 20 mV (rms) and
intergranular and a dense intragranular precipitation (Fig. 2d and e) led to a stronger Cu depletion of the solid solution. Comparison of OCP curves plotted for both 190-12 and 190-72 samples showed that the growth of the precipitates did not seem to influence the corrosion po-tential of the alloy, with similar values for the two samples.
To explain the results, one could consider that the measured po-tential during OCP tests represented an average electrochemical beha-viour for the alloy. In the studied alloy, the phase with the largest surface area was the supersaturated solid solution so that the corrosion potential measured depended almost only on the concentration of al-loying elements in this phase and especially on the Cu content [45,46] with an ennobling effect of Cu upon Al [47]. Literature data clearly show that the corrosion potential of the Al matrix becomes more ne-gative in a slightly aggressive electrolyte when the Cu amount in solid solution decreases [12]. In the present study, the higher the precipita-tion rate, the more the Al solid soluprecipita-tion was depleted in Cu and the more its corrosion potential decreased.
Further,Fig. 5shows that the polarisation curves plotted for the four samples in chloride-containing sulphate solution have a similar global shape. However, significant changes in the corrosion behaviour
occurred after ageing. First, a well-marked plateau was observed in the cathodic domain corresponding to the oxygen reduction controlled by a diffusion process; the current densities measured on the plateau were very similar for all the aged samples but were higher than for the T3-reference sample. Only one breakdown potential, corresponding to the corrosion potential Ecorr, was observed for all samples: a distinct de-crease of Ecorr values occurred after ageing, in agreement with the evolution of the OCP curves previously observed (Fig. 4andTable 2). Finally, a sharp increase of the anodic current density at the breakdown potential was observed for all the samples, which denoted that all the samples were susceptible to corrosion at their corrosion potential. OM observations after exposure to the electrolyte at Ecorr(not shown here) showed pitting corrosion for the four samples; when the samples were polarised at more positive potentials, pits grew as shown inFig. 6.
The increased cathodic activity after ageing should have led to a shift of Ecorrvalues towards more positive values; actually, the shift observed in the opposite sense clearly showed an increase in the pitting susceptibility of the alloy after ageing (Fig. 5). Further, the increase in icorrvalues was evidence of a lower corrosion resistance of aged samples compared to T3-reference sample, as previously shown by Ghosh et al.
Fig. 1.a) OM observations of the T3-reference and 190-12 samples after electrochemical etching with a Flick reagent b) SEM observations of the IMCs present on the T3-reference and 190-12 samples. FEG-SEM observations of c) T3-reference sample, aged samples at 190 °C for d) 1 h (190-1), e) 12 h (190-12) and f) 72 h (190-72).
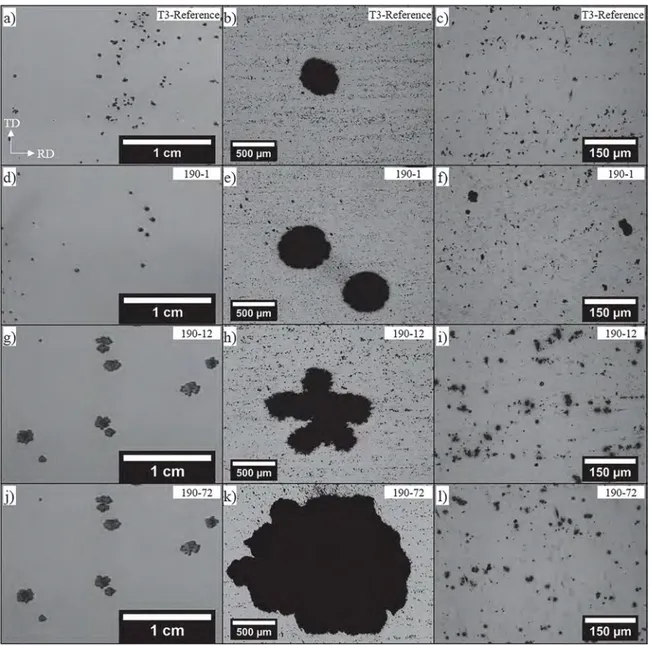
[48]. OM observations of the samples at the end of the polarisation tests (Fig. 6) showed two scales of pits for all samples. Millimetre scale pits (Fig. 6b, e, h, k) were observed with significantly larger pits for aged samples and particularly for sufficiently long ageing duration (> 1 h). Micrometre scale pits were also observed (Fig. 6c, f, i, l) with two po-pulations of pits, i.e. very small and numerous pits surrounding larger pits related to dissolution phenomena around IMCs, in particular S-phase IMCs, known as the most reactive IMCs in AA 2024 [24]. When the ageing duration increased, the surface area corresponding to the matrix dissolution around IMCs clearly increased (Fig. 6i and l). Therefore, the pitting resistance of AA 2024 was observed to be closely correlated to the evolution of microstructure incurred from ageing at 190 °C, in good agreement with previous results from Birbilis et al. [14,49]. The authors showed that there likely existed a critical
minimum width or size for precipitates in Al–Cu–Mg alloys above which second phase precipitates began to act as distinct electro-chemical entities. They evaluated this critical size to be around 8 nm. In the present study, the S’/S - hardening precipitates formed as early as after 1 h of ageing were likely to behave as larger S-phase IMCs, the corrosion behaviour of which having been largely described in the lit-erature [7,49,50]. They first constitute anodic sites where selective dissolution phenomena occur. These processes are associated with a Cu enrichment so that the S-phase IMCs become cathodic sites where oxygen reduction can occur [51]. This cathodic reaction is accom-panied with a pH increase which promotes the dissolution of the sur-rounding matrix and localised attack near the IMCs. Therefore, for the aged samples, both the large S-phase IMCs and S’/S hardening pre-cipitates acted, after dealloying, as local cathodes leading to an
Fig. 2.TEM observations of a) T3-reference sample, aged samples at 190 °C for b) 1 h (190-1) with a zoom on this image in c), d) 12 h (190-12) and e) 72 h (190-72). The black and white arrows show dispersoids.
Fig. 3.a) High resolution TEM (HRTEM) observation of an intragranular precipitate for 190-12 sample and b) its diffraction pattern. c) HRTEM observation of an intergranular precipitate for 190-12 sample, d) its diffraction pattern and e) schematic of the reciprocal space cut carried out under a crystallography software for both precipitates.
enhanced cathodic activity (Fig. 5). Consequently, they both could contribute to the pitting activity of AA 2024, explaining the increased susceptibility to pitting of the aged samples. Furthermore, the depletion in Cu of the matrix shifted its corrosion potential towards more nega-tive values (Fig. 4); this led to an increase of the galvanic coupling between large IMCs and the matrix, explaining the stronger dissolution phenomena associated with large S-phase IMCs for the aged samples (Fig. 6i and l). In parallel, the matrix became more reactive which contributed to explain the strong propagation of the pits for the aged
samples with large millimetre scale pits (Fig. 6h and k). The results could be related to those obtained by DeRose et al. who provided mi-croscale electrochemical data to explain the corrosion susceptibility of AA 2024 taking into account the influence of nanoscale dispersoids and microscale AlCuMnFeSi and S-phase particles [52]. Results from An-dreatta et al., who observed significant evolutions of the potential dif-ference between the IMCs and the matrix for different tempers of AA7075 by using local electrochemical techniques, e.g. micro-capillary cell, were also of great interest to explain the results [53].
The results thus showed that the evolution of the microstructure related to the ageing treatment significantly changed the corrosion behaviour of AA 2024. For aged samples, dissolution phenomena were observed both at the S’/S hardening precipitates scale and IMCs scale leading to an enhanced pitting susceptibility of the alloy. The question was now to evaluate the influence of the ageing treatment on the cor-rosion behaviour of AA 2024 in the pre-treatment baths.
3.2. Change in the chemical composition of the surface during pre-treatments – influence of the ageing treatment
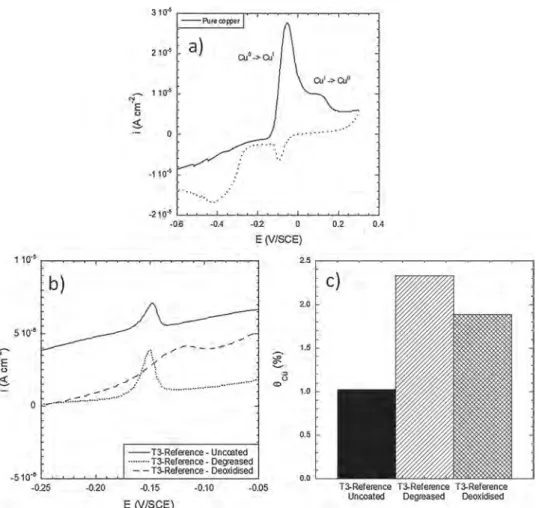
To monitor the reactivity of the AA 2024 samples in the pre-treat-ment baths, CV experipre-treat-ments were performed to access to the surface Cu coverage. The CV curve for pure Cu is shown inFig. 7a. Two oxidation peaks were identified as the oxidation of Cu (0) to Cu (I) for the first peak, and the oxidation of Cu (I) to Cu (II) for the second one. For the after part of this study, only the first peak was analysed because it was more intense than the second one allowing more confidence in the re-sults. Similar CV tests were then performed for the AA 2024 samples.
Fig. 7b shows the CV curves at the first peak for the T3-reference sample. The area under the peak was measured and the surface Cu coverage θCuwas determined by calculating the ratio given by Eq.(1) [24]:
= ×
θ (%) Area under Cu(0) to Cu(I) peak of studied samples Area under Cu(0) to Cu(I) peak of pure copper 100
Cu
(1) As shown by Scully and co-workers [24,25], the surface Cu coverage determined by this method could be attributed to both Cu-containing intermetallic particles and surface Cu deposited on the sample surface due to the dealloying of the Cu-rich intermetallics and subsequent Cu replating during the pre-treatments. The results for the T3-reference AA 2024 sample, before (sample referred as uncoated) and after the two pre-treatment steps, i.e. degreasing and deoxidation, are reported in
Fig. 7c. For the T3-reference sample before the pre-treatment, a surface Cu coverage of about 1% was measured and attributed to the response of mainly S-phase IMCs. Then,Fig. 7b showed that the Cu (0) to Cu (I) oxidation peak increased after degreasing. Considering the reactivity of the IMCs in the degreasing bath combined with Cu redeposition [54], it was assumed that the Cu (0) to Cu (I) oxidation peak was related to the contribution of both IMCs and Cu replating [26,49,55]. Finally the surface Cu coverage decreased after deoxidation but remained sig-nificant. SEM observations of the degreased and deoxidised sample (not shown here) showed that IMCs were, for the most part, removed after the two steps of pre-treatment [54]. The results obtained here with pretreatments performed using commercial products could be com-pared to those obtained with more basic reference solutions, e.g. so-dium hydroxide, nitric acid and hydrofluoric acid, that showed that the second phase particles were removed after those pretreatments [56,57]. Further, authors showed that, after pretreatments using different basic reference solutions, residual Cu left on the surface was detected [57,58]. Clearly, depending on the pretreatment parameters, differ-ences could be observed on the surface after pretreatment and on the subsequent properties of the layers formed as shown by Terryn et al. [59,60]. Nevertheless, results obtained in this study were well-corre-lated with literature data. Therefore, after deoxidation, the significant surface Cu coverage value measured was attributed mainly to Cu
Fig. 4.Open Circuit Potential measurements for T3-reference, 190-1, 190-12 and 190-72 samples in 10−1M Na
2SO4+ 10−3M NaCl.
Table 2
Ecorr values for T3-reference, 190-1, 190-12 and 190-72 samples in 10−1M
Na2SO4+ 10−3M NaCl. OCP measurements were performed for 90 min and
Ecorr values were calculated from the OCP values recorded during the last
30 min.
Samples T3-Reference 190-1 190-12 190-72 Ecorr(V/SCE) −0.507 −0.589 −0.616 −0.622
Fig. 5.Polarisation curves for T3-reference, 190-1, 190-12 and 190-72 samples in 10−1M Na
replating, showing clearly that the Cu deposits had been only partially removed during this step [26]. The contribution of Al-Cu-Mn-Fe should be also accounted for as the exposure to the pre-treatment baths could have modified their reactivity as shown by Verdalet [54].
Similar CV tests were performed for the aged AA 2024 samples after each pre-treatment step; the results are shown inFig. 8a. Globally, all the samples had the same behaviour characterised by an increase of the surface Cu coverage θCuafter degreasing and a decrease of θCuafter deoxidation. As seen previously, the surface Cu coverage for uncoated samples is mainly related to Cu-rich precipitates. Considering that, during the ageing treatment, Cu-rich hardening precipitates formed and Cu-rich intergranular precipitates grew, a stronger surface Cu coverage would have been expected for aged samples, in particular 190-12 and 190-72 samples which are characterised by significant microstructural changes, compared to the T3-reference samples, in agreement with previous electrochemical results (Figs. 5 and 6) and Birbilis’ work [14,49]. The low surface Cu coverage measured for the aged samples before the pre-treatment could be explained by the oxide film formed on the samples during the ageing treatment: indeed, to take all the effects of the ageing treatment on the TCP into consideration, the samples were polished before the ageing treatment and not after. It was
thus assumed that an air-formed oxide film covered the Cu-rich pre-cipitates and masked them during CV experiments. The strong surface Cu coverage after degreasing for the aged samples showed that the oxide film was dissolved during exposure to the degreasing bath. Fur-ther, the surface Cu coverage was similar for the T3-reference sample and 190-1 sample while stronger surface Cu coverage was measured for both 190-12 and 190-72 samples. Considering the changes in the mi-crostructure due to the ageing treatment (Figs. 2 and 3), it was assumed that both coarse IMCs but also finer Cu-rich precipitates dealloyed during the degreasing step in agreement with Birbilis’ work [14,49] leading to an increased Cu replating for 190-12 and 190-72 samples. Moreover, considering that the Cu content of the matrix surrounding the S-phase IMCs was lower for aged samples, galvanic coupling be-tween the IMCs and the surrounding matrix was increased, as shown by the corrosion features after corrosion tests (Fig. 6), leading to a higher contribution of these IMCs to the surface Cu coverage. During CV ex-periments, the surface Cu coverage values probably included both the contribution of all the Cu-rich precipitates remaining on the surface and that of the Cu deposits. As shown before for the T3-reference sample, the deoxidation step led to a partial removal of the Cu deposits shown by the strong decrease of the surface Cu coverage for all samples.
Fig. 6.OM observations of the sample surface at the end of the polarisation tests performed in 10−1M Na
2SO4+ 10−3M NaCl for a), b), c) T3-reference, d), e), f)
However, due to the higher Cu amount covering the surface of 190-12 and 190-72 samples after degreasing, the residual surface Cu coverage after deoxidation was stronger for these samples than for the T3-re-ference and 190-1 samples (Fig. 8a and b). There was no doubt that, due to the significant Cu-rich precipitation for both 190-12 and 190-72 samples, the contribution of Cu-rich precipitates to the surface Cu coverage was likely to be non-negligible even after the whole pre-treatment, in agreement with Davenport [26]. Anyhow, results clearly showed that the reactivity of the samples in the pre-treatment baths was
closely related to the underlying microstructure so that, after the pre-treatment, stronger surface Cu coverage was measured for the 190-12 and 190-72 samples which could impact the growth of the TCP coatings and their protective properties. XPS analyses (results not shown here) did not show any other changes in the chemical composition of the surface, for example the presence of Fe-deposits, even if some authors showed that, by using Fe-containing deoxidisers, Fe-deposits could form [61].
Fig. 7.Cyclic voltammetry curves for a) pure Cu and b) T3-reference AA 2024 sample before (uncoated) and after each step of the pre-treatments. c) Surface Cu coverage calculated from CV curves for T3-reference AA 2024 sample before and after each step of the pre-treatments.
Fig. 8.a) Surface Cu coverage measured by CV tests after each step of the pre-treatments for the T3-reference and the aged AA 2024 samples. b) Surface Cu coverage measured after deoxidation as a function of the ageing duration at 190 °C.
3.3. Kinetics of growth and thickness of the TCP coatings. Corrosion behaviour of coated materials
3.3.1. Kinetics of growth and thickness of the TCP coatings
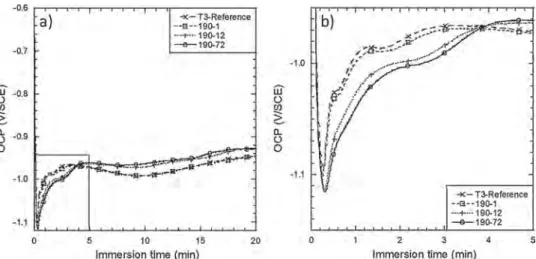
Fig. 9shows the OCP versus immersion time in the TCS conversion solution for the T3-reference and aged samples. For all samples, the OCP first rapidly decreased to reach a minimum value which could be attributed to the thinning of the air-formed oxide film on the alloy surface due to fluoride ions as suggested by Qi et al. [62]. This phe-nomenon led to the dissolution of aluminium. The subsequent shift of the electrode potential to the negative direction allowed protons and oxygen reduction to occur so that the pH locally increased. The che-mical conditions were then favourable to the deposition of the con-version layer on the alloy surface [21]. Therefore, after having reached a minimum value, the OCP gradually increased to become relatively stable for a complete coverage of the alloy surface by the TCP coating. The OCP plateau was attributed to additional precipitation of hydrated zirconia film and chromium oxide so that the thickness of the conver-sion layer increased [63]. Fig. 9b clearly showed that two types of behaviour could be distinguished. OCP curves for the T3-reference and 190-1 samples were nearly superimposed and differed from those plotted for 190-12 and 190-72 samples, the two last curves being also quite similar. The potential at the peak was less negative and the po-tential plateau more rapidly reached for T3-reference and 190-1 sam-ples than for 190-12 and 190-72 samsam-ples. The results thus suggested either a faster growth kinetics of the TCP coating or the growth of a thinner and/or less defective TCP coating for T3-reference and 190-1 samples than for samples aged for longer times. Again, this could be related to the significant changes in the microstructure due to sufficient ageing time associated with a surface Cu coverage stronger for 190-12 and 190-72 samples compared to both T3-reference and 190-1 samples (Fig. 8). Literature data showed that Cu deposits constitute cathodic sites associated with local changes in pH due to the occurrence of cathodic reactions [62,64]. Therefore, before they are covered by the coating, Cu deposits could significantly affect the coating growth, i.e. the first step of the TCP coating growth could be dependent on the surface Cu coverage. FEG-SEM observations (Fig. 10) of the TCP coat-ings after the whole conversion process (TCS + PACS baths) showed that the thickness of the coatings significantly increased when the ageing treatment was longer from a thickness equal to 127 nm to 256 nm for the T3-reference and 190-72 samples respectively. Ellipso-metry results (not shown here) confirmed that the TCP coatings formed on 190-12 and 190-72 samples were thicker than those formed on the other samples. The results obtained in this study were in agreement with those of Verdalet et al. who showed that the thickness of the TCP
coatings grown on different samples of AA 2024 T3 increased when the surface Cu coverage after the pre-treatments increased [54]. The time required for the OCP to reach the plateau value for 190-12 and 190-72 samples (Fig. 9) suggested that, although it was thicker, the TCP coatings grown on these samples were more defective as suggested by the FEG-SEM images (Fig. 10). Moreover, FEG-SEM images also showed that the TCP coatings formed on the long-aged samples seemed to be less adherent than those formed on the T3-reference and 190-1 samples. This should be related to the Cu-enriched layer observed at the alloy/ TCP coating interface which was more and more visible when the ageing duration increased (Fig. 10d and e). Even if the FEG-SEM images suggested that the surface Cu was in the form of an enriched layer, its presence in the form of a smut could not be excluded [57].
3.3.2. Protective properties of the TCP coatings
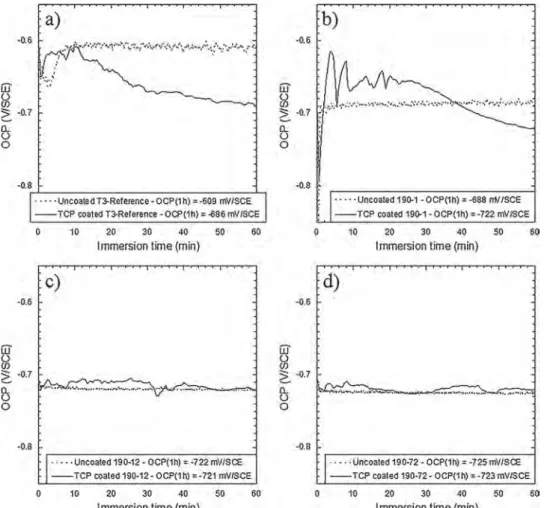
Fig. 11shows OCP measurements in 0.5 M NaCl solution performed for 1 h for the four samples after the whole conversion process, i.e. the coating growth in the TCS conversion bath followed by the post-treat-ment in the PACS solution. For all samples, OCP measurepost-treat-ments per-formed for the uncoated samples are given for comparison. First, comparison ofFigs. 4 and 11for uncoated samples showed a shift of the OCPs towards more negative values when the measurements were performed in chloride solution compared to chloride-containing sul-phate solution, in relation with the aggressivity of the electrolyte. Then, for both the T3-reference and 190-1 samples (Fig. 11a and b), the more negative OCP measured for the coated samples compared to the un-coated samples in chloride solutions could be explained by the blocking of the oxygen reduction by the TCP coatings [21]. On the contrary, the results suggested that no significant change in the kinetics of the oxygen reduction occurred for the 190-12 and 190-72 samples after the TCP coating growth (Fig. 11c and d), so that the TCP coatings for these samples provided a less efficient protection against corrosion.
To go further in the analysis of the protective properties of the TCP coatings, all coated samples were immersed from 0 to 21 days in 0.5 M NaCl and their corrosion behaviour was analysed by EIS. To ensure the reproducibility of the results, EIS experiments were repeated a large number of times for some samples.Fig. 12shows representative results of such an analysis for the T3-reference samples after 7 days of im-mersion in 0.5 M NaCl solution. A good reproducibility of the results was clearly observed. Therefore, for all measurements, the EIS mea-surements were repeated three times. In the following, only re-presentative spectra are shown for more clarity in the figures but error bars are given for experimental data extracted from the EIS spectra.
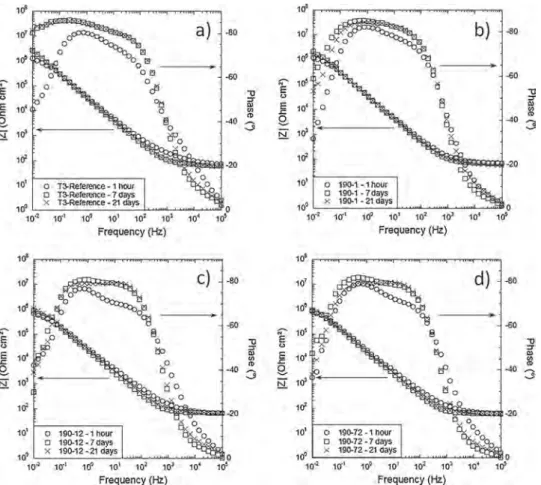
Fig. 13shows representative EIS spectra for immersion times of 1 h, 7 days and 21 days for the four coated samples. All Bode curves showed
Fig. 9.OCP versus immersion time in the TCS conversion solution for T3-reference, 190-1, 190-12 and 190-72 samples. (a) global view and (b) focus on the first stages of the TCP coating growth.
the same trend and two time constants were distinguished on all im-pedance spectra regardless the sample or the duration of immersion. The time constant in the [102
–103] Hz frequency domain was re-presentative of the anti-corrosion properties of the coating while the second time constant in the [10−1
–10°] Hz frequency range was
associated with the electrochemical processes occurring at the coating/ alloy interface [65–67].
First, visual inspection of the impedance diagrams showed an ex-tension of the measured frequency range of high phase angles for the T3-reference sample (Fig. 13a) when the immersion time increased
Fig. 10.FEG-SEM images of TCP coatings formed on AA 2024 samples. a) description of the images; images for b) T3-reference, c) 190-1, d) 190-12 and e) 190-72 samples. The TCP coatings are observed after the whole conversion process (TCS + PACS baths). The scale given is adequate for horizontal dimensions. For the vertical direction, the dimensions are to be corrected with a factor equal to cos 38 because the samples were tilted with a 52° angle for a better observation.
Fig. 11.OCP versus immersion time in 0.5 M NaCl solution for both uncoated and coated (TCS + PACS exposure) T3-Reference a), 190-1 b), 190-12 c) and 190-72 d) samples.
from 1 h to 7 days without no further evolution for longer immersion times. The same trend was observed for the 190-1 sample even if it was less marked (Fig. 13b) while no evolution was observed for the 190-12 and 190-72 samples (Fig. 13c and d). Moreover, globally the measured frequency range of high phase angles was narrower for 12 and 190-72 samples compared to the T3-reference and 190-1 samples. In their study about trivalent chromium conversion coating process, Qi et al. proposed that the decrease of the frequency range of the phase angle peak suggested reduced corrosion protection of the coating [68]. This hypothesis would suggest that the TCP coatings grown on 190-12 and 190-72 samples might have lower protective properties than those
grown on T3-reference and 190-1 samples which would be in agree-ment with previous OCP measureagree-ments. The presence of more and/or larger defects in the TCP coatings grown on the 190-12 and 190-72 samples was assumed to favour the penetration of the electrolyte ex-plaining their low protective properties [68].
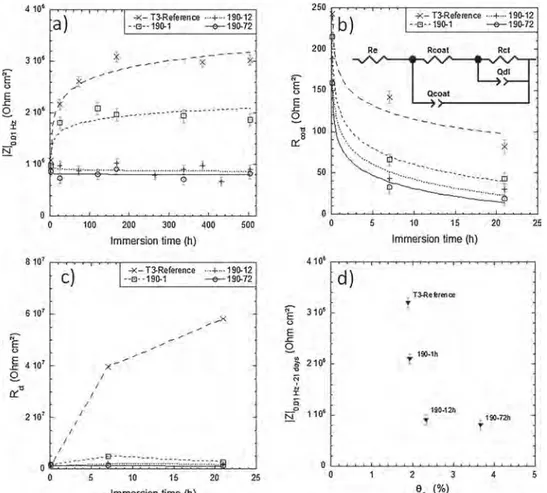
Then, attention was paid to the values of the impedance at 10−2Hz, |Z|0.01 Hz that represented the global resistance of the conversion system.Fig. 13showed that, for the T3-reference and 190-1 samples, |Z|0.01 Hzvalues slightly increased in the first immersion times and then stabilised while for 190-12 and 190-72 samples, the variations were less significant. In order to show a more accurate representation of these
Fig. 12.Bode impedance-frequency plots for T3-reference samples for 7 days of immersion in 0.5 M NaCl. Twelve EIS diagrams were plotted to ensure the re-producibility of the results.
Fig. 13.Bode impedance-frequency plots for a) T3-reference, b) 190-1, c) 190-12 and d) 190-72 samples for three immersion durations (1 h, 7 days and 21 days) in 0.5 M NaCl.
changes in the |Z|0.01 Hzvalues, mean values were calculated for each sample and each immersion duration.Fig. 14a shows mean values of |Z|0.01 Hzas a function of immersion duration in 0.5 M NaCl solution for the four coated samples. In the very early stage of immersion, |Z|0.01 Hz values were similar for the four samples, but their evolution as a function of the immersion time in NaCl solution was very different for the T3-reference and 190-1 samples compared to 190-12 and 190-72 samples. For the T3-reference and 190-1 samples, |Z|0.01 Hzsignificantly increased in the first immersion times to reach a maximal value at 7 and 5 days of immersion respectively and then slightly decreased, with |Z|0.01 Hzvalues lower for the 190-1 sample. On the contrary, no sig-nificant evolution of |Z|0.01 Hzwas noted for the 190-12 and 190-72 samples. The |Z|0.01 Hz value reached after 21 days of immersion for these two samples was similar to the baseline and therefore was lower than that of 190-1 and T3-reference samples. As already shown by other authors [68], the impedance modulus values are really helpful to quantify the corrosion protection of the coatings: coatings with a low amount of defects or with a good adhesion on the metal present better corrosion properties associated with high impedance modulus. The results thus showed a lower protective properties of the TCP coatings grown on both 190-12 and 190-72 samples compared to both T3-re-ference and 190-1 samples, in agreement with previous conclusions drawn from the analyses of the frequency range where high phase an-gles appeared and OCP measurements. The evolution of the impedance diagrams during the 7 and 5 first days for the T3-reference and 190-1 samples respectively could be related to a self-healing mechanism that could be helpful in repairing the defects of the TCP coatings while this could not occur for the 190-12 and 190-72 samples probably due to a more defective and less adherent coating as suggested by the growth kinetics (Fig. 9) and FEG-SEM images (Fig. 10).
To strengthen the analysis of EIS spectra, the resistance of the TCP coatings was quantified by fitting the respective spectra with the
equivalent circuit proposed by Qi et al. (Fig. 14b) [69]. This circuit includes the electrolyte resistance (Re). It is based on the identification of two time constants as suggested by the visual inspection of the EIS diagrams: one time constant corresponds to the electrochemical pro-cesses that occur at the coating/alloy interface and is represented by a parallel combination of the charge transfer resistance Rctand a constant phase element Qdl, and a second time constant is related to the con-version coating and is represented by the coating resistance Rcoat as-sociated with another constant phase element Qcoat. Fig. 14b and c show the mean Rcoatand Rctvalues extracted from the EIS spectra by using this equivalent circuit as a function of the immersion duration for the four coated samples. Results showed that Rcoatvalues were sig-nificantly lower than Rctvalues for all samples and all duration times. This suggested that the inner layer contributed for the major part to the protective properties of the coatings [69]. Further, it could be assumed that the TCP coatings contained pores and cracks allowing access of the electrolyte to the alloy. Nevertheless, results clearly showed also that both Rcoatand Rctvalues were significantly higher for the T3-reference compared to the aged samples; the values obtained for the 190-1 sample were higher than those for 190-12 and 190-72 samples but the negative effect of the ageing treatment on the protective properties of the TCP coatings was clearly shown even for ageing time as short as 1 h. It was also of interest to note that, independent of the immersion duration, there was a clear relationship between the Rcoatvalues and the ageing duration with a decrease of the Rcoatvalues when the ageing duration increased from 0 to 72 h (Table 3). The values of the constant phase element (CPE) parameters (Table 3) confirmed the results. The decrease of ncoatcombined with the increase of Qcoatvalues when the ageing duration increased suggested an increase of the heterogeneity of the coatings for long aged samples.
Therefore, considering previous results of this study, it appeared clearly that the protective properties of the TCP coatings were
Fig. 14.Impedance results for T3-reference, 190-1, 190-12 and 190-72 samples in 0.5 M NaCl. Mean values of a) the impedance mod-ulus at 10−2Hz, b) R
coatand c) Rctas a
func-tion of the immersion durafunc-tion. The equivalent electrical circuit used for the fitting of the EIS spectra and calculations of Rcoatand Rctvalues
is represented in b). d) impedance modulus at 10−2Hz measured after 21 days of immersion
(values calculated from the trend curves plotted in a)) as a function of surface Cu cov-erage measured after deoxidation.
significantly influenced by the microstructure of the alloy. This was evidenced inFig. 14d where mean |Z|0.01 Hzvalues, measured after 21 days of immersion for the four coated samples corresponding to various ageing treatment durations, were plotted as a function of the surface Cu coverage measured after deoxidation. First, the strong decrease of |Z|0.01 Hzvalues for ageing time as short as 1 h until 12 h and followed by a stabilisation for longer ageing treatments confirmed the con-tribution of the Cu-rich hardening precipitates and other micro-structural evolutions (e.g. Cu-impoverishment around S-phase IMCs) in the growth mechanism of the TCP coatings and their subsequent pro-tective properties. Further, |Z|0.01 Hzvalues could be directly related to the surface Cu coverage measured after deoxidation. As previously shown (Fig. 8b), the surface Cu coverage increased with the ageing treatment duration.Fig. 14d showed a decrease in the global resistance of the TCP coatings when the surface Cu coverage after deoxidation increased with a stabilisation for a critical surface Cu coverage. Such a result was not consistent with the work of Qi et al. [62] who showed that more protective coatings grew on surfaces covered by copper-rich sponges after the pre-treatment step. However, Viroulaud et al. [70] showed that the protective properties of the TCP coatings could not be directly linked to the surface Cu coverage. They showed that, de-pending on this last parameter, the kinetics of coating growth could be different leading to changes in the coating thickness. For these authors, with a fast kinetics of coating growth, thicker TCP coatings were ob-served but they were characterised by a heterogeneous structure and were more susceptible to cracking. The present study showed that the microstructural evolution due to ageing led to significant differences in the surface Cu coverage (Fig. 8); increased surface Cu coverage was evidenced for samples aged for long duration due to both the con-tribution of fine Cu-rich precipitation and an enhanced dealloying of S-phase IMCs. These changes were directly linked to variations in the growth kinetics of the TCP coatings (Fig. 9) because Cu deposits pro-moted the precipitation of chromium- and zirconium-rich layer so that thicker TCP coatings grew on long-aged samples (Figs. 9 and 10). Such a result was in agreement with Qi et al. who showed that the conversion layer developed on the Cu-rich particles of a 2024 T351 Al alloy was thicker than the one developed on the matrix [20,68]. However, the growth kinetics observed in the present study suggested that the TCP coatings formed on 190-12 and 190-72 samples were more defective than for T3-reference and 190-1 samples (Fig. 9) in agreement with Viroulaud et al. [70]. Both OCP (Fig. 11) and impedance data (Figs. 13 and 14) confirmed the results showing less protective TCP coatings for long-aged samples. This was in agreement with the results of Li et al. [65] who studied the formation of a trivalent chromium conversion layer for different Al alloys, i.e. a 6061 Al alloy (0.15 to 0.4 wt.% Cu), a 7075 Al alloy (1.2–2 wt.% Cu) and finally the 2024 Al alloy with a higher Cu content. They observed that the protective properties of the
TCP coatings decreased when the Cu content of the alloy increased and they attributed the low corrosion resistance of the coated 2024 Al alloy to heterogeneities in the conversion layer.
4. Conclusions
The present work clearly showed the influence of the microstructure on the protective properties of a TCP coating for the 2024 Al alloy. The main results are the following.
1 Nanometer scale Cu-rich precipitates formed during an ageing treatment behaved as distinct electrochemical entities and con-tributed significantly to the surface Cu coverage of the deoxidised alloy. The dealloying of S-phase IMCs was increased for aged sam-ples leading to a stronger contribution of these IMCs to surface Cu coverage. Consequently, the surface Cu coverage was increased for long-aged samples.
2 The growth mechanisms and kinetics of TCP coatings are directly related to the surface Cu coverage: thicker but more defective TCP coatings formed on aged samples due to the stronger surface Cu coverage.
3 TCP coatings formed on aged samples with a strong surface Cu coverage had low protective properties.
Data availability
The raw/processed data required to reproduce these findings cannot be shared at this time as the data also forms part of an ongoing study. Acknowledgments
This work was performed in the framework of the NEPAL FUI project. CIRIMAT was financially supported by the French Ministry of Economy and industry (BPI-France), the Région Occitanie/ Pyrénées–Méditerranée and the European Union (FEDER/ERDF). The authors thank Xavier Verdalet-Guardiola (Mecaprotec-CIRIMAT) and Herman Terryn (Vrije Universiteit Brussel) for fruitful discussions. References
[1] R.J. Hussey, J. Wilson, Light Alloys: Directory and Databook, Springer, US, 2013. [2] V. Guillaumin, G. Mankowski, Localized corrosion of 2024 T351 aluminium alloy in
chloride media, Corros. Sci. 41 (1998) 421–438.
[3] X. Zhou, C. Luo, T. Hashimoto, A.E. Hughes, G.E. Thompson, Study of localized corrosion in AA 2024 aluminium alloy using electron tomography, Corros. Sci. 58 (2012) 299–306.
[4] A. Boag, A.E. Hughes, A.M. Glenn, T.H. Muster, D. McCulloch, Corrosion of AA 2024-T3 part I: localised corrosion of isolated IM particles, Corros. Sci. 53 (2011) 17–26.
Table 3
Parameters extracted from EIS spectra for the different coated samples after 1 h, 7 days and 21 days of immersion in 0.5 M NaCl. The equivalent circuit used is presented inFig. 14b.
Sample Immersion time Re(Ohm
cm²) ± 5 Rcoat(Ohm cm²) ± 7 Rct(Ohm cm²) ± 1 104 Qdlsn/(Ohm cm²) ± 2 10−7 ndl± 0.01 Qcoatsn/(Ohm cm²) ± 2 10−7 ncoat± 0.01 Reference 1 h 70 243 1.20 106 2.6 10−6 0.94 2.6 10−6 0.88 7 days 78 142 39.60 106 2.5 10−6 0.93 2.3 10−6 0.94 21 days 60 82 58.30 106 2.8 10−6 0.93 1.9 10−6 0.94 190-1 1 h 68 215 1.56 106 1.6 10−6 0.94 3.7 10−6 0.87 7 days 57 66 4.79 106 2.4 10−6 0.93 3.4 10−6 0.93 21 days 60 43 2.64 106 3.6 10−6 0.92 2.0 10−6 0.93 190-12 1 h 67 188 1.44 106 3.8 10−6 0.83 3.0 10−6 0.86 7 days 65 43 1.94 106 3.6 10−6 0.90 4.1 10−6 0.92 21 days 61 30 1.54 106 6.3 10−6 0.89 2.9 10−6 0.92 190-72 1 h 69 159 1.27 106 3.4 10−6 0.88 4.9 10−6 0.83 7 days 61 33 1.39 106 3.0 10−6 0.93 5.8 10−6 0.91 21 days 59 19 1.16 106 5.5 10−6 0.90 3.3 10−6 0.91
[38]Y.C. Lin, Y.C. Xia, Y.Q. Jiang, H.M. Zhou, L.T. Li, Precipitation hardening of 2024-T3 aluminum alloy during creep aging, Mater. Sci. Eng.: A 565 (2013) 420–429. [39]S.C. Wang, M.J. Starink, N. Gao, Precipitation hardening in Al–Cu–Mg alloys
re-visited, Scripta Mater. 54 (2006) 287–291.
[40]H. Perlitz, A. Westgren, Arkiv Kemi Min. Geol. B16 (1943) 13–22.
[41]S.C. Wang, M.J. Starink, Two types of S phase precipitates in Al–Cu–Mg alloys, Acta Mater. 55 (2007) 933–941.
[42]E.A. Starke, J.T. Staley, Application of modern aluminum alloys to aircraft, Prog. Aerosp. Sci. 32 (1996) 131–172.
[43]B. Heying, R.D. Hoffmann, R. Pöttgen, Structure refinement of the S-phase pre-cipitate MgCuAl2, Zeitschrift für Naturforschung B60 (2005) 491–494. [44]J. Zhang, Y.N. Huang, C. Mao, P. Peng, Structural, elastic and electronic properties
of θ (Al2Cu) and S (Al2CuMg) strengthening precipitates in Al–Cu–Mg series alloys: first-principles calculations, Solid State Commun. 152 (2012) 2100–2104. [45]Z. Wang, P. Chen, H. Li, B. Fang, R. Song, Z. Zheng, The intergranular corrosion
susceptibility of 2024 Al alloy during re–ageing after solution treating and col-d–rolling, Corros. Sci. 114 (2017) 156–168.
[46]E.H. Hollingsworth, H.Y. Hunsicker, Metals Handbook, American Society for Metals, Metals Park, OH, 1987 pp. 583–609.
[47]Y. Kim, R.G. Buchheit, A characterization of the inhibiting effect of Cu on me-tastable pitting in dilute Al–Cu solid solution alloys, Electrochim. Acta 52 (2007) 2437–2446.
[48]K.S. Ghosh, Md. Hilal, S. Bose, Corrosion behavior of 2024 Al-Cu-Mg alloy of var-ious tempers, Trans. Nonferrous Met. Soc. China 23 (2013) 3215–3227. [49]N. Birbilis, M.K. Cavanaugh, L. Kovarik, R.G. Buchheit, Nano-scale dissolution
phenomena in Al–Cu–Mg alloys, Electrochem. Commun. 10 (2008) 32–37. [50]M.B. Vukmirovic, N. Dimitrov, K. Sieradzki, Dealloying and corrosion of Al alloy
202-T3, J. Electrochem. Soc. 149 (2002) B428–B439.
[51]R.G. Buchheit, M.A. Martinez, L.P. Montes, Evidence for Cu ion formation by dis-solution and dealloying the Al2CuMg intermetallic compound in rotating ring-disk collection experiments, J. Electrochem. Soc. 147 (2000) 119–124.
[52]J.A. DeRose, T. Suter, A. Balkowiec, J. Michalski, K.J. Kurzydlowski, P. Schmutz, Localised corrosion initiation and microstructural characterisation of an Al 2024 alloy with a higher Cu to Mg ratio, Corros. Sci. 55 (2012) 313–325.
[53]F. Andreatta, H. Terryn, J.H. W de Wit, Corrosion behaviour of different tempers of AA7075 aluminium alloy, Electrochim. Acta 49 (2004) 2851–2862.
[54]X. Verdalet-Guardiola, J.-P. Bonino, S. Duluard, B. Fori, C. Blanc, Influence of the alloy microstructure and surface state on the protective properties of trivalent chromium coatings grown on a 2024 aluminium alloy, Surf. Coat. Technol. 344 (2018) 276–287.
[55]T. Hashimoto, X. Zhang, X. Zhou, P. Skeldon, S.J. Haigh, G.E. Thompson, Investigation of dealloying of S phase (Al 2 CuMg) in AA 2024-T3 aluminium alloy using high resolution 2D and 3D electron imaging, Corros. Sci. 103 (2016) 157–164.
[56]Z. Feng, Y. Liu, T. Hashimoto, G.E. Thompson, X. Zhou, P. Skeldon, Influence of surface pretreatments on the corrosion protection of sol-gel coated AA2024-T3 aluminium alloy, Surf. Interface Anal. 45 (2013) 1452–1456.
[57]K.J.H. Nelson, A.E. Hughes, R.J. Taylor, B.R.W. Hinton, L. Wilson, M. Henderson, Characterisation of aluminium alloys after HNO3/HF-NaOH-HNO3/HF pretreat-ment, Mater. Sci. Technol. 17 (2001) 1211–1221.
[58]A.E. Hughes, G. Theodossiou, S. Elliott, T.G. Harvey, P.R. Miller, J.D. Gorman, P.J.K. Paterson, Study of deoxidation of 2024-T3 with various acids, Mater. Sci. Technol. 17 (2001) 1642–1652.
[59]G. Goeminne, H. Terryn, J. Vereecken, EIS study of the influence of aluminium etching on the growth of chromium phosphate conversion layers, Electrochim. Acta 43 (1998) 1829–1838.
[60]Ö. Özkanat, F.M. de Wit, J.H.W. de Wit, H. Terryn, J.M.C. Mol, Influence of pre-treatments and aging on the adhesion performance of epoxy-coated aluminium, Surf. Coat. Technol. 215 (2013) 260–265.
[61]A.E. Hughes, T.G. Harvey, T. Nikpour, T.H. Muster, S.G. Hardin, Non-chromate deoxidation of AA2024-T3 using Fe(III)-HF-HNO3, Surf. Interface Anal. 36 (2004) 15–23.
[62]J. Qi, A. Němcová, J.R. Walton, X. Zhou, P. Skeldon, G.E. Thompson, Influence of pre- and post-treatments on formation of a trivalent chromium conversion coating on AA 2024 alloy, Thin Solid Films 616 (2016) 270–278.
[63]F. Andreatta, A. Turco, I. de Graeve, H. Terryn, J.H.W. de Wit, L. Fedrizzi, SKPFM and SEM study of the deposition mechanism of Zr/Ti based pre-treatment on AA6016 aluminum alloy, Surf. Coat. Technol. 201 (2007) 7668–7685. [64]J. Cerezo, I. Vandendael, R. Posner, K. Lill, J.H.W. de Wit, J.M.C. Mol, H. Terryn,
Initiation and growth of modified Zr-based conversion coatings on multi-metal surfaces, Surf. Coat. Technol. 236 (2013) 284–289.
[65]L. Li, K.P. Doran, G.M. Swain, Electrochemical characterization of trivalent chro-mium process (TCP) coatings on aluminum alloys 6061 and 7075, J. Electrochem. Soc. 160 (2013) C396–C401.
[66]L. Li, A.L. Desouza, G.M. Swain, Effect of deoxidation pretreatment on the corrosion inhibition provided by a trivalent chromium process (TCP) conversion coating on AA 2024-T3, J. Electrochem. Soc. 161 (2014) C246–C253.
[67]Y. Guo, G.S. Frankel, Active corrosion inhibition of AA 2024-T3 by trivalent chrome process treatment, corrosion, J. Sci. Eng. 68 (2012) 045002-045001-045002-045010.
[68]J. Qi, L. Gao, Y. Li, Z. Wang, G.E. Thompson, P. Skeldon, An optimized trivalent chromium conversion coating process for AA 2024-T351 alloy, J. Electrochem. Soc. 164 (2017) C390–C395.
[69]J.-T. Qi, T. Hashimoto, J.R. Walton, X. Zhou, P. Skeldon, G.E. Thompson, Trivalent chromium conversion coating formation on aluminium, Surf. Coat. Technol. 280 (2015) 317–329.
[70]R. Viroulaud, J. Swiatowska, A. Seyeux, S. Zanna, J. Tardelli, Ph. Marcus, Influence of surface pretreatments on the quality of trivalent chromium process coatings on aluminum alloy, Appl. Surf. Sci. 423 (2017) 927–938.
[5] R. Grilli, M.A. Baker, J.E. Castle, B. Dunn, J.F. Watts, Localized corrosion of a 2219 aluminium alloy exposed to a 3.5% NaCl solution, Corros. Sci. 52 (2010) 2855–2866.
[6] K. Mutombo, Intermetallic particles-induced pitting corrosion in 6061-T651 alu-minium alloy, Materials Science Forum, Trans. Tech. Publ., 2011, pp. 389–392. [7] R.G. Buchheit, R.P. Grant, P.F. Hlava, B. McKenzie, G.L. Zender, Local dissolution
phenomena associated with S phase (Al2CuMg) particles in aluminum alloy 2024-T3, J. Electrochem. Soc. 144 (1997) 2621–2628.
[8] M. Gao, C.R. Feng, R.P. Wei, An analytical electron microscopy study of constituent particles in commercial 7075-T6 and 2024-T3 alloys, Metall. Mater. Trans. A 29 (1998) 1145–1151.
[9] R.P. Wei, C.M. Liao, M. Gao, A transmission electron microscopy study of con-stituent-particle-induced corrosion in 7075-T6 and 2024-T3 aluminum alloys, Metall. Mater. Trans. A 29 (1998) 1153–1160.
[10] A. Boag, A.E. Hughes, N.C. Wilson, A. Torpy, C.M. MacRae, A.M. Glenn, T.H. Muster, How complex is the microstructure of AA 2024-T3? Corros. Sci. 51 (2009) 1565–1568.
[11] G.M. Brown, K. Kobayashi, Nucleation and growth of a chromate conversion coating on aluminum alloy AA 2024-T3, J. Electrochem. Soc. 148 (2001) B457–B466.
[12] N. Birbilis, R.G. Buchheit, Electrochemical characteristics of intermetallic phases in aluminum alloys: an experimental survey and discussion, J. Electrochem. Soc. 152 (2005) B140–B151.
[13] C. Blanc, B. Lavelle, G. Mankowski, The role of precipitates enriched with copper on the susceptibility to pitting corrosion of the 2024 aluminium alloy, Corros. Sci. 39 (1997) 495–510.
[14] K.D. Ralston, N. Birbilis, M.K. Cavanaugh, M. Weyland, B.C. Muddle,
R.K.W. Marceau, Role of nanostructure in pitting of Al–Cu–Mg alloys, Electrochim. Acta 55 (2010) 7834–7842.
[15] M. Kendig, S. Jeanjaquet, R. Addison, J. Waldrop, Role of hexavalent chromium in the inhibition of corrosion of aluminum alloys, Surf. Coat. Technol. 140 (2001) 58–66.
[16] L. Xia, R.L. McCreery, Chemistry of a chromate conversion coating on aluminum alloy AA 2024‐T3 probed by vibrational spectroscopy, J. Electrochem. Soc. 145 (1998) 3083–3089.
[17] J. Zhao, G. Frankel, R.L. McCreery, Corrosion protection of untreated AA‐2024‐T3 in chloride solution by a chromate conversion coating monitored with Raman spectroscopy, J. Electrochem. Soc. 145 (1998) 2258–2264.
[18] E. Eichinger, J. Osborne, T. Van Cleave, Hexavalent chromium elimination: an aerospace industry progress report, Met. Finish. 95 (1997) 36–41.
[19] S. Merenyi, REACH: Regulation (EC) No 1907/2006: Consolidated Version (June 2012) With an Introduction and Future Prospects Regarding the Area of Chemicals Legislation, GRIN Verlag, 2012.
[20] J. Qi, T. Hashimoto, J. Walton, X. Zhou, P. Skeldon, G.E. Thompson, Formation of a trivalent chromium conversion coating on AA 2024-T351 alloy, J. Electrochem. Soc. 163 (2016) C25–C35.
[21] Y. Guo, G.S. Frankel, Characterization of trivalent chromium process coating on AA 2024-T3, Surf. Coat. Technol. 206 (2012) 3895–3902.
[22] L. Li, A.L. Desouza, G.M. Swain, In situ pH measurement during the formation of conversion coatings on an aluminum alloy (AA 2024), Analyst 138 (2013) 4398– 4402.
[23] Q. Meng, G.S. Frankel, Effect of copper content on chromate conversion coating protection of 7xxx-T6 aluminum alloys, Corrosion 60 (2004) 897–905. [24] M.A. Jakab, D.A. Little, J.R. Scully, Experimental and modeling studies of the
oxygen reduction reaction on AA 2024-T3, J. Electrochem. Soc. 152 (2005) B311– B320.
[25] D.A. Little, M.A. Jakab, J.R. Scully, Effect of surface pretreatment on the underpaint corrosion of AA 2024-T3 at various temperatures, Corrosion 62 (2006) 300–315. [26] A.J. Davenport, B. Liu, Copper accumulation during cleaning of Al–Cu alloys,
Electrochemical Society Proceedings, (2001), pp. 41–46.
[27] P.J. Hurley, F.J. Humphreys, A study of recrystallization in single‐phase aluminium using in-situ annealing in the scanning electron microscope, J. Microsc. 213 (2004) 225–234.
[28] Z. Huda, N.I. Taib, T. Zaharinie, Characterization of 2024-T3: an aerospace alu-minum alloy, Mater. Chem. Phys. 113 (2009) 515–517.
[29] A.E. Hughes, C. MacRae, N. Wilson, A. Torpy, T.H. Muster, A.M. Glenn, Sheet AA 2024‐T3: a new investigation of microstructure and composition, Surf. Interface Anal. 42 (2010) 334–338.
[30] A. Hughes, T.H. Muster, A. Boag, A.M. Glenn, C. Luo, X. Zhou, G.E. Thompson, D. McCulloch, Co-operative corrosion phenomena, Corros. Sci. 52 (2010) 665–668. [31] S.C. Wang, M.J. Starink, Precipitates and intermetallic phases in precipitation
hardening Al–Cu–Mg–(Li) based alloys, Int. Mater. Rev. 50 (2005) 193–215. [32] N.D. Alexopoulos, Z. Velonaki, C.I. Stergiou, S.K. Kourkoulis, The effect of artificial
ageing heat treatments on the corrosion-induced hydrogen embrittlement of 2024 (Al–Cu) aluminium alloy, Corros. Sci. 102 (2016) 413–424.
[33] C.K.S. Moy, M. Weiss, J. Xia, G. Sha, S.P. Ringer, G. Ranzi, Influence of heat treatment on the microstructure, texture and formability of 2024 aluminium alloy, Mater. Sci. Eng.: A 552 (2012) 48–60.
[34] S.P. Ringer, K. Hono, Microstructural evolution and age hardening in aluminium alloys: atom probe field-ion microscopy and transmission electron microscopy studies, Mater. Charact. 44 (2000) 101–131.
[35] T.J. Bastow, A.J. Hill, Guinier-preston and guinier-preston-bagaryatsky zone re-version in Al-Cu-Mg alloys studied by NMR, Materials Science Forum, Trans. Tech. Publ., 2006 pp. 1385–1390.
[36] Y.A. Bagaryatsky, Structural changes on aging Al–Cu–Mg alloys, Dokl. Akad. SSSR (1952) 397–559.
[37] G. Sha, R.K.W. Marceau, X. Gao, B.C. Muddle, S.P. Ringer, Nanostructure of alu-minium alloy 2024: segregation, clustering and precipitation processes, Acta Mater. 59 (2011) 1659–1670.