CDK7 Inhibition Suppresses Super-Enhancer-Linked
Oncogenic Transcription in MYCN-Driven Cancer
The MIT Faculty has made this article openly available.
Please share
how this access benefits you. Your story matters.
Citation
Chipumuro, Edmond; Marco, Eugenio; Christensen, Camilla
L.; Kwiatkowski, Nicholas; Zhang, Tinghu; Hatheway, Clark M.;
Abraham, Brian J.; et al. “CDK7 Inhibition Suppresses
Super-Enhancer-Linked Oncogenic Transcription in MYCN-Driven Cancer.”
Cell 159, no. 5 (November 2014): 1126–1139. © 2014 Elsevier Inc.
As Published
http://dx.doi.org/10.1016/j.cell.2014.10.024
Publisher
Elsevier
Version
Author's final manuscript
Citable link
http://hdl.handle.net/1721.1/108010
Terms of Use
Creative Commons Attribution-NonCommercial-NoDerivs License
CDK7 Inhibition Suppresses Super-Enhancer-Linked Oncogenic
Transcription in MYCN-Driven Cancer
Edmond Chipumuro1,2, Eugenio Marco3,4, Camilla L. Christensen5, Nicholas Kwiatkowski6,
Tinghu Zhang7,8, Clark M. Hatheway1, Brian J. Abraham6, Bandana Sharma1, Caleb Yeung1,2, Abigail Altabef5, Antonio Perez-Atayde9, Kwok-Kin Wong5, Guo-Cheng Yuan3,4,
Nathanael S. Gray7,8, Richard A. Young6, and Rani E. George1,2,*
1Department of Pediatric Hematology/Oncology, Dana-Farber Cancer Institute, Boston, MA
02215, USA
2Department of Pediatrics, Harvard Medical School, Boston, MA 02115, USA
3Department of Biostatistics and Computational Biology, Dana-Farber Cancer Institute, Boston,
MA 02215, USA
4Harvard School of Public Health, Boston, MA 02115, USA
5Department of Medical Oncology, Dana-Farber Cancer Institute, Boston, MA 02215, USA 6Whitehead Institute for Biomedical Research and Department of Biology, Massachusetts
Institute of Technology, Cambridge, MA, 02139, USA
7Department of Cancer Biology, Dana-Farber Cancer Institute, Boston, MA 02215, USA 8Department of Biological Chemistry and Molecular Pharmacology, Harvard Medical School,
Boston, MA 02115, USA
9Department of Pathology, Boston Children’s Hospital, MA, 02115, USA
SUMMARY
The MYC oncoproteins are thought to stimulate tumor cell growth and proliferation through amplification of gene transcription, a mechanism that has thwarted most efforts to inhibit MYC function as potential cancer therapy. Using a novel covalent inhibitor of cyclin-dependent kinase 7 (CDK7) to disrupt the transcription of amplified MYCN in neuroblastoma cells, we demonstrate downregulation of the oncoprotein with consequent massive suppression of MYCN-driven global transcriptional amplification. This response translated to significant tumor regression in a mouse
© 2014 Elsevier Inc. All rights reserved.
*Correspondence: rani_george@dfci.harvard.edu. ACCESSION NUMBERS
Gene expression and ChIP-seq data reported in this paper will be deposited in the Gene Expression Omnibus. SUPPLEMENTAL INFORMATION
Supplemental information includes Supplemental Experimental Procedures, six figures and one table.
Publisher's Disclaimer: This is a PDF file of an unedited manuscript that has been accepted for publication. As a service to our
customers we are providing this early version of the manuscript. The manuscript will undergo copyediting, typesetting, and review of
NIH Public Access
Author Manuscript
Cell. Author manuscript; available in PMC 2015 November 20.
Published in final edited form as:
Cell. 2014 November 20; 159(5): 1126–1139. doi:10.1016/j.cell.2014.10.024.
NIH-PA Author Manuscript
NIH-PA Author Manuscript
model of high-risk neuroblastoma, without the introduction of systemic toxicity. The striking treatment selectivity of MYCN-overexpressing cells correlated with preferential downregulation of super-enhancer-associated genes, including MYCN and other known oncogenic drivers in
neuroblastoma. These results indicate that CDK7 inhibition, by selectively targeting the mechanisms that promote global transcriptional amplification in tumor cells, may be useful therapy for cancers that are driven by MYC family oncoproteins.
INTRODUCTION
Many human cancers depend on the deregulated expression of MYC family members for their aberrant growth and proliferation, with elevated expression of these oncogenes predicting aggressive disease and a poor clinical outcome (Eilers and Eisenman, 2008; Wasylishen and Penn, 2010). Deactivation of MYC in cell lines and MYC-induced transgenic tumors causes proliferative arrest and tumor regression (Arvanitis and Felsher, 2006; Soucek et al., 2008), suggesting that effective targeting of MYC proteins would have broad therapeutic benefit. Recently, several groups reported that oncogenic MYC elicits its plethora of downstream effects in tumor cells through global transcriptional amplification, leading to massively upregulated expression of genes involved in multiple processes (Lin et al., 2012; Loven et al., 2012; Nie et al., 2012; Schuhmacher and Eick, 2013). When present at physiological levels, MYC binds to the core promoters of actively transcribed genes; however, in tumor cells with MYC overexpression, increased MYC levels are observed at both the core promoters and enhancers of the same set of genes, resulting in increased levels of transcripts per cell. This mechanism provides an explanation for the lack of a common
MYC transcriptional signature and for the diverse effects of deregulated MYC in cancer
cells. Another general feature of deregulated MYC is its transcriptional regulation by super-enhancers (SEs), clusters of super-enhancers that are densely occupied by transcription factors, cofactors and chromatin regulators (Hnisz et al., 2013). Super-enhancers (SEs) are acquired by cancer cells through gene amplification, translocation or transcription factor
overexpression. They facilitate high-level expression of genes including MYC, whose protein products are critical for the control of cell identity, growth and proliferation, and which are especially sensitive to perturbation (Chapuy et al., 2013; Hnisz et al., 2013; Loven et al., 2013). These emerging insights into the role of oncogenic MYC as a SE-associated transcriptional amplifier suggest that strategies aimed at disrupting the associated molecular mechanisms might provide useful therapy for different MYC-dependent tumors.
The transcription cycle of RNA polymerase II (Pol II) is regulated by a set of cyclin-dependent kinases (CDKs) that have critical roles in transcription initiation and elongation (Larochelle et al., 2012). In contrast to the cell cycle CDKs which are largely responsible for cell cycle transition, these transcriptional CDKs (especially CDK7, a subunit of TFIIH, and CDK9, a subunit of pTEFb) phosphorylate the carboxy-terminal domain (CTD) of Pol II, facilitating efficient transcriptional initiation, pause release and elongation. Moreover, most CDKs are activated through T-loop phosphorylation by a CDK-activating kinase (CAK), which in metazoans appears to be uniquely controlled by CDK7 (Fisher and Morgan, 1994; Glover-Cutter et al., 2009; Larochelle et al., 2012; Larochelle et al., 2007; Rossignol et al., 1997; Serizawa et al., 1995). Inhibition of transcriptional CDKs primarily affects the
NIH-PA Author Manuscript
NIH-PA Author Manuscript
accumulation of transcripts with short half-lives, including antiapoptosis family members and cell cycle regulators (Garriga and Grana, 2004; Lam et al., 2001), rendering this group of kinases ideal candidates for blocking MYC-dependent transcriptional amplification. Here we investigate whether inhibition of transcriptional CDKs can be exploited to disrupt aberrant MYC-driven transcription, using the deregulated expression of MYCN as a model. The MYCN protein shares most of the physical properties of MYC (Kohl et al., 1986) and is considered functionally interchangeable, based on the similarity of their transcriptional programs, the cellular phenotypes they induce, and the ability of MYCN to replace MYC during murine development (Boon et al., 2001; Malynn et al., 2000; Toyoshima et al., 2012). In neuroblastoma (NB), a pediatric solid tumor arising in the peripheral sympathetic nervous system, MYCN amplification is typically associated with a dismal prognosis, regardless of the treatment used (Brodeur et al., 1984; Seeger et al., 1985).
We demonstrate that THZ1, a newly developed covalent inhibitor of CDK7 (Kwiatkowski et al., 2014), selectively targets MYCN-amplified NB cells, leading to global repression of
MYCN-dependent transcriptional amplification. This response induces sustained growth
inhibition of tumors in a mouse model of NB. The remarkable sensitivity of MYCN-amplified cells to CDK7 inhibition is associated with preferentially reduced expression of SE-associated oncogenic drivers, especially MYCN.
RESULTS
THZ1 Exerts Potent and Selective Effects in MYC-deregulated Cells
To identify CDKs whose depletion might lead to decreased MYCN expression and subsequent apoptosis, we performed a short-hairpin (shRNA) knockdown screen of CDKs with known transcriptional activities (CDKs 7–9, 12, 13, 19) in Kelly cells, a human NB line that expresses very high levels of MYCN RNA and protein due to genomically amplified
MYCN (100–120 copies per cell) (Schwab et al., 1983). Genetic depletion of CDK7, 8, 9 or
19 led to marked decreases of MYCN RNA and protein with a concomitant increase in cleaved caspase 3 (CC3) expression (Figures S1A and S1B). To reproduce these results pharmacologically, we tested a panel of 11 inhibitors with activity against transcriptional CDKs in three MYCN-amplified cell lines, observing a range of sensitivities, with the highest potency (IC50, 6–9 nM) shown by a newly developed covalent
phenylaminopyrimidine inhibitor of CDK7, THZ1 (Kwiatkowski et al., 2014) (Figure S1C and Table S1). Similar results were obtained when THZ1 was tested against a larger panel of
MYCN-amplified NB cell lines with varying levels of MYCN expression (Figures 1A and
S1D). Importantly, NB cells without MYCN amplification were far less sensitive to THZ1, with IC50 values averaging 10 times higher than those of MYCN-amplified cells (Figure 1A
and Table S1). Notably, the NBL-S cell line, which expresses high levels of MYCN without genomic amplification (Cohn et al., 1990) (Figure S1D), was quite sensitive to THZ1, while two nontransformed lines (B6-MEFs and NIH-3T3) were relatively insensitive (Figure 1A).
MYCN-amplified cells also showed enhanced sensitivity to THZ1R, a reversible analog of
THZ1 that lacks the acrylamide moiety required for covalent bond formation, although it was not as potent as the covalent inhibitor (Figure 1B). The strong selectivity of THZ1 for
MYCN-amplified cells was not restricted to NB, but extended to H262-BT111, a human
NIH-PA Author Manuscript
NIH-PA Author Manuscript
primitive neuroectodermal tumor cell line expressing amplified MYCN (K. Ligon, personal communication) and Raji and Daudi lymphoma cells, both characterized by MYC
overexpression due to chromosomal translocation (Nishikura et al., 1985; Veronese et al., 1995) (Figure S1E). To probe this preferential effect further, we tested the extent of target engagement in NB cells, using a biotinylated derivative of THZ1 (bio-THZ1) with or without THZ1 pre-treatment. Bio-THZ1 consistently bound to CDK7 in both MYCN-amplified and nonMYCN-amplified untreated cells (Figure S1F), but became less efficient after THZ1 treatment, suggesting that target recognition was not a major factor in the enhanced inhibitory effects of THZ1 in MYCN-amplified cells.
Next, we studied the growth inhibitory effects of THZ1. MYCN-amplified cells treated with THZ1 underwent cell cycle arrest in G2/M at 24 hours, an effect that was not observed in
MYCN-nonamplified NB cells, even after 48 hours (Figure 1C). Moreover, THZ1 led to a
profound induction of apoptosis in high MYCN-expressing cells, but not in cells expressing nonamplified MYCN (Figures 1D and S1G). Together, these data indicate that THZ1 induces selective cytotoxicity not only in NB cells with MYCN amplification, but also in other cancers overexpressing either the MYCN or MYC oncogene.
THZ1 Inhibits Tumor Growth in a Mouse Model of Human MYCN-amplified NB
Given the relative lack of target specificity of past CDK inhibitors, leading to adverse effects in normal cells (Lapenna and Giordano, 2009), we assessed the tolerability of THZ1 in non-tumor-bearing mice (n = 6) treated with 10 mg/kg intravenously twice daily. No systemic toxicity was observed even after 4 weeks of continuous administration (data not shown). We next tested the therapeutic effects of THZ1 in xenograft models of MYCN-amplified human NB derived from subcutaneous flank injection of Kelly cells. When tumors reached an optimal size (mean volume, ~150 mm3; range, 75–235 mm3), the animals were divided into two groups and treated with vehicle (n=9) or THZ1 as above; (n=14). Treatment was continued for a mean of 20 days (range, 15–24 days) in the control group and 24 days (range, 20–28 days) in the THZ1 group. Mice receiving THZ1 had a statistically significant reduction in tumor growth, again without toxicity (Figure 1E). Two animals remained free of tumor recurrence at 35 and 128 days post-treatment.
Tumors from vehicle-treated mice displayed histological features of human NB with poorly differentiated, small round blue cells displaying high mitotic activity (Figure 1F). By contrast, the vast majority of tumor cells in the THZ1-treated animals demonstrated necrosis, reduced proliferative activity and increased apoptosis. To ensure target
engagement in the tumor cells, we used bio-THZ1 to pull down CDK7 in cell lysates from both vehicle- and THZ1-treated animals, noting decreased binding with bio-THZ1 in the latter (Figure S1H). We also confirmed that the lack of toxicity in the animal models did not reflect THZ1 selectivity for human CDK7, as bio-THZ1 formed a complex with murine CDK7 in cell lysates from NIH-3T3 cells treated with THZ1 (Figure S1H). These results demonstrate the feasibility of specifically targeting CDK7 in tumor cells driven by deregulated MYC or MYCN.
NIH-PA Author Manuscript
NIH-PA Author Manuscript
THZ1 Affects Both Transcription and Cell Cycle Progression in MYCN-amplified Cells
As a transcriptional kinase, CDK7 exerts its effects through regulation of RNA Pol II-mediated transcriptional initiation and pause release, while also activating other CDKs through its CAK activity (Glover-Cutter et al., 2009; Larochelle et al., 2012; Palancade and Bensaude, 2003). We observed a dose-dependent decrease in the initiation-associated serine 5 (S5) and serine 7 (S7), and the elongation-associated serine 2 (S2) Pol II phosphorylation in MYCN-amplified but not nonamplified cells treated with THZ1 (Figures 2A and S2A). Pol II CTD phosphorylation was also downregulated in tumor cells from animals treated with THZ1 (Figure 2B). Downregulation of CDK7 phosphorylation was seen in MYCN-amplified cells (Figure S2B), consistent with the finding that CDK7 is regulated by
phosphorylation within its own activation (T) loop (Larochelle et al., 2012). Phosphorylation of CDK9 was also decreased in MYCN-amplified cells (Figure S2C), reinforcing the effect of THZ1 on transcription elongation. Total protein levels of CDK9 were also decreased in these cells but not nonamplified cells, suggesting that THZ1-induced CDK7 inhibition might also target the transcription of CDK9 (Figure S2C).
The decrease in Pol II phosphorylation after THZ1 treatment in MYCN-amplified cells coincided with the loss of the short-lived anti-apoptotic protein MCL1 (Figure 2C). Similar effects on Pol II CTD phosphorylation and MCL1 levels were observed in Raji, Daudi and H262-BTIII cells, all of which depend on MYC or MYCN overexpression and are sensitive to THZ1 (Figure S2D). Importantly, the effects of THZ1, including Pol II CTD
phosphorylation and the induction of apoptosis, could be rescued by a mutation in the covalent binding site of CDK7 (CDK7C312S) (Figure S2E), indicating on-target effects of THZ1 on CDK7.
CDK7 also stimulates cell cycle progression by activating CDKs 1 and 2 through its T-loop phosphorylation function (Larochelle et al., 2007). We observed a time-dependent decrease in CDK1 and 2 phosphorylation, and in other proteins involved in cell cycle regulation (pRB and E2F), that was more striking in MYCN-amplified cells (Figures 2D and S2F). However, the Pol II inhibitor triptolide appeared to show selectivity for MYCN-overexpressing cells, compared to purvanolol which primarily targets cell cycle CDKs (Figure S2G). Thus, although THZ1 causes cytotoxicity through transcriptional as well as cell cycle inhibition in
MYC-driven tumor cells, the latter effect is most likely through decreased transcription of
cell cycle CDKs.
CDK7 Inhibition causes Widespread Transcriptional Shutdown in MYCN-amplified NB Cells
Because THZ1 preferentially downregulates RNA Pol II CTD phosphorylation in MYCN-amplified cells (Figures 2A and S2A), we next compared the consequences of CDK7 inhibition on global gene expression in MYCN-amplified (Kelly and IMR-32) vs.
nonamplified (SH-SY5Y) cells following exposure to 100 nM THZ1 for 6 hours. Expression profiling was performed with “spike-in” RNA standards normalized to cell number to enable accurate detection of differences in total RNA levels in cells with or without MYCN
overexpression (Loven et al., 2012).
NIH-PA Author Manuscript
NIH-PA Author Manuscript
We observed a genome-wide decrease in the mRNA expression levels of most actively transcribed genes in MYCN-amplified cell lines compared to DMSO-treated cells (Figure 3A). This widespread downregulation of gene expression was not apparent in MYCN-nonamplified SH-SY5Y cells treated with the same dose and duration of THZ1 (Figure 3A). Indeed, the percentage of actively transcribed genes significantly downregulated in these cells was only 7.5%, contrasting with 63% for Kelly and 68% for IMR-32 MYCN-amplified cells (false discovery rate, FDR<0.05) (Figure 3B). Moreover, Kelly and IMR-32 cells had 55% (n=10,292) downregulated transcripts in common, while only 12% (n=1225) of these were also downregulated in SH-SY5Y cells (out of 18,665 genes) (Figure 3C). The most downregulated genes and gene sets in the MYCN-amplified cells were transcriptional and cell cycle regulators (Figures S3A–B); including transcripts of CDKs and their partner cyclins (Figures 3D and S3C). Comparison of expression profiles of MYCN-amplified cells exposed to THZ1 with those exposed to the general transcription inhibitor actinomycin D revealed a significant correlation between the two (R2 = 0.76) (Figure 3E). These results led us to conclude that CDK7 inhibition, through THZ1, preferentially downregulates global transcription in MYCN-amplified NB cells, affecting most active genes.
THZ1 Targets Deregulated MYCN in NB Cells
The selectivity of THZ1 for MYC/MYCN-deregulated cells led us to investigate its effects on MYCN expression and function. We observed that MYCN mRNA was among the top 15% of significantly downregulated transcripts in NB cell lines most sensitive to THZ1. Moreover, transcripts differentially regulated on exposure to THZ1 revealed enrichment for previously published MYCN/MYC target gene sets (Figure S4A). THZ1 treatment resulted in a dose- and time-dependent downregulation of MYCN mRNA and protein levels in
MYCN-amplified cells (Figures 4A and 4B), which were rescued by overexpression of the CDK7C312S mutant (Figure S4B), similar to observations with an ATP analogue in colorectal carcinoma cells expressing a CDK7 mutation (Glover-Cutter et al., 2009). We also observed downregulation of MYCN protein levels in the human NB tumors from mice that responded to THZ1 (Figure 4C). These effects primarily reflected a reduction in MYCN transcripts, as comparison of MYCN protein turnover in MYCN-amplified cells exposed to either THZ1 or actinomycin D showed largely similar rates of degradation (Figure S4C). Finally, analysis of MYCN occupancy at the promoters of two of its known transcriptional targets, MDM2 (Slack et al, 2005) and MCL1 (Labisso et al., 2012), revealed significantly decreased MYCN binding, consistent with the disruption of MYCN function by THZ1 (Figure 4D).
Next, we determined whether genetic depletion of MYCN mimicked the effects of THZ1 in MYCN-amplified cells. Abrogation of amplified MYCN expression in Kelly cells using shRNA knockdown led to decreased Pol II CTD phosphorylation at S2, S5 and S7 (Figure 4E), similar to our findings with THZ1 treatment. The inhibition of transcription associated with MYCN knockdown was coupled with complete loss of MCL1 and subsequent cell death (Figure 4E). We next asked whether ectopic expression of MYCN would sensitize cells to THZ1. MYCN-nonamplified SH-SY5Y cells were engineered to express the oncogene by lentiviral transduction, resulting in approximately 380-fold increases in MYCN mRNA and protein levels (Figure 4F), equivalent to those in MYCN-amplified cells (Figure S1D).
NIH-PA Author Manuscript
NIH-PA Author Manuscript
Ectopic expression of MYCN in these cells led to a 5-fold greater sensitivity to THZ1 compared with untransfected or vector control-transfected SH-SY5Y cells (Figure 4G). Together, these results indicate that THZ1 specifically targets deregulated MYCN in NB cells, sensitizing them to the inhibitor.
Amplified MYCN Induces Global Transcriptional Amplification That is Inhibited by THZ1
Downregulation of MYCN alone seemed insufficient to account for the widespread effects of THZ1 on the transcriptional output of cells harboring amplified MYCN. We therefore questioned whether deregulated MYCN, like MYC, binds promiscuously to active genes, leading to global transcriptional amplification, and whether THZ1 preferentially disrupts this effect. Indeed, ectopic expression of MYCN in SH-SY5Y cells led to increased cell size (Figure S5A), and significantly increased expression of all active transcripts (Figures 5A and S5B). Moreover, THZ1 treatment led to significant downregulation of transcriptional output in these cells (Figure 5B) with induction of apoptosis, although MYCN protein levels were not affected (Figure 5C). Furthermore, shRNA knockdown of MYCN in MYCN-amplified cells led to a striking downregulation of global gene expression in comparison to their control shRNA-expressing counterparts (Figures 5D and 5E), again underscoring the widespread transcriptional effects of deregulated MYCN. To determine the extent to which these effects mirrored those of CDK7 inhibition, we compared the expression profiles of
MYCN-amplified cells expressing a MYCN shRNA with those of THZ1-treated cells, noting
significant downregulation of the actively transcribed genes in both types of cells, with a close correlation between the top 500 downregulated transcripts in THZ1-treated cells and those in MYCN shRNA-depleted cells (Figures 5F and S5C). Hence, disruption of MYCN-induced transcriptional amplification also contributes to the striking effects of THZ1.
Super-enhancers Can Account for the Selectivity of THZ1 for MYCN-amplified NB Cells
We observed that the ectopic overexpression of MYCN in nonamplified cells led to global transcriptional upregulation and sensitization to the growth inhibitory effects of THZ1, although the latter effect did not approach the levels seen in cells with endogenously amplified MYCN. We therefore investigated the possible contribution of super-enhancers (SEs) to the extreme susceptibility of endogenous MYCN-amplified cells to THZ1. Using chromatin immunoprecipitation with high-throughput sequencing (ChIP-seq) of histone H3K27 acetylation (H3K27ac), a mark of active enhancers (Hnisz et al., 2013), we first identified enhancer regions in MYCN-amplified Kelly and nonamplified SH-SY5Y cells (Figure S6A). In both cell types, a subset of H3K27ac-bound enhancers (Kelly 6.2%, SH-SY5Y, 5.4%) had a significantly higher signal than regular enhancers and were therefore classified as SEs (Loven et al., 2013; Whyte et al., 2013) (Figure 6A). We also analyzed the occupancy of H3K4 monomethylation, a mark that colocalizes with H3K27ac in strong enhancers, noting a high concordance (94–99%) with enhancers identified by H3K27ac analysis (Figures 6B and S6B).
The SEs in MYCN-amplified cells were either unique or disproportionately loaded with H3K27ac, with the largest SE being associated with the MYCN oncogene itself, having an H3K27Ac signal that was at least 10 times greater than that of any other SE in either these or MYCN-nonamplified cells (Figures 6A and 6B). Since the MYCN SE in Kelly cells is
NIH-PA Author Manuscript
NIH-PA Author Manuscript
contained within the MYCN amplicon, we questioned whether its SE status merely reflected the increased number of copies of the amplified gene. To investigate this possibility, we estimated the signal of a single copy of MYCN, and recalculated its rank within the list of enhancers. A single copy of the MYCN enhancer still fell within the group of SEs (ranked 250 out of 746), indicating that increased gene copy number does not account for the high SE signal associated with MYCN. The majority of genes associated with the remaining top-ranked SEs were master transcription factors critical to sympathetic neuronal development and cell identity including PHOX2B (Pattyn et al., 1999; Stanke et al., 1999), GATA2 (Tsarovina et al., 2004), HAND2 (Howard et al., 2000) and DBH (Mercer et al., 1991) (Figures 6A and 6C). Another major oncogenic driver in NB, the receptor tyrosine kinase
ALK (George et al., 2008), was associated with a unique top-ranked SE in MYCN-amplified
cells (Figures 6A and 6C). In general, the SE domains associated with MYCN amplification correlated with pathways involved in the regulation of transcription, while those in
nonamplified cells were primarily related to cell adhesion, invasion, metastasis and receptor tyrosine kinase pathways (Figures 6D and S6C). To ensure that the SEs in the cultured cells mirrored those of human NB, we analyzed H3K27ac occupancy in three primary tumors (Figures 6E and S6D). Consistent with our cell line data, the largest SE in MYCN-amplified samples NB#1 and NB#2 was associated with MYCN (Figures 6E and S6E). SEs associated with PHOX2B and HAND2 were identified in all tumor samples (Figure 6E), in keeping with their lineage-specific role in sympathetic neuronal development.
To determine whether the occurrence of SEs correlated with increased Pol II occupancy, we used ChIP-seq analysis of Pol II and observed that the proximal promoter regions of SE-associated genes had higher levels of Pol II occupancy compared with regular enhancers in both MYCN-amplified and nonamplified cells, although the difference was much more striking in the former (Figure 7A). THZ1 treatment led to a striking reduction in Pol II binding at the promoter regions and gene bodies of SE-associated genes in MYCN-amplified but not nonamplified cells (Figure 7A). Pol II binding at regular enhancer-associated genes was not appreciably affected by THZ1 in either cell type (Figure 7A). The reduction in Pol II occupancy with THZ1 was observed at the transcription start and end sites of genes associated with the top-ranked SEs, including MYCN, suggesting that their expression was severely curtailed in these cells (Figure 7B). Indeed, RNA expression of SE-associated genes was significantly reduced after THZ1 treatment in MYCN-amplified cells (Figure 7C) but not of the same genes in MYCN-nonamplified cells (Figure 7C). Thus, not only do SEs in MYCN-amplified cells cause high-level expression of oncogenic drivers and genes that determine cell identity, but they also confer exquisite selectivity to perturbation by THZ1.
DISCUSSION
Here we demonstrate that the genomically amplified MYCN oncogene, by promoting the development of SEs, leads to upregulation of the active transcriptional program of NB cells, sensitizing them to inhibition of CDK7, a widely expressed regulator of transcription and cell cycle transition. This effect suppresses essentially all active transcripts, especially those responsible for the uncontrolled proliferation that characterizes the cancer cell state, leading to potent and selective cytotoxicity while sparing normal cells. The high potency of the CDK7 inhibitor, THZ1 can be explained in part by its unprecedented mode of binding - the
NIH-PA Author Manuscript
NIH-PA Author Manuscript
formation of a covalent bond with a unique cysteine residue outside the kinase domain - resulting in prolonged and irreversible CDK7 inactivation (Kwiatkowski et al., 2014). This feature contrasts with other transcriptional CDK inhibitors, including flavopiridol,
roscovitine and CR-8 (Table S1), all of which rely on ATP-competitive modes of binding and whose effects on transcription would therefore be expected to be transient. The selectivity of THZ1 for MYCN-amplified cells can be attributed to the perturbation of SEs associated with deregulated MYCN and other oncogenic drivers.
Despite risk-based treatment strategies for MYCN-amplified NB, responses tend to be brief, with early relapses that are almost uniformly fatal (Matthay et al., 1999). Finding suitable ways to inhibit MYCN, or any MYC family member for that matter, has been notoriously difficult. A recent approach is the modulation of bromodomain and extraterminal (BET) domain coactivator proteins such as BRD4, which associates with acetylated chromatin and promotes transcriptional activation (Delmore et al., 2011; Loven et al., 2013; Puissant et al., 2013). After successful testing of the BRD4 inhibitor JQ1 in MYC-dependent multiple myeloma models (Delmore et al., 2011), a positive correlation between MYCN amplification and sensitivity to JQ1 was demonstrated in the majority of MYCN-amplified NB models tested (Puissant et al., 2013). However, others reported growth inhibition of NB using the structurally distinct BRD4 inhibitor I-BET726, irrespective of MYCN amplification status or
MYC/MYCN expression levels (Wyce et al., 2013). The intervention we describe has a
number of novel features that would support the clinical development of covalent CDK7 inhibitors for use against MYCN-amplified NB and other MYC-driven cancers. These include the ability to achieve potent growth inhibition with relatively low doses of THZ1, the lack of off-target effects and the absence of discernible toxicity in a mouse model of NB. Multiple studies argue that MYC is a global transcriptional amplifier (Lin et al., 2012; Loven et al., 2012; Nie et al., 2012; Schuhmacher and Eick, 2013), although a recent report has suggested that a portion of this amplification is indirect (Sabo et al., 2014). We believe the transcriptional amplification effects of MYC are direct at the vast majority of active genes and that differences in interpretation of direct vs. indirect effects are due to differences in interpretation of ChIP-seq data thresholds. We demonstrate here that deregulated MYCN functions as a transcriptional amplifier of the cell’s existing gene expression program rather than a specific target gene set. This effect was not detectable in earlier data sets on MYCN-amplified tumor samples because of a limitation of microarray analysis, which in
conventional approaches assumes similar levels of total RNA in all the samples (Loven et al., 2012).
Although in principle, blockade of CDK7 function would be expected to inhibit the expression of any gene poised to undergo transcription, our direct demonstration that manipulation of MYCN levels can modulate the sensitivity to THZ1 supports the idea that MYC-induced transcriptional amplification is crucial to THZ1 activity. This transcriptional dependency was illustrated by the massive transcriptional shutdown in MYCN-amplified cells with relatively low doses of THZ1 (Figure 3). By contrast, although CDK transcripts were downregulated by THZ1 in MYCN-nonamplified cells, this effect did not produce the same profound impact seen in MYCN-amplified cells, providing further evidence that aberrant MYCN expression and the resultant global amplification of transcription are
NIH-PA Author Manuscript
NIH-PA Author Manuscript
necessary for cell sensitivity to THZ1. This critical dependency on transcriptional amplification would account for the selective killing of MYCN-amplified cells by THZ1 without inducing toxic side effects in mice. The unique SE landscapes of MYCN-amplified cells also dictate their response to THZ1. Indeed, genes involved in the oncogenic state - such as MYCN and ALK, and those that specify sympathetic neuronal cell identity including
PHOX2B and HAND2 - were associated with SEs and were far more susceptible to THZ1
than either their counterparts in MYCN-nonamplified cells or genes driven by regular enhancers. This selectivity of THZ1 for MYCN-amplified cells could stem from its inhibition of the increased Pol II activity at SE-associated genes, leading to downregulation of MYCN expression as well as that of the entire transcriptional program of the cell.
Our data suggest that the cytotoxicity induced by THZ1 in MYCN-driven NB cells is mediated by inhibition of both MYCN expression and MYCN-stimulated global
transcriptional amplification (Figure 7D). Amplified MYCN invades the core promoters and enhancer regions of actively transcribed genes, resulting in the formation of SEs at key genes underlying the cancer cell state, including MYCN, and ultimately in transcriptional amplification. THZ1, by irreversibly inhibiting CDK7, blocks transcription of MYCN (Figure 4) as well as MYCN-induced amplification of global gene transcription. The latter conclusion is based on the widespread inhibition of transcription in MYCN-amplified cells (Figure 3), the highly significant correlation between the transcripts that were
downregulated by THZ1 and those resulting from genetic depletion of MYCN and the fact that ectopic expression of MYCN in non-MYCN-overexpressing cells sensitizes these cells to widespread transcriptional inhibition by THZ1 (Figures 4 and 5). Together, these two processes effectively deprive tumor cells of the proliferative signals to which they have become addicted, leading to apoptotic death. Nevertheless, this mechanism is not necessarily specific to deregulated MYCN or MYC. Rather, we suggest that inhibition of CDK7 or perhaps other transcriptional CDKs would be effective in any context in which tumor cells rely on high-level expression of one or more oncogenic transcription factors for their aberrant growth and survival. However, the net inhibitory effect is likely to be much more profound in cancers that depend on MYC (or MYCN) as the oncogenic driver.
In conclusion, we use NB and a newly developed transcriptional CDK inhibitor to demonstrate the potency and selectivity of a potential treatment strategy that targets global transcriptional amplification in MYC-driven tumors. Our results suggest that the mechanism by which oncogenic MYC gains control over myriad cellular processes to induce tumor formation also exposes a vulnerability that can be exploited therapeutically. By using THZ1 to disable essential components of the cancer cells’ transcriptional machinery, we show that widespread suppression of transcription in MYC-dependent cancers is not only feasible, but also spares normal cells from toxicity.
EXPERIMENTAL PROCEDURES
Cell Lines
Human NB cell lines (from the Children’s Oncology Group) and Raji and Daudi cells (provided by D. Sabatini, Massachusetts Institute of Technology) were grown in RPMI-1640, 10% fetal bovine serum (FBS) and 1% penicillin/streptomycin (pen/strep;
NIH-PA Author Manuscript
NIH-PA Author Manuscript
Invitrogen). H262-BT111 primitive neuroectodermal tumor cells (provided by K. Ligon, Dana-Farber Cancer Institute, DFCI), were grown in neuronal stem cell (NSC) media with heparin, NSC supplement (Stem Cell Technologies), 1% pen/strep, erythrocyte growth factor (EMD Millipore) and fibroblast growth factor (Life Technologies). NIH-3T3 cells (purchased from ATCC) and B6-MEFs (provided by A. Kung, Columbia University) were grown in DMEM with 10% FBS and 1% pen/strep.
Animal Studies
These experiments were performed with approval from the Institutional Animal Care and Use Committee of the DFCI. Full details are given in Extended Experimental Procedures.
Synthetic RNA Spike-In and Microarray analysis
RNA samples were prepared as previously described (Loven et al., 2012). Total RNA was spiked-in with RNA Spike-In Mix (Ambion), treated with DNA-free™ DNase I (Ambion), analyzed on Agilent 2100 Bioanalyzer (Agilent Technologies) for integrity, and hybridized to Affymetrix GeneChip® PrimeView™ Human Gene Expression arrays (Affymetrix). Data analysis is described in Extended Experimental Procedures.
ChIP-seq
ChIP was carried out as previously described (Lee et al., 2006) with minor changes described in Extended Experimental Procedures. The following antibodies were used: RNAPII (Santa Cruz, sc-899), H3K4me1 (Abcam, ab8895) and H3K27ac (Abcam, ab4729).
Data Analysis
All ChIP-seq data were aligned using the short-read aligner Bowtie (version 0.12.7)
(Langmead et al., 2009) to build version GRCh37/HG19 of the human genome. To visualize ChIP-seq tracks, reads were extended by 160 bases, converted into tdf files using igvtools (version 2.2.1) and visualized in IGV (Robinson et al., 2011). ChIP-seq peaks were detected using a peak-finding algorithm, MACS version 1.4.2 (Zhang et al., 2008) using the default p-value threshold of enrichment of 1 × 10⁻⁵ for all data sets. Active enhancers, ranked according to the magnitude of the H3K27ac signal, were defined as regions of ChIP-seq enrichment for H3K27ac and H3K4me1 outside of promoters. To identify super-enhancers we employed the ROSE algorithm (https://bitbucket.org/young_computation/rose) (Loven et al., 2013; Whyte et al., 2013) to rank the enhancers that were identified using MACS in which peaks within 12.5kb of one another were stitched together and these stitched
enhancers were ranked by their difference in H3K27ac signal vs. input signal. Further details are given in Extended Experimental Procedures.
Supplementary Material
Refer to Web version on PubMed Central for supplementary material.
Acknowledgments
We thank K. Ligon, D. Sabatini. W. Weiss, A. Kung and the Children’s Oncology Group for cell lines and plasmids and P. Baran for the dCA compound. We thank J.R. Gilbert for insightful discussions. This study was supported by
NIH-PA Author Manuscript
NIH-PA Author Manuscript
NIH R01CA148688 (REG), R01CA148688S1 (EC), R01CA179483-01 (NSG and THZ), and R21HG006778 (GCY), American Cancer Society (RSG-12-247-TBG, REG), Department of Defense (PR120741A, REG) and Friends for Life Neuroblastoma Foundation (NSG and REG). THZ1 has been licensed to Syros Pharmaceuticals for clinical development. NSG and RAY are scientific founders of Syros Pharmaceuticals.
We thank J.R. Gilbert and Takaomi Sanda for insightful discussions.
References
Arvanitis C, Felsher DW. Conditional transgenic models define how MYC initiates and maintains tumorigenesis. Semin Cancer Biol. 2006; 16:313–317. [PubMed: 16935001]
Boon K, Caron HN, van Asperen R, Valentijn L, Hermus MC, van Sluis P, Roobeek I, Weis I, Voute PA, Schwab M, et al. N-myc enhances the expression of a large set of genes functioning in ribosome biogenesis and protein synthesis. The EMBO journal. 2001; 20:1383–1393. [PubMed: 11250904]
Brodeur GM, Seeger RC, Schwab M, Varmus HE, Bishop JM. Amplification of N-myc in untreated human neuroblastomas correlates with advanced disease stage. Science. 1984; 224:1121–1124. [PubMed: 6719137]
Chapuy B, McKeown MR, Lin CY, Monti S, Roemer MG, Qi J, Rahl PB, Sun HH, Yeda KT, Doench JG, et al. Discovery and characterization of super-enhancer-associated dependencies in diffuse large B cell lymphoma. Cancer Cell. 2013; 24:777–790. [PubMed: 24332044]
Cohn SL, Salwen H, Quasney MW, Ikegaki N, Cowan JM, Herst CV, Kennett RH, Rosen ST, DiGiuseppe JA, Brodeur GM. Prolonged N-myc protein half-life in a neuroblastoma cell line lacking N-myc amplification. Oncogene. 1990; 5:1821–1827. [PubMed: 2284101]
Delmore JE, Issa GC, Lemieux ME, Rahl PB, Shi J, Jacobs HM, Kastritis E, Gilpatrick T, Paranal RM, Qi J, et al. BET bromodomain inhibition as a therapeutic strategy to target c-Myc. Cell. 2011; 146:904–917. [PubMed: 21889194]
Eilers M, Eisenman RN. Myc’s broad reach. Genes Dev. 2008; 22:2755–2766. [PubMed: 18923074] Fisher RP, Morgan DO. A novel cyclin associates with MO15/CDK7 to form the CDK-activating
kinase. Cell. 1994; 78:713–724. [PubMed: 8069918]
Garriga J, Grana X. Cellular control of gene expression by T-type cyclin/CDK9 complexes. Gene. 2004; 337:15–23. [PubMed: 15276198]
George RE, Sanda T, Hanna M, Frohling S, Luther W 2nd, Zhang J, Ahn Y, Zhou W, London WB, McGrady P, et al. Activating mutations in ALK provide a therapeutic target in neuroblastoma. Nature. 2008; 455:975–978. [PubMed: 18923525]
Glover-Cutter K, Larochelle S, Erickson B, Zhang C, Shokat K, Fisher RP, Bentley DL. TFIIH-associated Cdk7 kinase functions in phosphorylation of C-terminal domain Ser7 residues, promoter-proximal pausing, and termination by RNA polymerase II. Mol Cell Biol. 2009; 29:5455–5464. [PubMed: 19667075]
Hnisz D, Abraham BJ, Lee TI, Lau A, Saint-Andre V, Sigova AA, Hoke HA, Young RA. Super-enhancers in the control of cell identity and disease. Cell. 2013; 155:934–947. [PubMed: 24119843]
Howard MJ, Stanke M, Schneider C, Wu X, Rohrer H. The transcription factor dHAND is a downstream effector of BMPs in sympathetic neuron specification. Development. 2000; 127:4073–4081. [PubMed: 10952904]
Kohl NE, Legouy E, DePinho RA, Nisen PD, Smith RK, Gee CE, Alt FW. Human N-myc is closely related in organization and nucleotide sequence to c-myc. Nature. 1986; 319:73–77. [PubMed: 3510398]
Kwiatkowski N, Zhang T, Rahl PB, Abraham BJ, Reddy J, Ficarro SB, Dastur A, Amzallag A, Ramaswamy S, Tesar B, et al. Targeting transcription regulation in cancer with a covalent CDK7 inhibitor. Nature. 2014; 511:616–620. [PubMed: 25043025]
Labisso WL, Wirth M, Stojanovic N, Stauber RH, Schnieke A, Schmid RM, Kramer OH, Saur D, Schneider G. MYC directs transcription of MCL1 and eIF4E genes to control sensitivity of gastric cancer cells toward HDAC inhibitors. Cell Cycle. 2012; 11:1593–1602. [PubMed: 22456335]
NIH-PA Author Manuscript
NIH-PA Author Manuscript
Lam LT, Pickeral OK, Peng AC, Rosenwald A, Hurt EM, Giltnane JM, Averett LM, Zhao H, Davis RE, Sathyamoorthy M, et al. Genomic-scale measurement of mRNA turnover and the mechanisms of action of the anti-cancer drug flavopiridol. Genome biology. 2001; 2:RESEARCH0041. [PubMed: 11597333]
Langmead B, Trapnell C, Pop M, Salzberg SL. Ultrafast and memory-efficient alignment of short DNA sequences to the human genome. Genome biology. 2009; 10:R25. [PubMed: 19261174] Lapenna S, Giordano A. Cell cycle kinases as therapeutic targets for cancer. Nature reviews Drug
discovery. 2009; 8:547–566.
Larochelle S, Amat R, Glover-Cutter K, Sanso M, Zhang C, Allen JJ, Shokat KM, Bentley DL, Fisher RP. Cyclin-dependent kinase control of the initiation-to-elongation switch of RNA polymerase II. Nat Struct Mol Biol. 2012; 19:1108–1115. [PubMed: 23064645]
Larochelle S, Merrick KA, Terret ME, Wohlbold L, Barboza NM, Zhang C, Shokat KM, Jallepalli PV, Fisher RP. Requirements for Cdk7 in the assembly of Cdk1/cyclin B and activation of Cdk2 revealed by chemical genetics in human cells. Mol Cell. 2007; 25:839–850. [PubMed: 17386261] Lee TI, Johnstone SE, Young RA. Chromatin immunoprecipitation and microarray-based analysis of
protein location. Nat Protoc. 2006; 1:729–748. [PubMed: 17406303]
Lin CY, Loven J, Rahl PB, Paranal RM, Burge CB, Bradner JE, Lee TI, Young RA. Transcriptional amplification in tumor cells with elevated c-Myc. Cell. 2012; 151:56–67. [PubMed: 23021215] Loven J, Hoke HA, Lin CY, Lau A, Orlando DA, Vakoc CR, Bradner JE, Lee TI, Young RA.
Selective inhibition of tumor oncogenes by disruption of super-enhancers. Cell. 2013; 153:320– 334. [PubMed: 23582323]
Loven J, Orlando DA, Sigova AA, Lin CY, Rahl PB, Burge CB, Levens DL, Lee TI, Young RA. Revisiting global gene expression analysis. Cell. 2012; 151:476–482. [PubMed: 23101621] Malynn BA, de Alboran IM, O’Hagan RC, Bronson R, Davidson L, DePinho RA, Alt FW. N-myc can
functionally replace c-myc in murine development, cellular growth, and differentiation. Genes Dev. 2000; 14:1390–1399. [PubMed: 10837031]
Matthay KK, Villablanca JG, Seeger RC, Stram DO, Harris RE, Ramsay NK, Swift P, Shimada H, Black CT, Brodeur GM, et al. Treatment of high-risk neuroblastoma with intensive chemotherapy, radiotherapy, autologous bone marrow transplantation, and 13-cis-retinoic acid. Children’s Cancer Group. The New England journal of medicine. 1999; 341:1165–1173. [PubMed: 10519894] McLean CY, Bristor D, Hiller M, Clarke SL, Schaar BT, Lowe CB, Wenger AM, Bejerano G. GREAT
improves functional interpretation of cis-regulatory regions. Nature biotechnology. 2010; 28:495– 501.
Mercer EH, Hoyle GW, Kapur RP, Brinster RL, Palmiter RD. The dopamine beta-hydroxylase gene promoter directs expression of E. coli lacZ to sympathetic and other neurons in adult transgenic mice. Neuron. 1991; 7:703–716. [PubMed: 1742021]
Nie Z, Hu G, Wei G, Cui K, Yamane A, Resch W, Wang R, Green DR, Tessarollo L, Casellas R, et al. c-Myc is a universal amplifier of expressed genes in lymphocytes and embryonic stem cells. Cell. 2012; 151:68–79. [PubMed: 23021216]
Nishikura K, Erikson J, ar-Rushdi A, Huebner K, Croce CM. The translocated c-myc oncogene of Raji Burkitt lymphoma cells is not expressed in human lymphoblastoid cells. Proc Natl Acad Sci U S A. 1985; 82:2900–2904. [PubMed: 3857623]
Palancade B, Bensaude O. Investigating RNA polymerase II carboxyl-terminal domain (CTD) phosphorylation. European journal of biochemistry/FEBS. 2003; 270:3859–3870. [PubMed: 14511368]
Pattyn A, Morin X, Cremer H, Goridis C, Brunet JF. The homeobox gene Phox2b is essential for the development of autonomic neural crest derivatives. Nature. 1999; 399:366–370. [PubMed: 10360575]
Puissant A, Frumm SM, Alexe G, Bassil CF, Qi J, Chanthery YH, Nekritz EA, Zeid R, Gustafson WC, Greninger P, et al. Targeting MYCN in neuroblastoma by BET bromodomain inhibition. Cancer discovery. 2013; 3:308–323. [PubMed: 23430699]
Robinson JT, Thorvaldsdottir H, Winckler W, Guttman M, Lander ES, Getz G, Mesirov JP. Integrative genomics viewer. Nature biotechnology. 2011; 29:24–26.
NIH-PA Author Manuscript
NIH-PA Author Manuscript
Rossignol M, Kolb-Cheynel I, Egly JM. Substrate specificity of the cdk-activating kinase (CAK) is altered upon association with TFIIH. The EMBO journal. 1997; 16:1628–1637. [PubMed: 9130708]
Sabo A, Kress TR, Pelizzola M, de Pretis S, Gorski MM, Tesi A, Morelli MJ, Bora P, Doni M, Verrecchia A, et al. Selective transcriptional regulation by Myc in cellular growth control and lymphomagenesis. Nature. 2014; 511:488–492. [PubMed: 25043028]
Schuhmacher M, Eick D. Dose-dependent regulation of target gene expression and cell proliferation by c-Myc levels. Transcription. 2013:4.
Schwab M, Alitalo K, Klempnauer KH, Varmus HE, Bishop JM, Gilbert F, Brodeur G, Goldstein M, Trent J. Amplified DNA with limited homology to myc cellular oncogene is shared by human neuroblastoma cell lines and a neuroblastoma tumour. Nature. 1983; 305:245–248. [PubMed: 6888561]
Seeger RC, Brodeur GM, Sather H, Dalton A, Siegel SE, Wong KY, Hammond D. Association of multiple copies of the N-myc oncogene with rapid progression of neuroblastomas. The New England journal of medicine. 1985; 313:1111–1116. [PubMed: 4047115]
Serizawa H, Makela TP, Conaway JW, Conaway RC, Weinberg RA, Young RA. Association of Cdk-activating kinase subunits with transcription factor TFIIH. Nature. 1995; 374:280–282. [PubMed: 7885450]
Soucek L, Whitfield J, Martins CP, Finch AJ, Murphy DJ, Sodir NM, Karnezis AN, Swigart LB, Nasi S, Evan GI. Modelling Myc inhibition as a cancer therapy. Nature. 2008; 455:679–683. [PubMed: 18716624]
Stanke M, Junghans D, Geissen M, Goridis C, Ernsberger U, Rohrer H. The Phox2 homeodomain proteins are sufficient to promote the development of sympathetic neurons. Development. 1999; 126:4087–4094. [PubMed: 10457017]
Toyoshima M, Howie HL, Imakura M, Walsh RM, Annis JE, Chang AN, Frazier J, Chau BN, Loboda A, Linsley PS, et al. Functional genomics identifies therapeutic targets for MYC-driven cancer. Proc Natl Acad Sci U S A. 2012; 109:9545–9550. [PubMed: 22623531]
Tsarovina K, Pattyn A, Stubbusch J, Muller F, van der Wees J, Schneider C, Brunet JF, Rohrer H. Essential role of Gata transcription factors in sympathetic neuron development. Development. 2004; 131:4775–4786. [PubMed: 15329349]
Veronese ML, Ohta M, Finan J, Nowell PC, Croce CM. Detection of myc translocations in lymphoma cells by fluorescence in situ hybridization with yeast artificial chromosomes. Blood. 1995; 85:2132–2138. [PubMed: 7718884]
Wasylishen AR, Penn LZ. Myc: the beauty and the beast. Genes & cancer. 2010; 1:532–541. [PubMed: 21779457]
Whyte WA, Orlando DA, Hnisz D, Abraham BJ, Lin CY, Kagey MH, Rahl PB, Lee TI, Young RA. Master transcription factors and mediator establish super-enhancers at key cell identity genes. Cell. 2013; 153:307–319. [PubMed: 23582322]
Wyce A, Ganji G, Smitheman KN, Chung CW, Korenchuk S, Bai Y, Barbash O, Le B, Craggs PD, McCabe MT, et al. BET inhibition silences expression of MYCN and BCL2 and induces cytotoxicity in neuroblastoma tumor models. PLoS One. 2013; 8:e72967. [PubMed: 24009722] Zhang Y, Liu T, Meyer CA, Eeckhoute J, Johnson DS, Bernstein BE, Nusbaum C, Myers RM, Brown
M, Li W, et al. Model-based analysis of ChIP-Seq (MACS). Genome biology. 2008; 9:R137. [PubMed: 18798982]
NIH-PA Author Manuscript
NIH-PA Author Manuscript
Figure 1. THZ1 Exhibits High Potency and Selectivity Against MYCN-amplified Tumor Cells
(A) Dose-response curves of MYCN-amplified and nonamplified human NB and murine fibroblast cells after treatment with increasing concentrations of THZ1 for 72 hr. Percent cell viability relative to that of DMSO-treated cells is shown here and in (B). Data represent mean ± SD of 3 replicates here and in (B).
(B) Dose-response curves of NB cells treated as in (A) with the reversible CDK7 inhibitor THZ1R.
NIH-PA Author Manuscript
NIH-PA Author Manuscript
(C) Cell-cycle analysis of MYCN-amplified vs. nonamplified NB cells exposed to THZ1 (100 nM × 24 and 48 hr) by flow cytometry with propidium iodide (PI) staining. Results are representative of 3 replicates. The scale and axes are indicated in the lower left corner. (D) Apoptosis analysis in MYCN-amplified and nonamplified NB cells treated with THZ1 as in (C) by flow cytometry with Annexin V staining. Data represent mean ± SD of 3
replicates. ***p<0.0001, **p<0.001 (Student’s t-test).
(E) Tumor volumes of MYCN-amplified human NB xenografts in NU/NU
(Crl:NU-Foxn1nu) mice treated with THZ1 (10 mg/kg IV twice daily) (n=14) or vehicle (n=9) for 28
days. Mean ± SD values are presented. ***p<0.001; **p<0.01; *p<0.05 (multiple t-test, Holm-Sidak method).
(F) Immunohistochemical (IHC) analysis of morphology (hematoxylin & eosin, H&E), proliferation (Ki67) and apoptosis (cleaved caspase 3, CC3) in tumors harvested from animals treated with vehicle or THZ1 as in (E) for 12 days. Scale bar, 25 μM.
See also Figure S1, Table S1.
NIH-PA Author Manuscript
NIH-PA Author Manuscript
Figure 2. THZ1 Inhibits General Transcription and Cell Cycle Regulation in MYCN-amplified Tumor Models
(A) Immunoblot analysis of RNA Pol II CTD phosphorylation in MYCN-amplified and nonamplified NB cells treated with DMSO or THZ1 at the indicated concentrations for the indicated times.
(B) Immunoblot analysis of RNA Pol II CTD phosphorylation in human NB xenograft tumor cells obtained from mice treated with vehicle or THZ1 (10 mg/kg IV twice daily) for 12 days.
(C) Immunoblot analysis of MCL1 in MYCN-amplified (Kelly, NGP) vs. nonamplified (SK-N-FI, SH-SY5Y) NB cells following treatment with THZ1 at the indicated concentrations and durations.
(D) Immunoblot analysis of proteins involved in cell cycle progression in MYCN-amplified (Kelly, IMR-32) and nonamplified (SH-SY5Y) NB cells following treatment with THZ1 100 nM for 3 and 6 hr.
See also Figure S2
NIH-PA Author Manuscript
NIH-PA Author Manuscript
Figure 3. THZ1 Causes Massive Downregulation of Actively Transcribed Genes in MYCN-overexpressing NB Cells
(A) Heat map of gene expression values in MYCN-amplified and nonamplified cells treated with THZ1 (100 nM for 6 hr) vs. DMSO. Rows show z-scores calculated for each cell type. (B) Quartile box plots of log2 fold changes in gene expression in MYCN-amplified and nonamplified cells treated with DMSO or THZ1 at the same dose and duration as in (A). Box plot whiskers extend to 1.5 times the interquartile range (n=18,665 expressed genes, p<10−15 for Kelly vs. SH-SY5Y and IMR-32 vs. SH-SY5Y, two-sided Mann-Whitney U test).
(C) Venn diagram depicting the overlap between sets of differentially expressed transcripts (THZ1 vs. DMSO) in MYCN-amplified (Kelly, IMR-32) and nonamplified (SH-SY5Y) cells treated with THZ1 as in (A). Red represents upregulated and blue, downregulated
transcripts.
(D) Heat map of gene expression values of transcriptional and cell cycle CDKs in MYCN-amplified and nonMYCN-amplified cells treated with THZ1 as in (A) vs. DMSO. Rows show z-scores calculated for each cell type.
NIH-PA Author Manuscript
NIH-PA Author Manuscript
(E) Correlation between log2 fold changes in gene expression following THZ1 (100 nM) vs. DMSO treatment and actinomycin D (1 μM) vs. DMSO treatment for 6 hr. in MYCN-amplified NB cells. R2 (coefficient of determination) calculated using a simple linear
regression model. See also Figure S3.
NIH-PA Author Manuscript
NIH-PA Author Manuscript
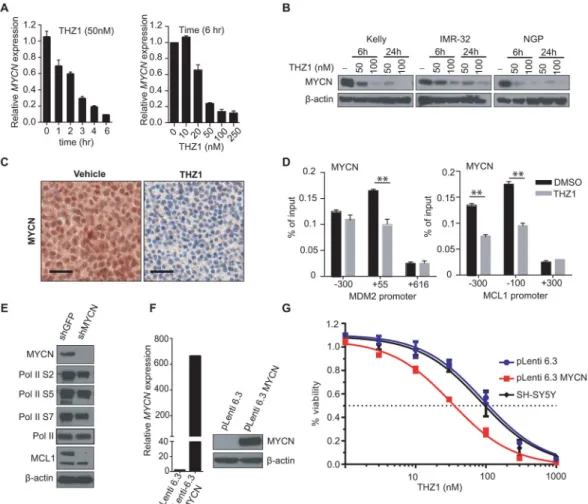
Figure 4. Cytotoxic Effects of THZ1 are Mediated in Part Through Inhibition of MYCN Expression
(A) Quantitative RT-PCR (qRT-PCR) analysis of MYCN RNA expression in MYCN-amplified Kelly cells treated with THZ1-50 nM for 0–6 hr (left) or 0–250 nM for 6 hr (right). Data normalized to β-actin are presented as mean ± SD of three biological replicates. (B) Immunoblot analysis of MYCN protein expression in MYCN-amplified NB cells treated with the indicated doses of THZ1 for 6 or 24 hr.
(C) IHC analysis of MYCN protein expression in MYCN-amplified human NB xenograft models treated with either DMSO or 10 mg/kg IV twice daily of THZ1 for 12 days. Scale bars, 25 μM.
(D) ChIP-qPCR analysis of MYCN binding at the promoters of candidate target genes in
MYCN-amplified cells following treatment with THZ1, 100 nM for 3 hr. Mean ± SD values
for three replicate experiments are shown. **p<0.01 (Student’s t-test).
(E) Immunoblot analysis of the indicated proteins in MYCN-amplified NB cells expressing either an shRNA control (shGFP) or an shRNA directed against MYCN (shMYCN). Two different hairpins against MYCN [shMYCN(1) and shMYCN(3)] were used with similar results.
(F) qRT-PCR analysis of MYCN expression in SH-SY5Y MYCN-nonamplified cells engineered to express either a control vector (pLenti 6.3) or MYCN (pLenti 6.3 MYCN (left panel). Immunoblot analysis of MYCN protein expression in these cells (right panel).
NIH-PA Author Manuscript
NIH-PA Author Manuscript
(G) Cell viability analysis of untransfected (SH-SY5Y), control vector-expressing (pLenti 6.3) or MYCN-expressing (pLenti 6.3 MYCN) MYCN-nonamplified NB cells treated for 72 hr with increasing doses of THZ1. Results are means ± SD of 3 replicates.
See also Figure S4.
NIH-PA Author Manuscript
NIH-PA Author Manuscript
Figure 5. THZ1 Inhibits MYCN-driven Transcriptional Amplification
(A) Box plot depicting the log2 fold changes in actively transcribed genes in MYCN-nonamplified SH-SY5Y cells transduced with MYCN (pLenti 6.3-MYCN) compared with a control vector (pLenti 6.3). Box plot whiskers extend to 1.5 times the interquartile range (n=18,665 expressed genes; p<2.2 × 10⁻¹⁶, two-sided Mann-Whitney U test).
(B) Heat map of all gene expression values in MYCN-nonamplified SY5Y cells vs. SH-SY5Y cells overexpressing MYCN (pLenti 6.3-MYCN) following either THZ1 (100 nM for 6 hr) or DMSO treatment. Rows show z-scores calculated for each vector.
(C) Immunoblot analysis of MYCN, CC3 and cleaved PARP in SH-SY5Y MYCN-nonamplified cells engineered to express either a control vector (pLenti 6.3) or MYCN (pLenti 6.3-MYCN) following treatment with THZ1.
NIH-PA Author Manuscript
NIH-PA Author Manuscript
(D) Heat map of differentially expressed genes in MYCN-amplified NB cells expressing a
MYCN shRNA vs. control shRNA. Rows show z-scores calculated for each vector.
(E) Box plots of log2 fold changes in gene expression in MYCN-amplified NB cells expressing a MYCN shRNA vs. a control shRNA. Box plot whiskers extend to 1.5 times the interquartile range (n=18,665 expressed genes; p<10−15 for shMYCN vs. shGFP, two-sided Mann-Whitney U test).
(F) GSEA plot depicting the correlation between the top 500 downregulated genes following THZ1 treatment and the rank-ordered genes that are differentially expressed after MYCN knockdown in MYCN-amplified NB cells.
See also Figure S5.
NIH-PA Author Manuscript
NIH-PA Author Manuscript
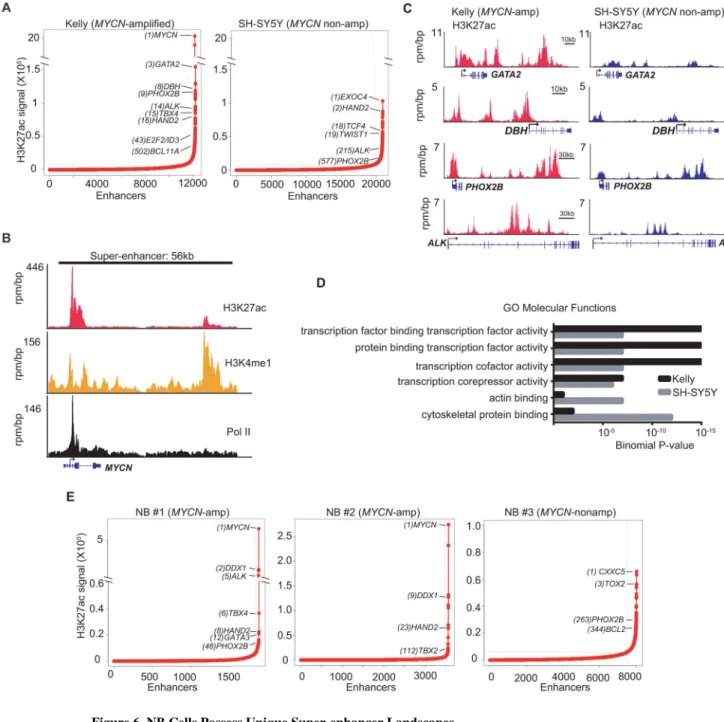
Figure 6. NB Cells Possess Unique Super-enhancer Landscapes
(A) H3K27ac signal across enhancer regions for all enhancers in MYCN-amplified and nonamplified cells. SEs were defined as enhancers surpassing the threshold signal of 8802 in both cell types. In Kelly and SH-SY5Y cells, 6.2% (746/12,000) and 5.4% (1136/20,887) of the enhancers comprised 52% and 37%, respectively of all H3K27ac-bound enhancer signal and were classed as SEs.
(B) ChIP-seq profiles for H3K27ac, H3K4me1 and RNA Pol II binding at the MYCN SE gene locus in Kelly cells. The x axis shows genomic position and the y axis the signal of histone mark or Pol II binding in units of reads per million per base pair (rpm/bp). The gene model is depicted below and scale bars above the binding profiles.
NIH-PA Author Manuscript
NIH-PA Author Manuscript
(C) ChIP-seq profiles for H3K27ac binding at representative SE-associated gene loci in
MYCN-amplified and nonamplified cells. The x and y axes are as described in (B).
(D) Gene Ontology (GO) categories of SE-associated genes in MYCN-amplified (Kelly) and nonamplified (SH-SY5Y) cells identified using GREAT analysis (McLean et al., 2010). (E) H3K27ac loading across enhancers in MYCN-amplified and nonamplified primary NB tumors. SEs were defined as having a threshold signal of ~5600 in the tumors. In NB#1 and NB#2, 8.5% (164/1,920) and 3.0% (109/3,561) and in NB#3, 6.4% (522/8,040) of the enhancers were classified as SEs.
See also Figure S6.
NIH-PA Author Manuscript
NIH-PA Author Manuscript
Figure 7. Sensitivity of MYCN-amplified Cells to THZ1 Correlates with MYCN-associated Super-enhancers
(A) Metagene representation of global Pol II ChIP-seq occupancy at SE- and RE-associated genes in cells with (Kelly) or without (SH-SY5Y) MYCN amplification treated with DMSO (blue) or THZ1 (red) (100 nM × 3 hr). TSS, transcription start sites.
(B) Gene tracks of RNA Pol II binding density at representative SE-associated gene loci after DMSO or THZ1 treatment as in (A).
(C) Left, quartile box plots of log2 fold changes in the top 300 genes associated with SEs and regular enhancers (RE) in MYCN-amplified cells treated with THZ1 (100 nM × 6 hr) vs.
NIH-PA Author Manuscript
NIH-PA Author Manuscript
DMSO. Box plot whiskers extend to 1.5 times the interquartile range (n=230 SE; n=231 RE; p<10−2, two-sided Mann-Whitney U test).
Right, quartile box plots of log2 fold changes in gene transcripts associated with the top-ranked SEs unique to MYCN-amplified Kelly cells treated with THZ1 as in (A) vs. DMSO, compared with the expression changes of the same genes in similarly treated SH-SY5Y nonamplified cells. Box plot whiskers extend to 1.5 times the interquartile range (n=673; p<10−16, two-sided Mann-Whitney U test).
(D) Proposed mechanism for the action of THZ1 in MYCN-amplified NB. Oncogenic MYCN is regulated by super-enhancers leading to its high-level expression (left). Overexpressed
MYCN invades the promoter and enhancer regions of all active genes, including itself, to
induce global transcriptional upregulation (right). THZ1 targets the expression of both
MYCN and MYCN-driven transcriptional amplification.