Automated Analysis of Musical Structure
Wei Chai
B.S. Computer Science, Peking University, China 1996 M.S. Computer Science, Peking University, China 1999
M.S. Media Arts and Sciences, MIT, 2001 Submitted to the Program in Media Arts and Sciences,
School of Architecture and Planning, in partial
fulfillment of the requirements for the degree of Doctor of Philosophy
at the
MASSACHUSETTS INSTITUTE OF TECHNOLOGY September, 2005
0 Massachusetts Institute of Technology 2005. All rights reserved.
A uthor ...
C ertified by ...
Accepted by...
Program in Media Arts and Sciences August 5, 2005
Barry L. Vercoe Prpfessor of Media Arts and Sciences Thesis Supervisor
Andrew B. Lippman Chairman, Departmental Committee on Graduate Students
OF TrCHNOLOGY
SEP 2 6 2005
LIBRARIES
Automated Analysis of Musical Structure
by Wei Chai Submitted to the Program in Media Arts and Sciences, School of Architecture and Planning, on August 5, 2005, in partial fulfillment of the requirements for the degree of Doctor of PhilosophyAbstract
Listening to music and perceiving its structure is a fairly easy task for humans, even for listeners without formal musical training. For example, we can notice changes of notes, chords and keys, though we might not be able to name them (segmentation based on tonality and harmonic
analysis); we can parse a musical piece into phrases or sections (segmentation based on recurrent structural analysis); we can identify and memorize the main themes or the catchiest parts - hooks -of a piece (summarization based on hook analysis); we can detect the most informative musical parts for making certain judgments (detection of salience for classification). However, building computational models to mimic these processes is a hard problem. Furthermore, the amount of digital music that has been generated and stored has already become unfathomable. How to efficiently store and retrieve the digital content is an important real-world problem.
This dissertation presents our research on automatic music segmentation, summarization and classification using a framework combining music cognition, machine leaming and signal processing. It will inquire scientifically into the nature of human perception of music, and offer a practical solution to difficult problems of machine intelligence for automatic musical content analysis and pattern discovery.
Specifically, for segmentation, an HMM-based approach will be used for key change and chord change detection; and a method for detecting the self-similarity property using approximate pattern matching will be presented for recurrent structural analysis. For summarization, we will investigate the locations where the catchiest parts of a musical piece normally appear and develop strategies for automatically generating music thumbnails based on this analysis. For musical salience detection, we will examine methods for weighting the importance of musical segments based on the confidence of classification. Two classification techniques and their definitions of confidence will be explored. The effectiveness of all our methods will be demonstrated by quantitative evaluations and/or human experiments on complex real-world musical stimuli.
Thesis supervisor: Barry L. Vercoe, D.M.A. Title: Professor of Media Arts and Sciences
Thesis Advisor t Barry Vercoe
Professor of Media Arts and Sciences Massachusetts Institute of Technology
Thesis Reader
1-4 N
Tod Machover Profes eorf Music and Media Massachusetts Institute of Technology
Thesis Committee
i /
Thesis Reader Rosalind Picard
Professor of Media Arts and Sciences Massachusetts Institute of Technology
Acknowledgements
I have been very lucky to work in the Music Mind and Machine Group of the Media Laboratory for the past six years. This allowed me to collaborate with many brilliant researchers and musicians. My period of graduate study at MIT has been one of the most challenging and memorable so far in my life. I am happy to have learned about many new technologies, new cultures, and especially the innovative ways people carry out research at MIT. This dissertation work was funded under MIT Media Laboratory Digital Life Consortium. I would like to thank everyone who has made my research fruitful and this dissertation possible.
I am indebted to my advisor, Professor Barry Vercoe. He is not only an excellent academic advisor, who always gave me his support to pursue my own interests and his valuable suggestions to inspire new ideas from me, but also a sophisticated mental advisor, who helped me a lot adapt to the culture completely new to me and plan my future career.
I would like to express my sincerest thanks to my committee members: Professor Roz Picard and Professor Tod Machover, for their thoughtful comments, criticism, and encouragement provided throughout the thesis writing process. Especially, it was my first class at MIT - Signal and Systems taught by Roz - that provided me with the fundamental concepts on audio signal processing and brought me into my research field.
Also, I am grateful for the encouragement, help and insight I have received from current and past members of the Music Mind and Machine Group - Victor Adan, Judy Brown, Ricardo Garcia, John Harrison, Tamara Hearn, Youngmoo Kim, Nyssim Lefford, Elizabeth Marzloff, Joe Pompei, Rebecca Reich, Connie Van Rheenen, Eric Scheirer, Paris Smaragdis, and Kristie Thompson. I have had the great fortune of working with these brilliant and talented people. I especially thank my officemate, Brian Whitman -one of the most insightful researchers in my field and the most warmhearted person who always gave me great help and suggestions.
I have been assisted and influenced by many other members of the Media Lab community. In particular, I thank Yuan Qi, who gave me his code for Pred-ARD-EP and many good suggestions, and Aggelos Bletsas, who had interesting discussions with me on probability.
Special thanks to my friends at MIT: Hong He, Wenchao Sheng, Yunpeng Yin, Rensheng Deng, Minggang She, who gave me endless help and made my life at MIT enjoyable.
Table of Contents
Chapter 1 Introduction...13
1.1 Contributions... ... 14
1.2 O verview and Organizations... 15
Chapter 2 Background ... ... 17
2.1 M usical Structure and M eaning... 17
2.2 Musical Signal Processing ... ... 18
2.2.1 Pitch Tracking and Autom atic Transcription ... 18
2.2.2 Tem po and Beat Tracking... 18
2.2.3 Representations of M usical Signals ... 18
2.2.4 M usic M atching ... 19
2.3 M usic Inform ation Retrieval ... 19
2.3.1 M usic Searching and Query by Exam ples ... 19
2.3.2 M usic Classification... 20
2.3.3 M usic Segm entation and Sum marization... 20
Chapter 3 Tonality and H arm ony Analysis ... 21
3.1 Chromagram - A Representation for Musical Signals... 21
3.2 Detection of K ey Change... 23
3.2.1 M usical Key and M odulation... 23
3.2.2 Hidden M arkov M odels for Key Detection... 24
3.3 Detection of Chord Progression... 27
3.4 Evaluation M ethod ... 28
3.5 Experim ents and Results... 30
3.5.1 Performance of Key Detection... 30
3.5.2 Perform ance of Chord Detection ... 34
3.6 Discussion ... 35
3.7 Sum m ary ... 37
Chapter 4 M usical Form and Recurrent Structure... 39
4.1 M usical Form ... 39
4.2 Representations for Self-sim ilarity Analysis ... 40
4.2.1 Distance M atrix... 40
4.2.2 Two Variations to Distance M atrix... 41
4.3 Dynamic Time Warping for Music Matching ... 42
4.4 Recurrent Structure Analysis... 44
4.4.1 Identification of Form Given Segm entation... 44
4.4.2 Recurrent Structural Analysis without Prior Knowledge... 45
4.5 Evaluation M ethod ... 51
4.6 Experim ents and Results... 51
4.6.1 Perform ance: Identification of Form Given Segm entation ... 51
4.6.2 Performance: Recurrent Structural Analysis without Prior Knowledge ... 52
4.8 Generation and Comparison of Hierarchical Structures... 57
4.8.1 Tree-structured Representation... 58
4.8.2 Roll-up Process... 58
4.8.3 Drill-down Process ... 59
4.8.4 Evaluation Based on Hierarchical Structure Sim ilarity ... 59
4.9 Sum m ary ... 62
Chapter 5 Structural Accentuation and Music Summarization ... 63
5.1 Structural Accentuation of M usic ... 63
5.2 Music Summarization via Structural Analysis ... 64
5.2.1 Section-beginning Strategy (SBS)... 65
5.2.2 Section-transition Strategy (STS) ... 65
5.3 H um an Experim ent... 66
5.3.1 Experim ental Design... 66
5.3.2 Subjects... 68
5.3.3 O bservations and Results... 69
5.4 O bjective Evaluation... 73
5.5 Sum m ary ... 73
Chapter 6 M usical Salience for Classification... 75
6.1 M usical Salience... 75
6.2 Discriminative Models and Confidence Measures for Music Classification ... 75
6.2.1 Fram ework of M usic Classification... 75
6.2.2 Classifiers and Confidence M easures ... 77
6.2.3. Features and Param eters ... 78
6.3 Experiment 1: Genre Classification of Noisy Musical Signals... 78
6.4 Experiment 2: Gender Classification of Singing Voice ... 82
6.5 Discussion... 85
6.6 Sum m ary ... 86
Chapter 7 Conclusions ... 87
7.1 Reflections ... 87
7.2 Directions for Future Research ... 89
7.3 Concluding Rem arks... 89
Appendix A ... 91
Bibliography ... 93
List of Figures
Figure 1-1: Overview of the dissertation ... 15
Figure 3-1: Scatterplot of (odd "ev,,) (left) and the Gaussian probability density estimation of r,,,,,I d (right) for classical piano music and Beatles songs. ... 22
Figure 3-2: Demonstration of Hidden Markov Models... 24
Figure 3-3: Comparison of observation distributions of Gaussian and cosine distance. ... 26
Figure 3-4: Configuration of the template for C major (or A minor). ... 26
Figure 3-5: Configurations of templates -
01
od (trained template and empirical template)... 27Figure 3-6: An example for measuring segmentation performance . ... 29
Figure 3-7: Detection of key change in "Mozart: Sonata No. 11 In A 'Rondo All Turca' ... 30
Figure 3-8: Performance of key detection with varying stayprob (w=10) ... 32
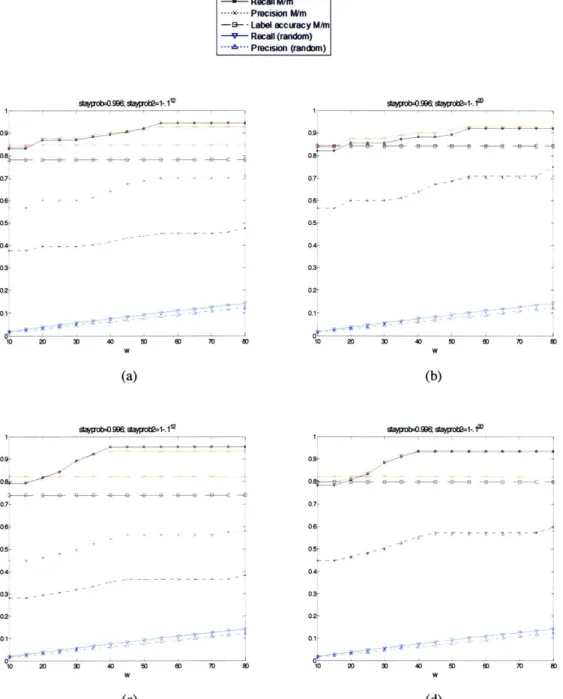
Figure 3-9: Performance of key detection with varying w (stayprob=0.996) ... 33
Figure 3-10: Chord detection of "Mozart: Sonata No. 11 In A 'Rondo All Turca'"... 34
Figure 3-11: Performance of chord detection with varying stayprob (w=2). ... 35
Figure 3-12: Performance of chord detection with varying w (stayprob=0.85). ... 35
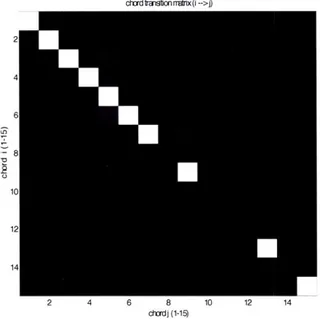
Figure 3-13: Chord transition matrix based on the data set in the experiment. ... 36
Figure 3-14: Confusion matrix (left: key detection; right: chord detection)... 36
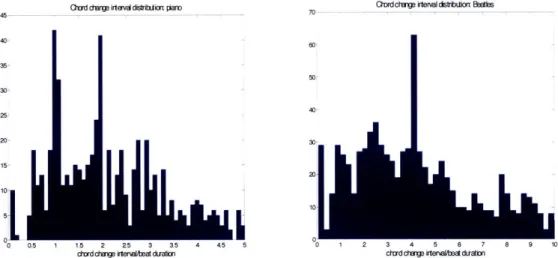
Figure 3-15: Distribution of chord change interval divided by beat duration ... 37
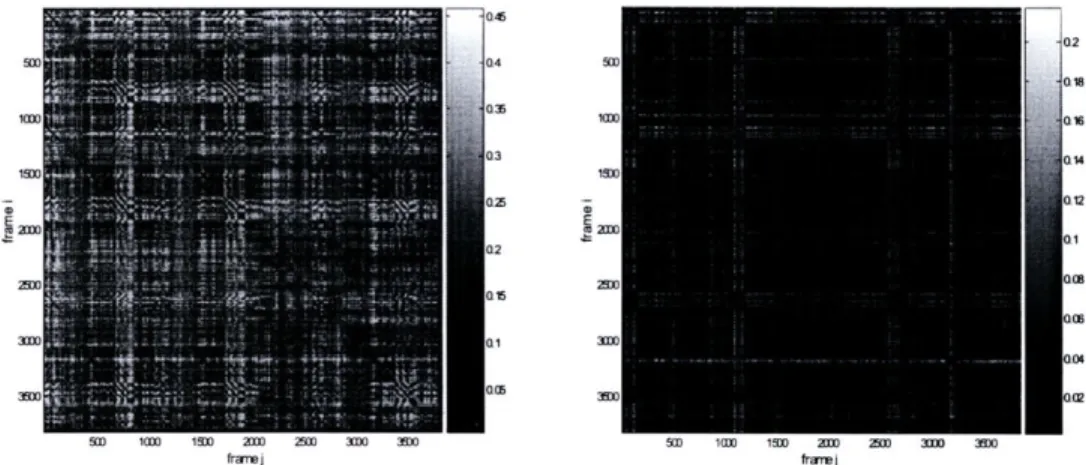
Figure 4-1: Distance matrix of "Mozart: Piano Sonata No. 15 In C... 41
Figure 4-2: Two variations to the distance matrix of "Mozart: Piano Sonata No. 15 In C" ... 42
Figure 4-3: Zoom in of the last repetition in "Mozart: Piano Sonata No. 15 In C" ... 42
Figure 4-4: Dynamic time warping matrix WM with initial setting. e is a pre-defined parameter denoting the deletion cost. ... 43
Figure 4-5: An example of the dynamic time warping matrix WM, the matching function r[i] and the trace-back function t[i]... 44
Figure 4-6: Analysis of recurrent structure without prior knowledge. ... 46
Figure 4-7: One-segment repetition detection result of Beatles song Yesterday. The local minima indicated by circles correspond to detected repetitions of the segment. ... 47
Figure 4-8: Whole-song repetition detection result of Beatles song Yesterday. A circle or a square at location (j, k) indicates that the segment starting from vj is detected to repeat from vjk... 48
Figure 4-9: Idealized whole-song repetition detection results ... 49
Figure 4-10: Different structure labeling results corresponding to different orders of processing section-repetition vectors in each loop... ... ... 50
Figure 4-11: Comparison of the computed structure using DM (above) and the true structure (below) of Yesterday. Sections in the same color indicate restatements of the section. Sections in the lightest gray correspond to the parts with no repetition... 51
Figure 4-12: Formal distance using hierarchical and K-means clustering given segmentation ... 52
Figure 4-13: Segmentation performance of recurrent structural analysis on classical piano music ... 53
Figure 4-14: Segmentation performance of recurrent structural analysis on Beatles songs... 53
Figure 4-15: Segmentation performance and formal distance of each piano piece (w=40) ... 54
Figure 4-16: Segmentation performance and formal distance of each Beatles song (w=40) . ... 55
Figure 4-17: Comparison of the computed structure (above) and the true structure (below) ... 55
Figure 4-18: Comparison of the computed structure (above) and the true structure (below)... 56
Figure 4-19: Comparison of the computed structure (above) and the true structure (below) of the 25th Beatles song Eleanor Rigby using DM ... 57
Figure 4-20: Comparison of the computed structure (above) and the true structure (below) of the 14th Beatles song H elp! using D M ... 57
Figure 4-22: Two possible solutions of the roll-up process (from bottom to top) for song Yesterday...59
Figure 4-23: An example with both splits and merges involved ... 60
Figure 4-24: Segmentation performance of recurrent structural analysis based on hierarchical similarity for classical piano music ... 61
Figure 4-25: Segmentation performance of recurrent structural analysis based on hierarchical similarity for B eatles songs...62
Figure 5-1: Section-beginning strategy. ... 65
Figure 5-2: Section-transition strategy ... 65
Figure 5-3: Instruction page...67
Figure 5-4: Subject registration page. ... 67
Figure 5-5: Thumbnail rating page...68
Figure 5-6: Hook marking page. ... 68
Figure 5-7: Profile of sample size . ... 69
Figure 5-8: Average ratings of the five summarizations ... 70
Figure 5-9: Hook marking result ... 71
Figure 5-10: Hook marking result with structural folding ... 72
Figure 6-1: Distribution of added noise ... 79
Figure 6-2: Accuracy of genre classification with noise o- =
O
... . ... .. ... .. ... ... ... .. ... . . 80Figure 6-3: Accuracy of genre classification with noise a = 0.1 - qO ... 80
Figure 6-4: Index distribution of selected frames at selection rate 50%, a = -o ... 81
Figure 6-5: Index distribution of selected frames at selection rate 50%,
a
= 0.1 - qO ... 81Figure 6-6: Accuracy of gender classification of singing voice ... 82
Figure 6-7: Amplitude distribution of selected frames at selection rate 55% ... 83
Figure 6-8: Pitch distribution of selected frames at selection rate 55% ... 84
Figure 6-9: Difference of pitch vs amplitude distribution between selected frames and unselected frames at selection rate 55% ... 85
Chapter 1 Introduction
Listening to music and perceiving its structure is a fairly easy task for humans, even for listeners without formal musical training. For example, we can notice changes of notes, chords and keys, though we might not be able to name them (tonality and harmonic analysis); we can parse a musical piece into phrases or sections (recurrent structural analysis); we can identify and memorize main themes or hooks of a piece (summarization); we can detect the most informative
musical parts for making certain judgments (detection of salience for classification). However,
building computational models to mimic this process is a hard problem. Furthermore, the amount of digital music that has been generated and stored has already become unfathomable. How to efficiently store and retrieve the digital content is an important real-world problem.
This dissertation presents our research on automatic music segmentation, summarization and classification using the framework combining music cognition, machine learning and signal processing. It will inquire scientifically into the nature of human perception of music, and offer a practical solution to difficult problems of machine intelligence for automatic musical content analysis and pattern discovery.
In particular, the computational models will automate the analysis of the following: What is the progression of chords and keys underlying the surface of notes? What is the recurrent structure of a piece? What are the repetitive properties of music at different levels, which are organized in a hierarchical way? What is the relation between the musical parts and the whole? Which parts are most "informative" for the listeners to make judgments? What are the most "representative" parts that make the piece unique or memorable?
Solutions to these problems should benefit intelligent music editing systems and music information retrieval systems for indexing, locating and searching for music. For example, consider the following scenarios: A system can segment a musical recording phrase-by-phrase or section-by-section and present the result for users to quickly locate the part they are interested in; A system can analyze the tonality, harmony and form of a musical piece for musical instruction; A system can generate a twenty-second thumbnail of a musical piece and present it to the customers for them to decide whether they would like to buy the whole piece; A system can identify the characteristics of an artist by "hearing" a collection of his works and comparing them to works by other artists for aesthetic analysis or copyright protection. These are some of the scenarios in which our proposed models can be employed.
The topics are also closely related to music understanding, human mental representations of music, musical memory, and the attentive listening process. Successful computational models to mimic the perception of musical structure will contribute to the study of music understanding and cognition.
First, music inherently contains large amounts of structure. Perception and analysis of structure is essential for understanding music. Some of the tasks addressed in this dissertation are very similar to the tasks in natural language understanding, where the semantic meaning of language is supported by a hierarchically organized structure based on words, phrases, sentences, paragraphs; and some key points typically need to be emphasized by being repeated and put at some structurally accentuated locations.
Second, it is still unclear why some music or part of music is more memorable than another. It should not be coincident that almost all genres of music in the world have some kind of repetitions. One explanation is the close relationship between poetry and music: music is a way of adding more dimensions to poems though variations of pitches and time, while poems have repetitions. But still it does not explain why repetition is so important for these forms of art. Our hypothesis is that repetition adds more redundancy of information, which can reduce the
processing of human brain and relieve some mental resources for other aesthetic purposes. That probably is in part what allows music to make humans more emotionally involved and immersed. Third, this dissertation is, to some extent, all about the relation between part and whole. It will talk about various kinds of segmentations, based on key changes, chord changes, repetitions, representativeness of phrases, and categorical salience of phrases, etc., since only when we can chunk the whole into parts and look closely into their relations, we can really understand how music works.
Fourth, similarity is an important concept in cognition. "We live by comparisons, similarities and dissimilarities, equivalences and differences." (R. D. Laing) Making judgment of difference or similarity by comparison is our primary way of learning. This dissertation is also related to musical similarity. Various models of musical similarity have been employed for different purposes, including geometric models, alignment-based models, statistical models, and multidimensional scaling. This is reasonable, since the famous Ugly Duckling Theorem reveals that "there is no problem-independent or privileged or 'best' set of features or feature attributes; even the apparently simple notion of similarity between patterns is fundamentally based on implicit assumptions about the problem domain." (Duda, 2001) The human mind is quite good at combining different models for comparing things.
1.1 Contributions
The main contribution of this dissertation is two-fold: a set of algorithms and techniques for real-world problems in building intelligent music systems; findings and hints we can obtain for the
study of human perception of musical structure and meaning.
This dissertation proposes a novel framework for music segmentation. First, a Hidden Markov Model based method is employed for detecting key or chord changes as well as identifying keys or chords. This is different from most previous approaches that attempted to do key or chord detection without considering segmentation. Additionally, some but a limited amount of prior musical knowledge is incorporated in the system to solve the problem due to lack of enough training data.
Second, a Dynamic Time Warping based method is proposed for detecting the recurrent structure and self-similarity of music and parsing a piece into sections. This is probably the first attempt of building a system to give the overall formal structure of music from acoustic signals; previous research typically tried to find only the most repeated patterns. The ultimate goal of this research would be to derive the hierarchical structure of music, which is also addressed in the dissertation. Comprehensive metrics for evaluating music segmentation are proposed, while most previous research had only one or two examples for demonstrating the promise of their methods rather than quantitative evaluations.
Besides segmentation, a novel method for music summarization based on the recurrent structural analysis is proposed. An online human experiment is conducted to set up the ground truth for music summarization. The results are used in this dissertation to develop strategies for summarization and can be used in the future for further investigation of the problem.
Finally, this dissertation proposes a new problem - musical salience for classification - and corresponding methods that detect the most "informative" part of music for making certain judgments. What "informative" means really depends on the tasks - listeners pay attention to different parts of music depending on what kind of information they want to obtain during the listening process. We explore how musical parts are weighted differently for different classification tasks and whether the weighting is consistent with human intuition.
In general, our approach has been applying psychoacoustic and music cognition principles as bases, and employing musical signal processing and machine learning techniques as front-end tools for developing representations and algorithms to mimic various aspects of human music listening process. We also focus on listeners without professional training. This implies that "real" musical signals will be the main stimuli in the structural analysis studies and only a limited amount of prior musical knowledge will be employed in the processing.
1.2 Overview and Organizations
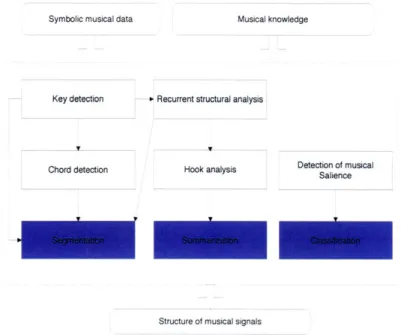
This dissertation consists of four correlated components for automated analysis of musical structure from acoustic signals: tonality analysis, recurrent structural analysis, hook analysis and salience analysis, mainly for three types of applications - segmentation, summarization and classification. Only a limited amount of prior musical knowledge and patterns extracted from symbolic musical data (i.e., musical scores) will be employed to help build models - either statistical models such as Hidden Markov Models for key/chord detection and discriminative models for classification, or rule-based models such as approximate pattern matching for self-similarity analysis and structural accentuation for thumbnailing. Figure 1-1 shows an overview of the dissertation.
Symbolic musical data Musical knowledge
Key detection * Recurrent structural analysis
Chord detection Hook analysis Dete ncoer cmusica
Structure of musical signals
Figure 1-1: Overview of the dissertation.
Accordingly, the remainder of this dissertation is organized along the following chapters: Chapter 2 provides background material of our research, highlighting other studies that we consider most relevant to our goals within the fields of music cognition, musical signal processing, and music information retrieval systems.
In Chapter 3, we describe the system used for tonality and harmonic analysis of music using a probabilistic Hidden Markov Model. It can detect key changes or chord changes with a limited amount of prior musical knowledge. Evaluation methods for music segmentation are also proposed in this chapter.
Chapter 4 presents the system used to detect the recurrent structure of music using dynamic time warping and techniques for self-similarity analysis. It can parse a musical piece into sections and detect the form of it.
Based on the result from chapter 4, chapter 5 proposes strategies for music summarization. An online human experiment is conducted to investigate various problems involved in music summarization and set up a ground truth for developing and evaluating different summarization strategies.
Chapter 6 is related to a problem called musical salience for classification. We describe the problem, present our approach, and demonstrate our theory by experimental results.
We conclude with Chapter 7, in which we evaluate the potential of the framework and discuss some of the system's inherent limitations. We also suggest potential improvements to the framework as well as some general directions for future research.
Additionally, this dissertation with all the sound examples and data sets is online at http://web.media.mit.edu/-chaiwei/thesisWeb/.
Chapter 2 Background
We begin with a short explanation of musical structure emphasizing the music cognition perspective. Following that, we briefly summarize previous and current research on musical signal processing and music information retrieval systems, providing relevant techniques and application contexts related to this dissertation.
2.1 Musical Structure and Meaning
Music inherently contains large amounts of structure. For example, melodic structure and chord structure emphasize the pitch relation between simultaneous or sequential components; formal structure and rhythmic structure emphasize the temporal relation between musical segments. The relation between "surface structure" and "deep structure" of music has also been analyzed (Deliege, 1996). Although it is not clear why humans need music, theories have suggested that hearing the structure of music plays an important role in satisfying this need.
Most adults have some childlike fascination for making and arranging larger structures out of smaller ones. One kind of musical understanding involves building large mental structures out of smaller, musical parts. Perhaps the drive to build those mental music structures is the same one that makes us try to understand the world. (Minsky, 1989)
Thus, music is, in a sense, a mental game for humans, in which we learn to perceive and construct complex structures, especially temporal structures. The music listening process is the one in which we analyze, understand and memorize the musical structure.
One of the primary ways in which both musicians and non-musicians understand music is through the perception of musical structure. This term refers to the understanding received by a listener that a piece of music is not static, but evolves and changes over time. Perception of musical structure is deeply interwoven with memory for music and music understanding at the highest levels, yet it is not clear what features are used to convey structure in the acoustic signal or what representations are used to maintain it mentally. (Scheirer, 1998)
In general, perception and analysis of structure is essential for understanding meanings of things. Minsky (1989) stated that "a thing has meaning only after we have learned some ways to represent and process what it means, or to understand its parts and how they are put together." In natural languages, the syntax of an expression forms a structure, on which meaning is superimposed. Music is also organized in a way through which musicians convey certain meanings and listeners can perceive them, though, unlike natural languages, the meaning of music is more subjective, auto-referential and not easily describable in words. Music has a more direct connection to human emotion than a natural language does; and musical structure is the carrier of the emotional meaning and the expressive power of music. It is the articulate form of music (perceived via various surface cues such as tempo, dynamics, texture) that makes musical sound vivid, expressive and meaningful.
Analysis of musical structure is a fairly broad topic. Our research will focus on building computational models for automating the analysis of the sequential grouping structure of music, including parsing music into parts at various levels, extracting recurrent patterns, exploring the relation between musical parts, and finding the most informative or representative musical parts based on different tasks. In addition, tonality and harmonic structure will also be addressed in the dissertation. Other important aspects related to musical structure, such as metrical structure, melodic structure, sound texture/simultaneous grouping, and emotional meanings of music, will not be the main concerns in the dissertation.
2.2 Musical Signal Processing
2.2.1 Pitch Tracking and Automatic Transcription
Pitch is a perceptual concept, though in normal context monophonic pitch tracking means finding the fundamental frequency (
fo)
of the acoustic signal. The monophonic pitch tracking algorithms can be divided into three categories (Rabiner, 1976) (Roads, 1994):Time domain algorithms, which operate directly on the waveform to estimate the pitch period. Classical algorithms include zero-crossing periodicity detector, peak periodicity detector, autocorrelation pitch detector, etc.
Frequency domain algorithms, which use the property that if the signal is periodic in the time domain, then the frequency spectrum of the signal will consist of a series of impulses at the fundamental frequency and its harmonics. Classical algorithms include Short Time Fourier Transform (STFT) based pitch detector, adaptive filter pitch detector, tracking phase vocoder analysis, cepstrum analysis, etc.
Time- andfrequency-domain algorithms, which incorporate features of both the time-domain and the frequency-domain approaches to pitch tracking. For example, a hybrid pitch tracker might use frequency-domain techniques to provide a spectrally flattened time waveform, and then use autocorrelation measurements to estimate the pitch period.
Automatic transcription, which attempts to transcribe acoustic musical signals into score-based representations, involves polyphonic pitch tracking and harmonic analysis. Although the whole problem is not completely solved, several algorithms for multiple-pitch estimation have been proposed (Jbira, 2000) (Klapuri, 2000) (Sterian, 2000).
2.2.2 Tempo and Beat Tracking
Tempo and beat tracking from acoustic musical signals is very important for musical analysis. Goto (2001) attempted to infer the hierarchical beat structure of music based on the onset times of notes, chord changes and drum patterns. Laroche (2001) did transient analysis on the musical signal first and then used a probabilistic model to find the most likely tempo and beat locations. Scheirer (1998) employed comb filters to detect the periodicities in each frequency range and combined the results to infer the beats.
2.2.3 Representations of Musical Signals
Various representations have been proposed for musical signals. The time-domain representation (waveform) and frequency-domain (STFT or spectrogram) representation are the very basic and most widely used ones. Some variations to spectrogram split the frequency range unevenly. For example, constant-Q and cochlear filter bank are designed for simulating the human auditory system. Chromagram is specifically employed for musical signals; it combines the frequency components belonging to the same pitch class and results in a 12-dimensional representation (corresponding to C, C#, D, D#, E, F, F#, G, G#, A, A#, B). Autocorrelogram allows simultaneous representation of pitch and spectral shape for multiple harmonic sounds.
For musical signals, the result of automatic transcription, such as pitch or beat estimation sequence, can serve as a mid-level representation. Foote (1999, 2000) proposed a representation called similarity matrix for visualizing and analyzing the structure of music. Each cell in the matrix denotes the similarity between a pair of frames in the musical signal.
Finally, many timbre-related features have been proposed for analyzing musical or instrumental sounds (Martin, 1999), such as spectral centroid, spectral irregularity, pitch range, centroid modulation, relative onset time of partial frequencies, etc.
2.2.4 Music Matching
Many music applications, such as query-by-humming and audio fingerprinting, need to align two musical sequences (either in symbolic or in acoustic format). To tolerate the time flexibility of music, dynamic time warping and hidden Markov models are widely used for aligning speech signals as well as musical signals. Other methods attempted to take rhythm into account in the alignment (Chai, 2001) (Yang, 2001).
2.3 Music Information Retrieval
With the emergence of digital music on the Internet, automating access to music information through the use of computers has intrigued music fans, librarians, computer scientists, information scientists, engineers, musicologists, cognitive scientists, music psychologists, business managers and so on. However, current methods and techniques for building real-world music information retrieval systems are far from satisfactory.
The dilemma was pointed out by Huron (2000). Music librarians and cataloguers have traditionally created indexes that allow users to access musical works using standard reference information, such as the name of the composer and the title of the work. While this basic information remains important, these standard reference tags have surprisingly limited applicability in most music-related queries.
Music is used for an extraordinary variety of purposes: the military commander seeks music that can motivate the soldiers; the restaurateur seeks music that targets certain clientele; the aerobics instructor seeks music of a certain tempo; the film director seeks music conveying a certain mood; an advertiser seeks a tune that is highly memorable; the physiotherapist seeks music that helps provide emotional regulation to a patient; the truck driver seeks music that will keep him alert; the music lover seeks music that can entertain him. Although there are many other uses for music, music's preeminent functions are social, emotional and psychological. The most useful retrieval methods are those that can facilitate searching according to such social, emotional and psychological functions. In fact, an international standard called MPEG7 has been proposed to standardize the metadata for multimedia content and make the retrieval methods more effective. This section summarizes the status of current research in the field of music information retrieval. 2.3.1 Music Searching and Query by Examples
Music information retrieval systems help provide the users a way to search for music based on its content rather than the reference information. In other words, the system should be able to judge what is similar to the presented query. Retrieving audio based on timbre similarity was studied by Wold (1996), Foote (1999) and Aucouturier (2002). For music, some systems attempted to search for symbolic music based on a hummed tune, called Query-by-humming systems (Ghias, 1995; McNab, 1996; Chai, 2001). Some other systems were developed to retrieve musical recordings based on MIDI data (Shalev-Shwartz, 2002), or based on a short clip of a musical recording (Yang, 2001; Haitsma, 2001). Various audio matching techniques were applied to these systems. In addition, there were studies on query-by-rhythm systems (Foote, 2002). Systems that attempt to combine various aspects of musical similarity for retrieval have also been built. The Cuidado Music Browser (Pachet, 2004) is such a system that can extract the editorial and acoustic metadata from musical signals and retrieve the musical content based on acoustic and cultural similarities.
2.3.2 Music Classification
Music classification is another popular topic in the field of music information retrieval. Some of the research used symbolic data. For example, Dannenberg (1997) presented his work for performance style classification using MIDI data. Chai (2001) conducted an experiment of classifying folk music from different countries based on melodic information using hidden Markov models (HMMs).
The acoustic musical signals were directly used for classification as well. One typical method is to segment the musical signal into frames, classify each frame using various features (e.g., FFT, MFCC, LPC, perceptual filterbank) and different machine learning techniques (e.g., Support Vector Machines, Gaussian Mixture Models, k-NN, TreeQ, Neural Networks), and then assign the piece to the class to which most of the frames belong. This technique works fairly well for timbre-related classifications. Pye (2000) and Tzanetakis (2002) studied genre classification. Whitman (2001), Berenzweig (2001, 2002) and Kim (2002) investigated artist/singer classification. In addition to this frame-based classification framework, some other research on music classification attempted to use features of the whole musical piece for emotion detection (Liu, 2003), or use models capturing the dynamic of the piece (Explicit Time Modelling with Neural Network and Hidden Markov Models) for genre classification (Soltau, 1998).
2.3.3 Music Segmentation and Summarization
Music summarization (or music thumbnailing) aims at finding the most representative part, often assumed to be the most frequently repeated section, of a musical piece. Pop/rock music was often used for investigating this problem. Some research (Hsu, 2001) on music thumbnailing dealt with symbolic musical data (e.g., MIDI files and scores). There have also been studies on thumbnailing of acoustic musical signals. Logan (2000) attempted to use a clustering technique or Hidden Markov Models to find key phrases of songs. Bartsch (2001) used the similarity matrix and chroma-based features for music thumbnailing. A variation of the similarity matrix was also proposed for music thumbnailing (Peeters, 2002).
Dannenberg (2002) presented a method to automatically detect the repeated patterns of musical signals. The process consists of searching for similar segments in a musical piece, forming clusters of similar segments, and explaining the musical structure in terms of these clusters. Although the promise of this method was demonstrated by several examples, there was no quantitative evaluation of the method in their paper. Furthermore, it could only give the repeated patterns rather than an overall formal structure of the piece or a semantic segmentation.
A topic closely related to music thumbnailing is music segmentation. Most previous research in this area attempted to segment musical pieces by detecting the locations where significant changes of statistical properties occur (Aucouturier, 2001). This method is more appropriate for segmenting local events rather than segmenting the semantic components within the global structure.
Chapter 3 Tonality and Harmony Analysis
Tonality is an important aspect of musical structure. It describes the relationships between the elements of melody and harmony -tones, intervals, chords, and scales -to give the listeners the sense of tonal center. The tonality of music has also been proven to have an impact on the listener's emotional response of music. Furthermore, chords are important harmonic building blocks of tonality. Much literature attempts to analyze the musical structure in terms of chords and chord progression in a way similar to analyzing semantic structure of language in terms of words and grammar.
From the practical perspective, tonality and harmony analysis is a critical step for semantic segmentation of music and detection of repeated patterns in music (shown in Chapter 4), which are important for intelligent music editing, indexing and searching. Therefore, this chapter presents an HMM-based generative model for automatic analysis of tonality and harmonic structure of music.
3.1 Chromagram
-
A Representation for Musical Signals
The chromagram, also called the Pitch Class Profile features (PCP), is a frame-based representation of audio, very similar to Short-time Fourier Transform (STFT). It combines the frequency components in STFT belonging to the same pitch class (i.e., octave folding) and results in a 12-dimensional representation, corresponding to C, C#, D, D#, E, F, F#, G, G#, A, A#, B in music, or a generalized version of 24-dimensional representation for higher resolution and better control of noise floor. (Sheh, 2003)
Specifically, for the 24-dimensional representation, let XSTFT [K,n] denote the magnitude spectrogram of signal x[n], where 0 K NFFT - 1 is the frequency index, NFFT is the FFT length. The chromagram of x[n] is
XPCPKn] XSTFT[K,n] (3-1)
K: P(K)=K
The spectral warping between frequency index K in STFT and frequency index K in PCP is P(K) = [24-log,( K / NFFT -
f,
Ifl)]
mod 24 (3-2) wheref,
is the sampling rate,f
1 is the reference frequency corresponding to a note in the standard tuning system, for example, MIDI note C3 (32.7Hz),.In the following, we will use the 24-dimensional PCP representation. To investigate some properties of the 24-dimensional PCP representation X P[K,n] (K=1, ... , 24; n=1, ... , N) of a musical signal of N frames, let us denote
M[Kn] = 1,if XPCP[K,n]>= XPCP[K-1,n] and XCP[K,n] >= XPCP[K+ 1,n] (3-3)
0, otherwise.
where we define XP,[0,n] = XPCP[24,n] and XPCP[25,n] = XPCP[l,n] for the boundary conditions. Thus, m[K,n] is a binary matrix denoting whether the magnitude at a particular frequency in the PCP representation is the local maximum comparing to magnitudes at its two
neighboring frequencies. We then can count the number of local maxima appearing at the odd frequency indexes or appearing at the even frequency indexes, and compare them:
'odd= 1Z Xm[K,n] (3-4) 24-N n=1 K is odd 1ee i N, 2,,,, > m[K,n] (3-5) 24 -Nn=1 K is even even/odd = 'even (3-6) odd
If all the instruments in a musical piece are well tuned (tones are strongly pitched and the pitches match the twelve pitch classes perfectly) and the energy of each tone concentrates on its fundamental frequency (f0), we can easily conclude that 'odd 'even and reven/ odd - 0.
However, if the instruments are not well tuned, or some instruments are not strongly pitched (e.g., drum, some fricatives in vocal), or the harmonics of tones are strong (f, , f2, etc), then
ee lodd and r --+ I (It would be rare that ',v,, gets bigger than lodd ). This property can
'even odd e t levenIod
be related to the musical genre. To show this, lodd, leven and revenlodd were computed for 21
classical piano pieces and 26 Beatles songs (Appendix A), respectively, and their distributions are plotted in Figure 3-1. The left plot shows the distribution of ( 'odd ,lee,), in which each point
corresponds to a musical piece. The right plot shows the Gaussian probability density estimation of reven /odd .The result is consistent with the above analysis.
a25 5 02- 4-015 3 01 2 0 0 05 Q1 Q15 02 0.25 03 0.5 0 Q5 1 1.5 2 25 od ienrledd
aac~ o-a aseco pwnu
Badesssmgs Bdes ssgs
Figure 3-1: Scatterplot of (',dd, een) (left) and the Gaussian probability density estimation
of r,e/ odd (right) for classical piano music and Beatles songs.
In the following thesis (except Chapter 6), we will focus on the chromagram representation for further analysis of musical structure, simply because of its advantage of direct mapping to musical notes. It doesn't mean it is best for all types of applications or all musical genres. In some comparisons between different representations for music structural analysis tasks (Chai, 2003), it was shown that no representation is significantly better for all musical data. Therefore, we will
focus on one representation in this dissertation; all the following approaches can be generalized fairly easily using other representations.
3.2 Detection of Key Change
This section describes an algorithm for detecting the key (or keys) of a musical piece. Specifically, given a musical piece (or part of it), the system will segment it into sections based on key change and identify the key of each section. Note that here we want to segment the piece and identify the key of each segment at the same time. A simpler task could be: given a segment of a particular key, detect the key of it.
3.2.1 Musical Key and Modulation
In Music theory, the key is the tonal center of a piece. It is designated by a note name (the tonic), such as C, and can be either in major or minor mode. Other modes are also possible. The major mode has steps between scale steps 3 and 4, and 7 and 8. The natural minor mode has half-steps between 2 and 3, and 5 and 6.
A scale is an ascending or descending series of notes or pitches The chromatic scale is a musical scale that contains all twelve pitches of the Western tempered scale. The diatonic scale is most familiar as the major scale or the "natural" minor scale. The diatonic scale is a very important scale. Out of all the possible seven note scales it has the highest number of consonant intervals, and the greatest number of major and minor triads. The diatonic scale has six major or minor triads, while all of the remaining prime scales (the harmonic minor, the harmonic major, the melodic and the double harmonic) have just four major or minor triads. The diatonic scale is the only seven note scale that has just one tritone (augmented fourth/diminished fifth). All other scales have two, or more, tritones. In the following, we will often assume diatonic scales where it is necessary.
A piece may change key at some point. This is called modulation. Modulation is sometimes done by just starting in the new key with no preparation -this kind of key change is common in various kinds of popular music, when a sudden change to a key a whole tone higher is a quite frequently heard device at the end of a song. In classical music, however, a "smoother" kind of key change is more usual. In this case, modulation is usually brought about by using certain chords, which are made up of notes ("pivot notes") or chords ("pivot chords" ) common to both the old key and the new one. The change is solidified by a cadence in the new key. Thus, it is smoother to modulate to some keys (i.e., nearly related keys) than others, because certain keys have more notes in common with each other than others, and therefore more possible pivot notes or chords. Modulation to the dominant (a fifth above the original key) or the subdominant (a fourth above) is relatively easy, as are modulations to the relative major of a minor key (for example, from C minor to E flat major) or to the relative minor of a major key (for example, from C major to A minor). These are the most common modulations, although more complex changes are also possible.
The purpose of modulation is to give direction and variety in music structure. Modulation in a piece is often associated with the formal structure of a piece. Using modulation properly can increase the expressiveness, expand the chromatic contrast, support the development of the theme, and adapt better to the range of the instruments and voice.
At times there might be ambiguity of key. It can be hard to determine the key of quite long passages. Some music is even atonal, meaning there is no tonal center. Thus, in this dissertation, we will focus on tonal music with the least ambuiguity of tonal center.
3.2.2 Hidden Markov Models for Key Detection
In the following, the task of key detection will be divided into two steps:
1. Detect the key without considering its mode. For example, both C major and A minor will be denoted as key 1, C# major and A# minor will be denoted as key 2, and so on. Thus, there could be 12 different keys in this step.
2. Detect the mode (major or minor).
The task is divided in this way because diatonic scales are assumed and relative modes share the same diatonic scale. Step 1 attempts to determine the height of the diatonic scale. And again, both steps involve segmentation based on key (mode) change as well as identification of keys (modes). The model used for key change detection should be able to capture the dynamic of sequences, and to incorporate prior musical knowledge easily since large volume of training data is normally unavailable. We propose to use Hidden Markov Models for this task, because HMM is a generative model for labeling structured sequence and satisfying both of the above properties.
01 02 Ot oT-i OT
b,(0,)
;r(S,) S1 S2 - St -p * STi ST
Figure 3-2: Demonstration of Hidden Markov Models.
HMM (Hidden Markov Model) is a very powerful tool to statistically model a process that varies in time. It can be seen as a doubly embedded stochastic process with a process that is not observable (sequence of hidden states) and can only be observed through another stochastic process (sequence of observable states) that produces the time set of observations. Figure 3-2 shows a graph of HMM used for key change detection. The hidden states correspond to different keys (or modes). The observations correspond to each frame represented as 24-dimensional chromagram vectors. The task will be decoding the underlying sequence of hidden states (keys or modes) from the observation sequence using Viterbi approach.
The parameters of HMM that need to be configured include:
- The number of states N corresponding to the number of different keys (=12) or the number of different modes (=2), respectively, in the two steps.
- The state transition probability distribution A = {aj
}
corresponding to the probability of changing from key (mode) i to key (mode)j.
Thus, A is a 12 x 12 matrix in step 1 and a2 x 2 matrix in step 2, respectively.
- The initial state distribution TI ={r,
}
corresponding to the probability at which a piece of music starts from key (mode) i.- The observation probability distribution B = {b (v)} corresponding to the probability at
Due to the small amount of labeled audio data and the clear musical interpretation of the parameters, we will directly incorporate the prior musical knowledge by empirically setting 1-I and A as follows:
1I 12
where
1
is a 12-dimensional vector in step 1 and a 2-dimensional vector in step 2. This configuration denotes equal probabilities of starting from different keys (modes).stayprob b ... b
A
= abstayprob ...
b
b b . b
_ b b ... stayprob
J-where d is 12 in step 1 and is 2 in step2. stayprob is the probability of staying in the same state and stayprob + (d -1)- b = 1. For step 1, this configuration denotes equal probabilities of changing from a key to a different key. It can be easily shown that when stayprob gets smaller, the state sequence gets less stable (changes more often). In our experiment, stayprob will be varying within a range (e.g., [0.9900 0.99951) in step 1 and be set to 1-10-12 or 1-0-20 in step 2 to see how it impacts the performance.
For observation probability distribution, instead of Gaussian probabilistic models, commonly used for modeling observations of continuous random vectors in HMM, the cosine distances between the observation (the 24-dimensional chromagram vector) and pre-defined template vectors were used to represent how likely the observation was emitted by the corresponding keys or modes, i.e.,
b(v) V.9 (3-7)
where O is the template of state
j
(corresponding to the jth key or mode). The advantage of using cosine distance instead of Gaussian distribution is that the key (or mode) is more correlated with the relative amplitudes of different frequency components rather than the absolute values of the amplitudes. Figure 3-3 shows an example for demonstrating this. Suppose points A, B and C are three chromagram vectors. Based on musical knowledge, B and C are more likely to be generated by the same key (or, mode) than A and C, because B and C have more similar energy profiles. However, if we look at the Euclidean space, A and C are closer to each other than B and C; thus, if we use a Gaussian distribution to model the observation probability distribution, A and C will be more likely to be generated by the same key, which is not true./
-.---.-I I
II /
/
Figure 3-3: Comparison of observation distributions of Gaussian and cosine distance.
For step 1, two ways for configuring the templates of keys were explored:
1) The template of a key was empirically set corresponding to the diatonic scale of that key. For
example, the template for key 1 (C major or A minor) is 01 =[1101011010101]T (Figure 3-4), 0,'e" = 0, where 01" denotes the sub-vector of 0, with odd indexes (i.e.,
01(1: 2: 23)) and 0e "" denotes the sub-vector of 8, with even indexes (i.e., 01(2: 2: 24)).
This means we ignore the elements with even indexes when calculating the cosine distance. The templates of other keys were set simply by rotating 0, accordingly:
6
= r(9,,2.(j - 1)) (3-8)#
= r(a,k), s.t.p1
iI = a[(k + i) mod 24]where j=1, 2, ... , 12 and i, k=1, 2, . 24. Let us also define 24 mod 24 = 24.
Figure 3-4: Configuration of the template for C major (or A minor).
2) The template of a key was learned from symbolic musical data. The symbolic data set used to train the template includes 7,673 folk music scores, which are widely used for music informatics research. The template was generated as follows: get the key signature of each piece and assume it is the key of that piece (occasionally the key of a piece might be different from the key signature); count the number of times that each note (octave-equivalent and relative to the key) appears (i.e., a 12-dimensional vector corresponding to do-do#-re-re#-mi-fa-fa#-sol-sol#-la-la#-ti); average the vectors over all pieces and normalize it. Similar to method 1), we assign 0 "dd to be the normalized vector, O "" =0 ,and 0 = r(0 1,2 -(j -1)).
templates of a key 0. 2 0.14 0.12 -0.1 0.08- 0.06- 0.04- 0.02-0 2 3 4 5 6 7 8 9 10 11 12 note trained termplale empirical template
Figure 3-5: Configurations of templates -0" (trained template and empirical template).
For step 2, the templates of modes were empirically set as follows:
0,"jor odd =[000000010000]T,
0,minoodd T
Onjreven = Onnreven =o
rnafor minor
This setting comes from musical knowledge that typically in a major piece, the dominant (G in C major) appears more often than the submediant (A in C major), while in a minor piece, the tonic (A in A minor) appears more often than the subtonic (G in A minor). Note the templates need to be rotated accordingly (Equation 3-8) based on its key detected from step 1.
The above is a simplified model and there can be several refinements of it. For example, if we consider the prior knowledge of modulation, we can encode in
A
the information that each key tends to change to its "close" keys rather than the other keys. The initial key or mode of a piece may not be uniformly distributed as well. But to quantize the numbers, we will need a very large corpus of pre-labeled musical data, which is not available here.3.3 Detection of Chord Progression
Using the same approach, this section describes the algorithm to analyze the chord progression. Specifically, given a section (or part of it) and the key (assuming no key change within the section), we want to segment it based on chord change and identify the chord of each segment. Additionally, the algorithm does not require an input of mode and, if the mode is not provided, the algorithm can identify the mode (major or minor) of the section based on the result of chord progression analysis. That means this section provides another way of mode detection besides the one presented in the last section.
The most commonly used chords in western music are triads, which are the basis of diatonic harmony and are composed of three notes: a root note, a note which is an interval of a third above the root, and a note which is an interval of a fifth above the root.
In the model for detecting chord progression, two HMMs were built - one for major and one for minor. The given section will be analyzed by the two models separately and classified to the mode whose corresponding model outputs a larger log-likelihood. Each model has 15 states corresponding to 14 basic triads for each mode (see below; uppercase Roman numerals are used for major triads; lowercase Roman numerals for minor triads; a small circle superscript for diminished) and one additional state for "other triads":
Major: I, ii, iii, IV, V, vi, viio; i, II, III, iv, v, VI, vii Minor: i, ii0, III, iv, V, VI, viio; I, ii, iii, IV, v, vi, V
Again, the parameters for either HMM were set empirically based on their musical interpretation:
chor) = 0.63 /,,ord(2: 7) = 0.05 ,chord(8 :14) =0.01 c,ord(15)= 0 stayprob b ... b Ahord = b stayprob ... b Ac., = b b .. b b b ... stayprob_15x15
where stayprob will be varying in a range (e.g., [0.70 0.90]) to see how it impacts the performance. Again, this configuration denotes equal probabilities of changing from a triad to a different triad. The configuration of the initial state probabilities denotes uneven probabilities of starting from different triads: most likely to start from tonic, less likely to start from other diatonic triads, and least likely to start from other triads, assuming the input section starts from the beginning of a musical phrase.
Similarly, the observation probability distributions were obtained by calculating the cosine distances between observations and templates of triads. The template of a triad is configured to correspond to the three notes of that triad. For example, the template with odd indexes for a major tonic triad (I in major mode) in key 1 is 9,"dd = [10 0 0 10 0 10 0 0 0 ]T; the template for a minor
tonic triad (i in minor mode) is 01"od = [1 0 00 1 00001 0 0]T . Note that since we have been
given the key of the section, we can rotate the 24-dimensioanl chromagram representation accordingly (Equation 3-8) in advance to always make the first dimension the tonic for major mode or the 10th dimension the tonic for minor mode.
3.4 Evaluation Method
To evaluate the results, two aspects need to be considered: label accuracy (how the computed label of each frame is consistent with the actual label) and segmentation accuracy (how the detected locations of transitions are consistent with the actual locations).