IFAC PapersOnLine 50-1 (2017) 856–861
ScienceDirect
Available online at www.sciencedirect.com
2405-8963 © 2017, IFAC (International Federation of Automatic Control) Hosting by Elsevier Ltd. All rights reserved. Peer review under responsibility of International Federation of Automatic Control.
10.1016/j.ifacol.2017.08.254
© 2017, IFAC (International Federation of Automatic Control) Hosting by Elsevier Ltd. All rights reserved.
Electrocardiogram R-wave is an Unreliable Indicator of Pulse Wave
Initialization
Joel Balmer*, Christopher Pretty*, Shun Kamoi*, Shaun Davidson*, Antoine Pironet**, Thomas Desaive**,
Geoffrey M Shaw***, J. Geoffrey Chase*
*Department of Mechanical Engineering, University of Canterbury,
Christchurch, New Zealand (email:
[email protected]
).
**GIGA Cardiovascular Science, University of Liege,
Liege, Belgium (email:
[email protected]
)
***Intensive Care Unit, Christchurch Hospital,
Christchurch, New Zealand, (email:
[email protected]
)
Abstract: Pulse wave velocity (PWV) measurements are commonly used to evaluate a patient’s arterial
stiffness, an indicator of cardiovascular dysfunction. PWV is usually calculated by measuring the pulse transit time (PTT) over a known distance through the arteries. In an experimental study on animals, it is straight forward to measure the PTT using two pressure catheters a known distance apart in the central arteries. However, in a clinical setting it is uncommon for such a direct invasive method to be used. This study aims to identify whether a surrogate measure of PTT could be found without the need for an external device and without being additionally invasive. The aim is to use the time between the R-wave of an electrocardiogram (ECG), and the pulse wave passing one pressure catheter (rPTT), both of which are common in critical care. The analysis was performed using data from four porcine experiments (Pietrain Pigs, 20-29kg) in which ECG, aortic arch pressure and abdominal aortic pressure were measured simultaneously over a range of induced hemodynamic conditions including recruitment manoeuvres (RM), fluid admission and dobutamine admission. From the measured data, the correlation of rPTT and PTT was calculated for each pig and condition. The overall results showed varied correlations across the pigs (r2 = 0.07 to 0.75). The variability is suspected to be due to two main causes,
the first being pig specific response to the interventions. The second cause leading to poor correlation is suspected to be the pre-ejection period (PEP), the time following the ECG R-wave but before ejection of blood from the ventricle. The analysis showed that rPTT was an unreliable measure of PTT and a poor surrogate.
Keywords: Biomedical systems, Bio-signals analysis and interpretation, Pulse transit time, Pulse wave velocity, Pre-ejection Period, Electrocardiogram, Cardiovascular
1. INTRODUCTION
Pulse wave velocity (PWV) is clinically useful for determining a patients arterial stiffness and is an indicator for possible future cardiovascular dysfunction (Laurent et al. 2006; Blacher, Asmar, et al. 1999). A stiffer artery expands less under flow induced pressure and thus dissipates less energy, leading to the pulse wave traveling faster. PWV has also been used as a parameter in models for determining/estimating other physiology with varied success (Kamoi et al. 2015; Fung et al. 2004; Pitson et al. 1994). PWV is commonly measured using pulse transit time (PTT), the time it takes for a wave front generated by the heart to travel between two arterial sites, a known distance apart (Millasseau et al. 2005; Kamoi et al. 2015; Dogui et al. 2011; Loukogeorgakis et al. 2002; Payne et al. 2006; Laurent et al. 2006). The wave front is often identified as the foot of an arterial pressure waveform.
The ‘gold standard’ PWV measure for arterial stiffness is measured from the common carotid artery to the femoral artery (Laurent et al. 2006). However, measures between other arterial sites are common, depending on whether a local or regional PWV measure is desired (Laurent et al. 2006). In a clinical setting it is often most relevant to measure PTT along the aortic pathway (Blacher, Guerin, et al. 1999; Laurent et al. 2006).
In an experimental setting, particularly those using animals as a substitute for human patients, it is easy to measure PTT directly using invasive means. In a clinical setting it is more desirable to minimise invasion to patients and hence devices which measure PTT and PWV using minimal invasion are favoured.
This study aims to identify whether a surrogate measure of PTT could be found without the need for any external or additionally invasive devices. The intention is to use metrics
Proceedings of the 20th World Congress
The International Federation of Automatic Control Toulouse, France, July 9-14, 2017
Copyright © 2017 IFAC
879
Electrocardiogram R-wave is an Unreliable Indicator of Pulse Wave
Initialization
Joel Balmer*, Christopher Pretty*, Shun Kamoi*, Shaun Davidson*, Antoine Pironet**, Thomas Desaive**,
Geoffrey M Shaw***, J. Geoffrey Chase*
*Department of Mechanical Engineering, University of Canterbury,
Christchurch, New Zealand (email:
[email protected]
).
**GIGA Cardiovascular Science, University of Liege,
Liege, Belgium (email:
[email protected]
)
***Intensive Care Unit, Christchurch Hospital,
Christchurch, New Zealand, (email:
[email protected]
)
Abstract: Pulse wave velocity (PWV) measurements are commonly used to evaluate a patient’s arterial
stiffness, an indicator of cardiovascular dysfunction. PWV is usually calculated by measuring the pulse transit time (PTT) over a known distance through the arteries. In an experimental study on animals, it is straight forward to measure the PTT using two pressure catheters a known distance apart in the central arteries. However, in a clinical setting it is uncommon for such a direct invasive method to be used. This study aims to identify whether a surrogate measure of PTT could be found without the need for an external device and without being additionally invasive. The aim is to use the time between the R-wave of an electrocardiogram (ECG), and the pulse wave passing one pressure catheter (rPTT), both of which are common in critical care. The analysis was performed using data from four porcine experiments (Pietrain Pigs, 20-29kg) in which ECG, aortic arch pressure and abdominal aortic pressure were measured simultaneously over a range of induced hemodynamic conditions including recruitment manoeuvres (RM), fluid admission and dobutamine admission. From the measured data, the correlation of rPTT and PTT was calculated for each pig and condition. The overall results showed varied correlations across the pigs (r2 = 0.07 to 0.75). The variability is suspected to be due to two main causes,
the first being pig specific response to the interventions. The second cause leading to poor correlation is suspected to be the pre-ejection period (PEP), the time following the ECG R-wave but before ejection of blood from the ventricle. The analysis showed that rPTT was an unreliable measure of PTT and a poor surrogate.
Keywords: Biomedical systems, Bio-signals analysis and interpretation, Pulse transit time, Pulse wave velocity, Pre-ejection Period, Electrocardiogram, Cardiovascular
1. INTRODUCTION
Pulse wave velocity (PWV) is clinically useful for determining a patients arterial stiffness and is an indicator for possible future cardiovascular dysfunction (Laurent et al. 2006; Blacher, Asmar, et al. 1999). A stiffer artery expands less under flow induced pressure and thus dissipates less energy, leading to the pulse wave traveling faster. PWV has also been used as a parameter in models for determining/estimating other physiology with varied success (Kamoi et al. 2015; Fung et al. 2004; Pitson et al. 1994). PWV is commonly measured using pulse transit time (PTT), the time it takes for a wave front generated by the heart to travel between two arterial sites, a known distance apart (Millasseau et al. 2005; Kamoi et al. 2015; Dogui et al. 2011; Loukogeorgakis et al. 2002; Payne et al. 2006; Laurent et al. 2006). The wave front is often identified as the foot of an arterial pressure waveform.
The ‘gold standard’ PWV measure for arterial stiffness is measured from the common carotid artery to the femoral artery (Laurent et al. 2006). However, measures between other arterial sites are common, depending on whether a local or regional PWV measure is desired (Laurent et al. 2006). In a clinical setting it is often most relevant to measure PTT along the aortic pathway (Blacher, Guerin, et al. 1999; Laurent et al. 2006).
In an experimental setting, particularly those using animals as a substitute for human patients, it is easy to measure PTT directly using invasive means. In a clinical setting it is more desirable to minimise invasion to patients and hence devices which measure PTT and PWV using minimal invasion are favoured.
This study aims to identify whether a surrogate measure of PTT could be found without the need for any external or additionally invasive devices. The intention is to use metrics
Proceedings of the 20th World Congress
The International Federation of Automatic Control Toulouse, France, July 9-14, 2017
Copyright © 2017 IFAC 879
Electrocardiogram R-wave is an Unreliable Indicator of Pulse Wave
Initialization
Joel Balmer*, Christopher Pretty*, Shun Kamoi*, Shaun Davidson*, Antoine Pironet**, Thomas Desaive**,
Geoffrey M Shaw***, J. Geoffrey Chase*
*Department of Mechanical Engineering, University of Canterbury,
Christchurch, New Zealand (email:
[email protected]
).
**GIGA Cardiovascular Science, University of Liege,
Liege, Belgium (email:
[email protected]
)
***Intensive Care Unit, Christchurch Hospital,
Christchurch, New Zealand, (email:
[email protected]
)
Abstract: Pulse wave velocity (PWV) measurements are commonly used to evaluate a patient’s arterial
stiffness, an indicator of cardiovascular dysfunction. PWV is usually calculated by measuring the pulse transit time (PTT) over a known distance through the arteries. In an experimental study on animals, it is straight forward to measure the PTT using two pressure catheters a known distance apart in the central arteries. However, in a clinical setting it is uncommon for such a direct invasive method to be used. This study aims to identify whether a surrogate measure of PTT could be found without the need for an external device and without being additionally invasive. The aim is to use the time between the R-wave of an electrocardiogram (ECG), and the pulse wave passing one pressure catheter (rPTT), both of which are common in critical care. The analysis was performed using data from four porcine experiments (Pietrain Pigs, 20-29kg) in which ECG, aortic arch pressure and abdominal aortic pressure were measured simultaneously over a range of induced hemodynamic conditions including recruitment manoeuvres (RM), fluid admission and dobutamine admission. From the measured data, the correlation of rPTT and PTT was calculated for each pig and condition. The overall results showed varied correlations across the pigs (r2 = 0.07 to 0.75). The variability is suspected to be due to two main causes,
the first being pig specific response to the interventions. The second cause leading to poor correlation is suspected to be the pre-ejection period (PEP), the time following the ECG R-wave but before ejection of blood from the ventricle. The analysis showed that rPTT was an unreliable measure of PTT and a poor surrogate.
Keywords: Biomedical systems, Bio-signals analysis and interpretation, Pulse transit time, Pulse wave velocity, Pre-ejection Period, Electrocardiogram, Cardiovascular
1. INTRODUCTION
Pulse wave velocity (PWV) is clinically useful for determining a patients arterial stiffness and is an indicator for possible future cardiovascular dysfunction (Laurent et al. 2006; Blacher, Asmar, et al. 1999). A stiffer artery expands less under flow induced pressure and thus dissipates less energy, leading to the pulse wave traveling faster. PWV has also been used as a parameter in models for determining/estimating other physiology with varied success (Kamoi et al. 2015; Fung et al. 2004; Pitson et al. 1994). PWV is commonly measured using pulse transit time (PTT), the time it takes for a wave front generated by the heart to travel between two arterial sites, a known distance apart (Millasseau et al. 2005; Kamoi et al. 2015; Dogui et al. 2011; Loukogeorgakis et al. 2002; Payne et al. 2006; Laurent et al. 2006). The wave front is often identified as the foot of an arterial pressure waveform.
The ‘gold standard’ PWV measure for arterial stiffness is measured from the common carotid artery to the femoral artery (Laurent et al. 2006). However, measures between other arterial sites are common, depending on whether a local or regional PWV measure is desired (Laurent et al. 2006). In a clinical setting it is often most relevant to measure PTT along the aortic pathway (Blacher, Guerin, et al. 1999; Laurent et al. 2006).
In an experimental setting, particularly those using animals as a substitute for human patients, it is easy to measure PTT directly using invasive means. In a clinical setting it is more desirable to minimise invasion to patients and hence devices which measure PTT and PWV using minimal invasion are favoured.
This study aims to identify whether a surrogate measure of PTT could be found without the need for any external or additionally invasive devices. The intention is to use metrics
Proceedings of the 20th World Congress
The International Federation of Automatic Control Toulouse, France, July 9-14, 2017
Electrocardiogram R-wave is an Unreliable Indicator of Pulse Wave
Initialization
Joel Balmer*, Christopher Pretty*, Shun Kamoi*, Shaun Davidson*, Antoine Pironet**, Thomas Desaive**,
Geoffrey M Shaw***, J. Geoffrey Chase*
*Department of Mechanical Engineering, University of Canterbury,
Christchurch, New Zealand (email:
[email protected]
).
**GIGA Cardiovascular Science, University of Liege,
Liege, Belgium (email:
[email protected]
)
***Intensive Care Unit, Christchurch Hospital,
Christchurch, New Zealand, (email:
[email protected]
)
Abstract: Pulse wave velocity (PWV) measurements are commonly used to evaluate a patient’s arterial
stiffness, an indicator of cardiovascular dysfunction. PWV is usually calculated by measuring the pulse transit time (PTT) over a known distance through the arteries. In an experimental study on animals, it is straight forward to measure the PTT using two pressure catheters a known distance apart in the central arteries. However, in a clinical setting it is uncommon for such a direct invasive method to be used. This study aims to identify whether a surrogate measure of PTT could be found without the need for an external device and without being additionally invasive. The aim is to use the time between the R-wave of an electrocardiogram (ECG), and the pulse wave passing one pressure catheter (rPTT), both of which are common in critical care. The analysis was performed using data from four porcine experiments (Pietrain Pigs, 20-29kg) in which ECG, aortic arch pressure and abdominal aortic pressure were measured simultaneously over a range of induced hemodynamic conditions including recruitment manoeuvres (RM), fluid admission and dobutamine admission. From the measured data, the correlation of rPTT and PTT was calculated for each pig and condition. The overall results showed varied correlations across the pigs (r2 = 0.07 to 0.75). The variability is suspected to be due to two main causes,
the first being pig specific response to the interventions. The second cause leading to poor correlation is suspected to be the pre-ejection period (PEP), the time following the ECG R-wave but before ejection of blood from the ventricle. The analysis showed that rPTT was an unreliable measure of PTT and a poor surrogate.
Keywords: Biomedical systems, Bio-signals analysis and interpretation, Pulse transit time, Pulse wave velocity, Pre-ejection Period, Electrocardiogram, Cardiovascular
1. INTRODUCTION
Pulse wave velocity (PWV) is clinically useful for determining a patients arterial stiffness and is an indicator for possible future cardiovascular dysfunction (Laurent et al. 2006; Blacher, Asmar, et al. 1999). A stiffer artery expands less under flow induced pressure and thus dissipates less energy, leading to the pulse wave traveling faster. PWV has also been used as a parameter in models for determining/estimating other physiology with varied success (Kamoi et al. 2015; Fung et al. 2004; Pitson et al. 1994). PWV is commonly measured using pulse transit time (PTT), the time it takes for a wave front generated by the heart to travel between two arterial sites, a known distance apart (Millasseau et al. 2005; Kamoi et al. 2015; Dogui et al. 2011; Loukogeorgakis et al. 2002; Payne et al. 2006; Laurent et al. 2006). The wave front is often identified as the foot of an arterial pressure waveform.
The ‘gold standard’ PWV measure for arterial stiffness is measured from the common carotid artery to the femoral artery (Laurent et al. 2006). However, measures between other arterial sites are common, depending on whether a local or regional PWV measure is desired (Laurent et al. 2006). In a clinical setting it is often most relevant to measure PTT along the aortic pathway (Blacher, Guerin, et al. 1999; Laurent et al. 2006).
In an experimental setting, particularly those using animals as a substitute for human patients, it is easy to measure PTT directly using invasive means. In a clinical setting it is more desirable to minimise invasion to patients and hence devices which measure PTT and PWV using minimal invasion are favoured.
This study aims to identify whether a surrogate measure of PTT could be found without the need for any external or additionally invasive devices. The intention is to use metrics
Toulouse, France, July 9-14, 2017
Electrocardiogram R-wave is an Unreliable Indicator of Pulse Wave
Initialization
Joel Balmer*, Christopher Pretty*, Shun Kamoi*, Shaun Davidson*, Antoine Pironet**, Thomas Desaive**,
Geoffrey M Shaw***, J. Geoffrey Chase*
*Department of Mechanical Engineering, University of Canterbury,
Christchurch, New Zealand (email:
[email protected]
).
**GIGA Cardiovascular Science, University of Liege,
Liege, Belgium (email:
[email protected]
)
***Intensive Care Unit, Christchurch Hospital,
Christchurch, New Zealand, (email:
[email protected]
)
Abstract: Pulse wave velocity (PWV) measurements are commonly used to evaluate a patient’s arterial
stiffness, an indicator of cardiovascular dysfunction. PWV is usually calculated by measuring the pulse transit time (PTT) over a known distance through the arteries. In an experimental study on animals, it is straight forward to measure the PTT using two pressure catheters a known distance apart in the central arteries. However, in a clinical setting it is uncommon for such a direct invasive method to be used. This study aims to identify whether a surrogate measure of PTT could be found without the need for an external device and without being additionally invasive. The aim is to use the time between the R-wave of an electrocardiogram (ECG), and the pulse wave passing one pressure catheter (rPTT), both of which are common in critical care. The analysis was performed using data from four porcine experiments (Pietrain Pigs, 20-29kg) in which ECG, aortic arch pressure and abdominal aortic pressure were measured simultaneously over a range of induced hemodynamic conditions including recruitment manoeuvres (RM), fluid admission and dobutamine admission. From the measured data, the correlation of rPTT and PTT was calculated for each pig and condition. The overall results showed varied correlations across the pigs (r2 = 0.07 to 0.75). The variability is suspected to be due to two main causes,
the first being pig specific response to the interventions. The second cause leading to poor correlation is suspected to be the pre-ejection period (PEP), the time following the ECG R-wave but before ejection of blood from the ventricle. The analysis showed that rPTT was an unreliable measure of PTT and a poor surrogate.
Keywords: Biomedical systems, Bio-signals analysis and interpretation, Pulse transit time, Pulse wave velocity, Pre-ejection Period, Electrocardiogram, Cardiovascular
1. INTRODUCTION
Pulse wave velocity (PWV) is clinically useful for determining a patients arterial stiffness and is an indicator for possible future cardiovascular dysfunction (Laurent et al. 2006; Blacher, Asmar, et al. 1999). A stiffer artery expands less under flow induced pressure and thus dissipates less energy, leading to the pulse wave traveling faster. PWV has also been used as a parameter in models for determining/estimating other physiology with varied success (Kamoi et al. 2015; Fung et al. 2004; Pitson et al. 1994). PWV is commonly measured using pulse transit time (PTT), the time it takes for a wave front generated by the heart to travel between two arterial sites, a known distance apart (Millasseau et al. 2005; Kamoi et al. 2015; Dogui et al. 2011; Loukogeorgakis et al. 2002; Payne et al. 2006; Laurent et al. 2006). The wave front is often identified as the foot of an arterial pressure waveform.
The ‘gold standard’ PWV measure for arterial stiffness is measured from the common carotid artery to the femoral artery (Laurent et al. 2006). However, measures between other arterial sites are common, depending on whether a local or regional PWV measure is desired (Laurent et al. 2006). In a clinical setting it is often most relevant to measure PTT along the aortic pathway (Blacher, Guerin, et al. 1999; Laurent et al. 2006).
In an experimental setting, particularly those using animals as a substitute for human patients, it is easy to measure PTT directly using invasive means. In a clinical setting it is more desirable to minimise invasion to patients and hence devices which measure PTT and PWV using minimal invasion are favoured.
This study aims to identify whether a surrogate measure of PTT could be found without the need for any external or additionally invasive devices. The intention is to use metrics
Copyright © 2017 IFAC 879
Electrocardiogram R-wave is an Unreliable Indicator of Pulse Wave
Initialization
Joel Balmer*, Christopher Pretty*, Shun Kamoi*, Shaun Davidson*, Antoine Pironet**, Thomas Desaive**,
Geoffrey M Shaw***, J. Geoffrey Chase*
*Department of Mechanical Engineering, University of Canterbury,
Christchurch, New Zealand (email:
[email protected]
).
**GIGA Cardiovascular Science, University of Liege,
Liege, Belgium (email:
[email protected]
)
***Intensive Care Unit, Christchurch Hospital,
Christchurch, New Zealand, (email:
[email protected]
)
Abstract: Pulse wave velocity (PWV) measurements are commonly used to evaluate a patient’s arterial
stiffness, an indicator of cardiovascular dysfunction. PWV is usually calculated by measuring the pulse transit time (PTT) over a known distance through the arteries. In an experimental study on animals, it is straight forward to measure the PTT using two pressure catheters a known distance apart in the central arteries. However, in a clinical setting it is uncommon for such a direct invasive method to be used. This study aims to identify whether a surrogate measure of PTT could be found without the need for an external device and without being additionally invasive. The aim is to use the time between the R-wave of an electrocardiogram (ECG), and the pulse wave passing one pressure catheter (rPTT), both of which are common in critical care. The analysis was performed using data from four porcine experiments (Pietrain Pigs, 20-29kg) in which ECG, aortic arch pressure and abdominal aortic pressure were measured simultaneously over a range of induced hemodynamic conditions including recruitment manoeuvres (RM), fluid admission and dobutamine admission. From the measured data, the correlation of rPTT and PTT was calculated for each pig and condition. The overall results showed varied correlations across the pigs (r2 = 0.07 to 0.75). The variability is suspected to be due to two main causes,
the first being pig specific response to the interventions. The second cause leading to poor correlation is suspected to be the pre-ejection period (PEP), the time following the ECG R-wave but before ejection of blood from the ventricle. The analysis showed that rPTT was an unreliable measure of PTT and a poor surrogate.
Keywords: Biomedical systems, Bio-signals analysis and interpretation, Pulse transit time, Pulse wave velocity, Pre-ejection Period, Electrocardiogram, Cardiovascular
1. INTRODUCTION
Pulse wave velocity (PWV) is clinically useful for determining a patients arterial stiffness and is an indicator for possible future cardiovascular dysfunction (Laurent et al. 2006; Blacher, Asmar, et al. 1999). A stiffer artery expands less under flow induced pressure and thus dissipates less energy, leading to the pulse wave traveling faster. PWV has also been used as a parameter in models for determining/estimating other physiology with varied success (Kamoi et al. 2015; Fung et al. 2004; Pitson et al. 1994). PWV is commonly measured using pulse transit time (PTT), the time it takes for a wave front generated by the heart to travel between two arterial sites, a known distance apart (Millasseau et al. 2005; Kamoi et al. 2015; Dogui et al. 2011; Loukogeorgakis et al. 2002; Payne et al. 2006; Laurent et al. 2006). The wave front is often identified as the foot of an arterial pressure waveform.
The ‘gold standard’ PWV measure for arterial stiffness is measured from the common carotid artery to the femoral artery (Laurent et al. 2006). However, measures between other arterial sites are common, depending on whether a local or regional PWV measure is desired (Laurent et al. 2006). In a clinical setting it is often most relevant to measure PTT along the aortic pathway (Blacher, Guerin, et al. 1999; Laurent et al. 2006).
In an experimental setting, particularly those using animals as a substitute for human patients, it is easy to measure PTT directly using invasive means. In a clinical setting it is more desirable to minimise invasion to patients and hence devices which measure PTT and PWV using minimal invasion are favoured.
This study aims to identify whether a surrogate measure of PTT could be found without the need for any external or additionally invasive devices. The intention is to use metrics
Toulouse, France, July 9-14, 2017
that are already commonly measured for other purposes in an intensive care unit (ICU), such as electrocardiogram (ECG). An ECG measurement is non-invasive and common in hospital care. The perceived risk is the ECG R-wave signifies the start of ventricular contraction, rather than the onset of blood ejection. For a short time following the R-wave the heart contracts isovolumetrically and no blood is ejected, the duration of this event is known as the pre-ejection period (PEP) (Pitson et al. 1994; Payne et al. 2006). The ECG signal could be used with only a single arterial pressure catheter, which is also common in critical care and the ICU. This would remove the need for a second arterial catheter, located more central to the heart, which is more invasive and less common than ECG.
In a previous study, the time between an ECG R-wave and succeeding foot of a pressure waveform, was termed rPTT (Payne et al. 2006); for consistency this paper uses the same notation. However, it should be noted that rPTT is not just a pulse transit time measurement, it is instead made up of both the PTT, from the aortic valve to a downstream arterial site, and PEP.
If rPTT and PTT show good correlation over a range of hemodynamic states, rPTT may be used to simplify clinical measures and models that rely on PTT. Hence, this study investigates how well rPTT correlates with a traditional beat to beat measure of PTT, using pressure measurements from two arterial sites in various hemodynamic conditions.
2. METHODS
2.1. Porcine Trials and Measurements
This study uses data from experiments performed on pigs at the Centre Hospitalier Universitaire de Liège, Belgium. All experimental procedures, protocols and the use of data in this study were reviewed and approved by the Ethics Committee of the University of Liège Medical Faculty.
Experiments were performed on 7 healthy, pure pietrain pigs, weighing between 20-29kg. Of the 7 pigs, Pigs 2, 3, 6 and 7 are analysed as part of this paper. The other pigs were excluded due to differences in experimental protocol and in some places abnormalities in the captured data. The pigs were administered with ketamine (20mg/kg) and diazepam (1mg/kg) prior to conducting the protocols of the experiment. Anaesthesia was induced and maintained by continuous infusion of sufentanil (0.5µg/kg/hour) and sodium pentobarbital (3mg/kg). Each pig was intubated via a tracheotomy and ventilated using a Draeger Evita2 ventilator (Draeger, Lubeck, Germany).
Left ventricular pressure and volume were directly measured using 7F micromanometer-tipped admittance catheters (Transonic Scisense Inc., Ontario, Canada) inserted into the ventricle through the right carotid artery. Pressure waveform
measurements were captured at the aortic arch and abdominal aorta with 7F pressure catheters (Transonic Scisense Inc., Ontario, Canada). The catheters were inserted into the aortic arch through the left carotid artery and into the abdominal aorta through the femoral artery, respectively. All cardiovascular and respiratory data were sampled at 1000Hz.
2.2. Hemodynamic Modification
During the experiments, each pig underwent several step-wise positive end-expiratory pressure (PEEP) recruitment manoeuvres (RM). Increases in PEEP reduce systemic venous return to the right heart and increase pulmonary resistance. Thus, left ventricle preload decreases, leading to lower arterial pressure and a reduction in stroke volume (SV) (Luecke & Pelosi 2005), and an expected increase in PTT. RMs involved increasing PEEP with 5cmH2O steps to a
maximum of 15cmH2O for Pig 7 and 20cmH2O for Pigs 2, 3
and 6.
The experiment also included multiple administrations of fluid boluses. These boluses were administered in 180ml steps ranging from 0ml to 720ml / 900ml for Pigs 7 / 2, 3 and 6, respectively. This aimed to increase the blood volume and as a consequence increase the arterial pressure and SV, while decreasing PTT for the pigs that were fluid responsive. The experiment also involved administering a continuous dobutamine infusion to modulate contractility. Dobutamine increases contractility of the heart and can also act as a vasodilator (Ruffolo 1987; Ellender & Skinner 2008). It is commonly used in clinical settings to increase cardiac output (CO) as a result of increased contractility (Ruffolo 1987; Ellender & Skinner 2008). The effect of dobutamine on PTT was harder to predict, as the increase in CO could lead to a shorter PTT. However, the vasodilation could counter this effect, depending on the level of subject specific response to inotrope admission.
2.3. Data Selection Summary
Four stages were considered as part of the analysis: a control, followed by three hemodynamic modifications outlined in Section 2.2. The control stage was when a pig was at rest following anaesthesia, but before any hemodynamic modifications were applied. The second stage was a RM where the data analysed was that captured during the maximum PEEP, labelled high PEEP in Section 3 tables. The particular RM used occurred before any fluids or dobutamine were introduced. The third stage was high fluids, the time following each pig’s final 180ml bolus admission, taking it to its highest introduced fluid state. The final stage was during the admission of dobutamine, which for Pig 6 was infused at a rate of 2.5 µg/kg/min while Pigs 2, 3, and 7 were infused at 5 µg /kg/min.
858 Joel Balmer et al. / IFAC PapersOnLine 50-1 (2017) 856–861
2.4. Identification of rPTT and PTT
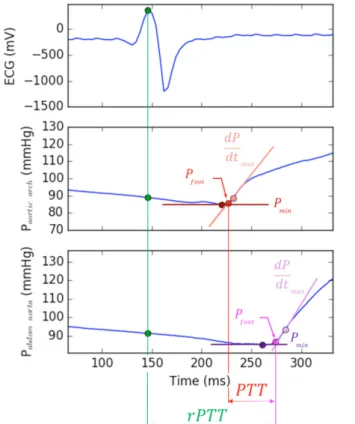
In this study, PTT was measured as the time between the arrival of a foot of the pressure waveform at the catheter in the aortic arch and then the catheter in the lower abdominal aorta. The foot of the waveform for each beat was identified as the observed measurement nearest the intersection of two tangent lines, one line from the minimum pressure for a given beat, the other from the maximum positive pressure gradient, occurring during systole. Example feet of the waveforms are shown in Figure 1.
Figure 1: Example of how rPTT and PTT are determined,
including identification of the feet of the pressure waveforms.
This method is consistent with previous published studies (Payne et al. 2006; Kamoi et al. 2015) and was found to be more reliable than simply taking the minimum pressure of a beat to be the foot, particularly for pigs and events where the pressures were low.
In this study, rPTT is the time between the ECG R-wave and the foot of the pressure waveform, measured in the abdominal aorta. The R-wave was the simplest of points to identify given its prominence in the ECG waveform.
2.5. Data Analyses
Each stage outlined in Section 2.3 was first analysed separately for each pig. For each beat, the PTT and rPTT were identified using the method shown in Figure 1. Once all
beats of a stage were analysed, PTT and rPTT means and standard deviations were found. Analysing each stage individually allowed the variability due to a particular hemodynamic modification to be measured. Next the variability in rPTT due to variability in PTT was measured using linear regression and the coefficient of determination (r2). This method gives a measure of the strength of
relationship between the two variables. The r2 values physical
represents the percentage of the total variation in rPTT described by the variation in PTT.
Once each stage analysis was complete, the stages were concatenated and an overall analysis was complete. By concatenating the data of each stage a wider range of PTT was observed and hence a more holistic picture of the relationship between rPTT and PTT was found. The means, standard deviations and correlation coefficients for each pig were then compared in order to see subject variability of PTT and rPTT. The results of this analysis are found in Section 3.
3. RESULTS
Each stage contains between 71 and 687 beats, with high PEEP typically representing the fewest beats, while dobutamine and high fluids accounted for the most. The mean and standard deviation of PTT and rPTT for each pig and stage are summarised in Table 1. The coefficient of determination of each stage and for each pig is shown in Table 2. Figure 2-5 shows each stages PTT vs rPTT data and the overall coefficients of determination for each pig.
Table 1: Per pig stage specific statistics. Data is given as mean and (standard deviation) in milliseconds (ms) Mean and (Standard Deviation) of PTT & rPTT (ms) Pig
No. Control High PEEP High Fluids Dobutamine PTT rPTT PTT rPTT PTT rPTT PTT rPTT Pig 2 66.9 (1.6) 136.2 (2.6) 65.1 (2.0) 139.8 (3.3) 69.5 (2.6) 163.9 (2.8) 58.2 (1.5) 106.3 (1.6) Pig 3 56.4 (1.1) 106.8 (1.7) 55.8 (1.0) 106.0 (2.3) 57.4 (1.1) 112.1 (1.7) 57.6 (1.2) 113.9 (2.2) Pig 6 46.3 (0.8) 128.2 (3.6) 44.7 (0.8) 130.2 (3.9) 44.6 (0.9) 136.2 (2.4) 45.7 (0.8) 126.8 (2.1) Pig 7 103.6 (1.3) 152.5 (3.8) 112.4 (2.2) 166.1 (4.5) 99.8 (1.9) 154.4 (4.1) 96.7 (3.8) 161.8 (9.9)
Table 2: PTT vs rPTT Coefficients of Determination for each pig and each stage.
Coefficient of Determination (r2 value)
Pig No. Control High PEEP High Fluids Dobuta-mine Overall Pig 2 0.35 0.11 0.46 0.04 0.75 Pig 3 0.47 0.16 0.45 0.38 0.38 Pig 6 0.003 0.33 0.21 0.02 0.07 Pig 7 0.57 0.51 0.60 0.85 0.21 Proceedings of the 20th IFAC World Congress
Toulouse, France, July 9-14, 2017
2.4. Identification of rPTT and PTT
In this study, PTT was measured as the time between the arrival of a foot of the pressure waveform at the catheter in the aortic arch and then the catheter in the lower abdominal aorta. The foot of the waveform for each beat was identified as the observed measurement nearest the intersection of two tangent lines, one line from the minimum pressure for a given beat, the other from the maximum positive pressure gradient, occurring during systole. Example feet of the waveforms are shown in Figure 1.
Figure 1: Example of how rPTT and PTT are determined,
including identification of the feet of the pressure waveforms.
This method is consistent with previous published studies (Payne et al. 2006; Kamoi et al. 2015) and was found to be more reliable than simply taking the minimum pressure of a beat to be the foot, particularly for pigs and events where the pressures were low.
In this study, rPTT is the time between the ECG R-wave and the foot of the pressure waveform, measured in the abdominal aorta. The R-wave was the simplest of points to identify given its prominence in the ECG waveform.
2.5. Data Analyses
Each stage outlined in Section 2.3 was first analysed separately for each pig. For each beat, the PTT and rPTT were identified using the method shown in Figure 1. Once all
beats of a stage were analysed, PTT and rPTT means and standard deviations were found. Analysing each stage individually allowed the variability due to a particular hemodynamic modification to be measured. Next the variability in rPTT due to variability in PTT was measured using linear regression and the coefficient of determination (r2). This method gives a measure of the strength of
relationship between the two variables. The r2 values physical
represents the percentage of the total variation in rPTT described by the variation in PTT.
Once each stage analysis was complete, the stages were concatenated and an overall analysis was complete. By concatenating the data of each stage a wider range of PTT was observed and hence a more holistic picture of the relationship between rPTT and PTT was found. The means, standard deviations and correlation coefficients for each pig were then compared in order to see subject variability of PTT and rPTT. The results of this analysis are found in Section 3.
3. RESULTS
Each stage contains between 71 and 687 beats, with high PEEP typically representing the fewest beats, while dobutamine and high fluids accounted for the most. The mean and standard deviation of PTT and rPTT for each pig and stage are summarised in Table 1. The coefficient of determination of each stage and for each pig is shown in Table 2. Figure 2-5 shows each stages PTT vs rPTT data and the overall coefficients of determination for each pig.
Table 1: Per pig stage specific statistics. Data is given as mean and (standard deviation) in milliseconds (ms) Mean and (Standard Deviation) of PTT & rPTT (ms) Pig
No. Control High PEEP High Fluids Dobutamine PTT rPTT PTT rPTT PTT rPTT PTT rPTT Pig 2 66.9 (1.6) 136.2 (2.6) 65.1 (2.0) 139.8 (3.3) 69.5 (2.6) 163.9 (2.8) 58.2 (1.5) 106.3 (1.6) Pig 3 56.4 (1.1) 106.8 (1.7) 55.8 (1.0) 106.0 (2.3) 57.4 (1.1) 112.1 (1.7) 57.6 (1.2) 113.9 (2.2) Pig 6 46.3 (0.8) 128.2 (3.6) 44.7 (0.8) 130.2 (3.9) 44.6 (0.9) 136.2 (2.4) 45.7 (0.8) 126.8 (2.1) Pig 7 103.6 (1.3) 152.5 (3.8) 112.4 (2.2) 166.1 (4.5) 99.8 (1.9) 154.4 (4.1) 96.7 (3.8) 161.8 (9.9)
Table 2: PTT vs rPTT Coefficients of Determination for each pig and each stage.
Coefficient of Determination (r2 value)
Pig No. Control High PEEP High Fluids Dobuta-mine Overall Pig 2 0.35 0.11 0.46 0.04 0.75 Pig 3 0.47 0.16 0.45 0.38 0.38 Pig 6 0.003 0.33 0.21 0.02 0.07 Pig 7 0.57 0.51 0.60 0.85 0.21
Figure 2: Relationship between PTT & rPTT for Pig 2 over
all four stages.
Figure 3: Relationship between PTT & rPTT for Pig 3 over
all four stages.
Figure 4: Relationship between PTT & rPTT for Pig 6 over
all four stages.
Figure 5: Relationship between PTT & rPTT for Pig 7 over
all four stages.
4. DISCUSSION
4.1. Correlation outcomes
Table 2 shows the overall coefficients of determination range from r2 = 0.07 to 0.75, indicating an inconsistent correlation
between PTT and rPTT across the pigs. Poor correlation results suggest that variation in PTT only accounts for a small fraction of the variation in rPTT, as described in Section 2.5.
4.2. Response to Interventions
In general all pigs showed only minor changes in PTT as a result of the different interventions, although Pigs 2 and 7 did give the widest range of results. One observation is that lower r2 values were observed in pigs who did not appear to
respond to the intervention of each stage. Table 1 shows that when intervention was applied to Pig 6, only very small changes in PTT and rPTT were observed, relative to the other pigs. Figures 4 and 5 illustrate this outcome with Pig 6’s data for each stage overlapping (r2 = 0.074), while Pig 7 shows
response to intervention through the change in PTT over each event (r2 = 0.205).
Another observation is the effect of intervention appears to be specific to each pig. For example, Figure 2 shows fluid admission having a significant effect on Pig 2, while the other pigs show less of a response. It is possible that Pigs 3, 6 and 7 are simply fluid unresponsive. It has been shown in both experimental and clinical settings that a significant number of critically ill patients are not fluid responsive (Marik 2013; Marik 2010; Young 2004; Michard & Teboul 2002). The best method for measuring fluid responsiveness is still debated (Cecconi et al. 2014) and such an analysis was not conducted for this study. This makes drawing conclusions on the effect of fluid admissions on PTT and rPTT difficult. During the control portion of the experiment, Pig 6 had a mean abdominal aortic pressure measurement of 105mmHg,
860 Joel Balmer et al. / IFAC PapersOnLine 50-1 (2017) 856–861
within expected physiological ranges for healthy pigs (102 ± 9.3 mmHg) (Hannon et al. 1990); while Pig 3 was significantly higher at 118.3mmHg and Pigs 2 and 7 were more than 5 standard deviations from the mean (148.8mmHg and 53mmHg, respectively). Similarly, Pigs 2, 3 and 7 showed stronger correlations, while also being more responsive to the interventions. It is possible the initial healthy state of Pig 6 simply lead to the body responding to the different treatments by adjusting to maintain its equilibrium.
4.3. Pre-ejection Period and its effect on rPTT
Where the higher end of r2 values were observed, there is still
a significant proportion of the variation in rPTT that is not explained by the variation in PTT. The remaining variation in rPTT must come from the time following the ECG R-wave, but before ejection of blood from the ventricle occurs. The ECG R-wave is the peak of the QRS complex and corresponds to ventricle depolarization, which initiates the chemical and mechanical onset of contraction. Once contraction is underway, the aortic valve is initially closed; during this period contraction is often thought of in the ideal case as being isovolumetric (Smith et al. 2005; Pironet et al. 2013; Guyton & Hall 2006).
As mentioned in Section 1, the combined electromechanical delay and isovolumetric contraction is known as the pre-ejection period (PEP) (Payne et al. 2006). The end of the PEP is defined as the aortic valve opening time (Pitson et al. 1994), which occurs when the ventricle pressure exceeds the aortic pressure. At this point the pulse wave begins its path past the catheter in the aortic arch. Thus, for any given beat in the pig experiments, the difference between rPTT and PTT should be the PEP plus a slight delay due to the aortic catheter being positioned in the aortic arch, which is set back slightly from the aortic valve.
Looking at Table 1, the difference between rPTT and PTT ranges from 49ms (Pig 7; control) to 94ms (Pig 2; high fluids). The aortic catheter was positioned close the aortic valve, suggesting a large range of PEP values of similar magnitude to the PTT observations, which is consistent with other literature using both human and animal subjects (Payne et al. 2006; Talley et al. 1971; Newlin & Levenson 1979). Furthermore, the bias caused by PEP has been observed before in studies utilizing the ECG R-wave as its initial indicator of contraction (Loukogeorgakis et al. 2002; Pitson et al. 1994; Fung et al. 2004). Hence, even modest variation in the PEP independent of PTT could explain the lack of a strong relationship between rPTT and PTT.
Variation in PEP poses an issue if rPTT was to be used as a less invasive surrogate for PTT measured using pressure measurements at two arterial sites. One solution is to measure rPTT over a longer distance so that the proportion of PEP to PTT is reduced (Fung et al. 2004). While this approach
would not remove the PEP bias, it would serve to reduce the effects of varying PEP on a PTT estimate based on rPTT. However, a common clinical motivator for calculating PTT was the determination of arterial stiffness, which increases as people age and is a predictor of future cardiovascular outcomes (Laurent et al. 2006; Blacher, Asmar, et al. 1999). The aorta is less stiff than the peripheral arteries, but shows a much larger change in stiffness over a human’s lifetime. Therefore, the aorta is the desired regional stiffness when making cardiovascular diagnostic predictions (Laurent et al. 2006; Nichols 2005; Nichols et al. 2011). Including the periphery in estimations of PTT from rPTT could lead to an overestimate in aortic arterial stiffness and incorrect diagnostic information.
There is scope still to analyse the relationship between PEP and PTT. If a strong relationship exists, one that appears to be population specific, it would be possible to measure rPTT and estimate PTT as a result. Else if PEP and PTT have a strong patient-specific correlation, rPTT may be limited to estimating ∆PTT. Finally, if PEP appears to be independent of changes in PTT, without an accurate measure of PEP, rPTT would be an unreliable substitute for the true pulse transit time.
The large range of rPTT-PTT observed across the four pigs suggests PEP is likely to be specific to each pig. Given the variability of rPTT, it seems likely that PEP will not show a strong relationship with PTT. Speculation aside, this analysis is still being conducted and remains to be validated over a larger, continuing trial with further subjects.
5. CONCULSION
The weak relationship found between PTT and rPTT suggests much of the variation in rPTT cannot be attributed to PTT. Although direct analysis of PEP is not shown in this study, the time difference between rPTT and PTT, for which a significant proportion is attributed to PEP, showed little consistency between pigs and intervention stages. As a result, this work comes to a similar conclusion to that completed by Payne et al 2006. Specifically, despite advances in processing, rPTT is unsuitable as a direct measure of PTT and is also a poor surrogate.
However, this conclusion does not render rPTT entirely useless. Further analysis needs to be completed to understand the relationship between PEP and PTT. If this relationship exists in strength, there is still the possibility of at least measuring changes in PTT by monitoring rPTT.
Proceedings of the 20th IFAC World Congress Toulouse, France, July 9-14, 2017
within expected physiological ranges for healthy pigs (102 ± 9.3 mmHg) (Hannon et al. 1990); while Pig 3 was significantly higher at 118.3mmHg and Pigs 2 and 7 were more than 5 standard deviations from the mean (148.8mmHg and 53mmHg, respectively). Similarly, Pigs 2, 3 and 7 showed stronger correlations, while also being more responsive to the interventions. It is possible the initial healthy state of Pig 6 simply lead to the body responding to the different treatments by adjusting to maintain its equilibrium.
4.3. Pre-ejection Period and its effect on rPTT
Where the higher end of r2 values were observed, there is still
a significant proportion of the variation in rPTT that is not explained by the variation in PTT. The remaining variation in rPTT must come from the time following the ECG R-wave, but before ejection of blood from the ventricle occurs. The ECG R-wave is the peak of the QRS complex and corresponds to ventricle depolarization, which initiates the chemical and mechanical onset of contraction. Once contraction is underway, the aortic valve is initially closed; during this period contraction is often thought of in the ideal case as being isovolumetric (Smith et al. 2005; Pironet et al. 2013; Guyton & Hall 2006).
As mentioned in Section 1, the combined electromechanical delay and isovolumetric contraction is known as the pre-ejection period (PEP) (Payne et al. 2006). The end of the PEP is defined as the aortic valve opening time (Pitson et al. 1994), which occurs when the ventricle pressure exceeds the aortic pressure. At this point the pulse wave begins its path past the catheter in the aortic arch. Thus, for any given beat in the pig experiments, the difference between rPTT and PTT should be the PEP plus a slight delay due to the aortic catheter being positioned in the aortic arch, which is set back slightly from the aortic valve.
Looking at Table 1, the difference between rPTT and PTT ranges from 49ms (Pig 7; control) to 94ms (Pig 2; high fluids). The aortic catheter was positioned close the aortic valve, suggesting a large range of PEP values of similar magnitude to the PTT observations, which is consistent with other literature using both human and animal subjects (Payne et al. 2006; Talley et al. 1971; Newlin & Levenson 1979). Furthermore, the bias caused by PEP has been observed before in studies utilizing the ECG R-wave as its initial indicator of contraction (Loukogeorgakis et al. 2002; Pitson et al. 1994; Fung et al. 2004). Hence, even modest variation in the PEP independent of PTT could explain the lack of a strong relationship between rPTT and PTT.
Variation in PEP poses an issue if rPTT was to be used as a less invasive surrogate for PTT measured using pressure measurements at two arterial sites. One solution is to measure rPTT over a longer distance so that the proportion of PEP to PTT is reduced (Fung et al. 2004). While this approach
would not remove the PEP bias, it would serve to reduce the effects of varying PEP on a PTT estimate based on rPTT. However, a common clinical motivator for calculating PTT was the determination of arterial stiffness, which increases as people age and is a predictor of future cardiovascular outcomes (Laurent et al. 2006; Blacher, Asmar, et al. 1999). The aorta is less stiff than the peripheral arteries, but shows a much larger change in stiffness over a human’s lifetime. Therefore, the aorta is the desired regional stiffness when making cardiovascular diagnostic predictions (Laurent et al. 2006; Nichols 2005; Nichols et al. 2011). Including the periphery in estimations of PTT from rPTT could lead to an overestimate in aortic arterial stiffness and incorrect diagnostic information.
There is scope still to analyse the relationship between PEP and PTT. If a strong relationship exists, one that appears to be population specific, it would be possible to measure rPTT and estimate PTT as a result. Else if PEP and PTT have a strong patient-specific correlation, rPTT may be limited to estimating ∆PTT. Finally, if PEP appears to be independent of changes in PTT, without an accurate measure of PEP, rPTT would be an unreliable substitute for the true pulse transit time.
The large range of rPTT-PTT observed across the four pigs suggests PEP is likely to be specific to each pig. Given the variability of rPTT, it seems likely that PEP will not show a strong relationship with PTT. Speculation aside, this analysis is still being conducted and remains to be validated over a larger, continuing trial with further subjects.
5. CONCULSION
The weak relationship found between PTT and rPTT suggests much of the variation in rPTT cannot be attributed to PTT. Although direct analysis of PEP is not shown in this study, the time difference between rPTT and PTT, for which a significant proportion is attributed to PEP, showed little consistency between pigs and intervention stages. As a result, this work comes to a similar conclusion to that completed by Payne et al 2006. Specifically, despite advances in processing, rPTT is unsuitable as a direct measure of PTT and is also a poor surrogate.
However, this conclusion does not render rPTT entirely useless. Further analysis needs to be completed to understand the relationship between PEP and PTT. If this relationship exists in strength, there is still the possibility of at least measuring changes in PTT by monitoring rPTT.
REFERENCES
Blacher, J., Asmar, R., et al., 1999. Aortic Pulse Wave Velocity as a Marker of Cardiovascular Risk in Hypertensive Patients. Hypertension, 33, pp.1111– 1117.
Blacher, J., Guerin, A.P., et al., 1999. Impact of aortic stiffness on survival in end-stage renal disease.
Circulation, 99(18), pp.2434–2439.
Cecconi, M. et al., 2014. Consensus on circulatory shock and hemodynamic monitoring. Task force of the European Society of Intensive Care Medicine. Intensive Care
Medicine, 40(12), pp.1795–1815.
Dogui, A. et al., 2011. Consistency of aortic distensibility and pulse wave velocity estimates with respect to the Bramwell-Hill theoretical model: a cardiovascular magnetic resonance study. Journal of Cardiovascular
Magnetic Resonance, 13(1), p.11.
Ellender, T.J. & Skinner, J.C., 2008. The Use of
Vasopressors and Inotropes in the Emergency Medical Treatment of Shock. Emergency Medicine Clinics of
North America, 26(3), pp.759–786.
Fung, P. et al., 2004. Continuous noninvasive blood pressure measurement by pulse transit time. Conference
proceedings : ... Annual International Conference of the IEEE Engineering in Medicine and Biology Society. IEEE Engineering in Medicine and Biology Society. Conference, 1(4), pp.738–741.
Guyton, A. & Hall, J., 2006. Textbook of Medical Physiology 11th ed., Philadelphia: Elsevier Saunders.
Hannon, J.P., Bossone, C.A. & Wade, C.E., 1990. Normal physiological values for conscious pigs used in
biomedical research. Laboratory animal science, 40(3), p.293—298.
Kamoi, S. et al., 2015. Relationship between Stroke Volume and Pulse Wave Velocity. IFAC-PapersOnLine, 48(20), pp.285–290.
Laurent, S. et al., 2006. Expert consensus document on arterial stiffness: Methodological issues and clinical applications. European Heart Journal, 27(21), pp.2588–2605.
Loukogeorgakis, S. et al., 2002. Validation of a device to measure arterial pulse wave velocity by a
photoplethysmographic method. Physiological
measurement, 23, pp.581–596.
Luecke, T. & Pelosi, P., 2005. Clinical review: Positive end-expiratory pressure and cardiac output. Critical care
(London, England), 9(6), pp.607–21.
Marik, P.E., 2010. Hemodynamic parameters to guide fluid therapy. Transfusion Alternatives in Transfusion
Medicine, 11(3), pp.102–112.
Marik, P.E., 2013. Noninvasive cardiac output monitors: A state-of the-art review. Journal of Cardiothoracic and
Vascular Anesthesia, 27(1), pp.121–134.
Michard, F. & Teboul, J., 2002. Predicting Fluid Responsiveness in ICU Patients. Chest, 121(6), pp.2000–2008.
Millasseau, S.C. et al., 2005. Evaluation of carotid-femoral pulse wave velocity: Influence of timing algorithm and heart rate. Hypertension, 45(2), pp.222–226.
Newlin, D.B. & Levenson, R.W., 1979. Pre-ejection period: measuring beta-adrenergic influences upon the heart.
Psychophysiology, 16(6), pp.546–553.
Nichols, W.W., 2005. Clinical measurement of arterial stiffness obtained from noninvasive pressure waveforms. American Journal of Hypertension, 18(1 SUPPL.), pp.3–10.
Nichols, W.W., O’Rourke, M.F. & Vlachopoulos, C., 2011. Aging. In McDonald’s blood flow in arteries;
theoretical, experimental and clinical principles. CRC
Press, pp. 412–446.
Payne, R. a et al., 2006. Pulse transit time measured from the ECG: an unreliable marker of beat-to-beat blood pressure. Journal of applied physiology (Bethesda,
Md. : 1985), 100(1), pp.136–141.
Pironet, A. et al., 2013. A multi-scale cardiovascular system model can account for the load-dependence of the end-systolic pressure-volume relationship. Biomedical
engineering online, 12, p.8.
Pitson, D. et al., 1994. Changes in pulse transit time and pulse rate as markers of arousal from sleep in normal subjects. Clinical Science, 87, p.269 273.
Ruffolo, R.R., 1987. Review: The Pharmacology of Dobutamine. The American Journal of the Medical
Sciences, 294(4), pp.244–248.
Smith, B.W. et al., 2005. Experimentally verified minimal cardiovascular system model for rapid diagnostic assistance. Control Engineering Practice, 13(9), pp.1183–1193.
Talley, R.C., Meyer, J.F. & McNay, J.L., 1971. Evaluation of the pre-ejection period as an estimate of myocardial contractility in dogs. The American Journal of
Cardiology, 27(4), pp.384–391.
Young, J.D., 2004. The heart and circulation in severe sepsis.