Publisher’s version / Version de l'éditeur:
Vous avez des questions? Nous pouvons vous aider. Pour communiquer directement avec un auteur, consultez la
première page de la revue dans laquelle son article a été publié afin de trouver ses coordonnées. Si vous n’arrivez pas à les repérer, communiquez avec nous à [email protected].
Questions? Contact the NRC Publications Archive team at
[email protected]. If you wish to email the authors directly, please see the first page of the publication for their contact information.
https://publications-cnrc.canada.ca/fra/droits
L’accès à ce site Web et l’utilisation de son contenu sont assujettis aux conditions présentées dans le site LISEZ CES CONDITIONS ATTENTIVEMENT AVANT D’UTILISER CE SITE WEB.
Ice in the Environment: Proceedings of the 16th IAHR International Symposium on Ice, Dunedin, New Zealand, 2nd–6th December 2002, 2002
READ THESE TERMS AND CONDITIONS CAREFULLY BEFORE USING THIS WEBSITE. https://nrc-publications.canada.ca/eng/copyright
NRC Publications Archive Record / Notice des Archives des publications du CNRC : https://nrc-publications.canada.ca/eng/view/object/?id=12de86c9-bdf9-4c3b-af74-dd39e54b51e0 https://publications-cnrc.canada.ca/fra/voir/objet/?id=12de86c9-bdf9-4c3b-af74-dd39e54b51e0
NRC Publications Archive
Archives des publications du CNRC
This publication could be one of several versions: author’s original, accepted manuscript or the publisher’s version. / La version de cette publication peut être l’une des suivantes : la version prépublication de l’auteur, la version acceptée du manuscrit ou la version de l’éditeur.
Access and use of this website and the material on it are subject to the Terms and Conditions set forth at
Ice damage and layer formation in small-scale indentation experiments Barrette, Paul; Pond, John; Jordaan, Ian
Ice in the Environment: Proceedings of the 16th IAHR International Symposium on Ice Dunedin, New Zealand, 2nd–6th December 2002
International Association of Hydraulic Engineering and Research
ICE DAMAGE AND LAYER FORMATION
IN SMALL-SCALE INDENTATION EXPERIMENTS
Paul Barrette1, John Pond1 and Ian Jordaan1
ABSTRACT
The failure of high pressure zones at the interface between ice and an indenting structure is known to be accompanied by cyclic loading. This cyclic activity has been related to the dynamic nature of the deformation taking place within a layer of damaged ice at the ice-structure interface. An experimental program involving the interaction between granular, non-saline ice and a small indentor was initiated in our laboratory to provide additional information on the nature of the ice damage at that scale. This was done with a spherical indentor 20 mm in diameter and with a radius of curvature of 25.6 mm, at displacement rates of 2, 4 and 6 mm/s and for ice temperatures of –20, –10 and –2 °C. Microcracking and recrystallization textures, similar to those documented from the field, are observed, with the former becoming more abundant at low temperatures.
INTRODUCTION
The compressive failure of ice during an indentation event is known to be accompanied with load cycling and the extrusion of crushed ice from ‘high pressure zones’ at the ice-structure interface. These phenomena were reported from medium-scale test programs conducted in the field (Frederking et al., 1990, Masterson et al., 1993, 1999). Indent-ation experiments were done in the laboratory at a smaller scale (Gagnon, 1994a,b). These also resulted in similar load fluctuations during penetration. It is suspected that this phenomenon is identical to what may have occurred in March 1986, when the Molikpaq structure in the Beaufort Sea was subjected to dynamic loading from a moving ice pack (Jefferies and Wright, 1988).
The mechanisms responsible for this behavior have yet to be fully understood. This topic was investigated extensively over the last number of years by Jordaan and his collaborators (Jordaan and Xiao, 1992; Meaney et al., 1996; Jordaan, 2001, amongst others). These investigations have identified the existence of a damaged ice layer at the ice-structure interface, which is thought to control the dynamic response of the indentor. The purpose of this paper is to present some of the features documented to date in terms of ice damage and layer formation. It is also to report on the results of small scale
1
Ocean Engineering Research Centre, Memorial University of Newfoundland, St. John's, NL, Canada A1B 3X5
indentation tests conducted in our laboratory, with some information on the morphology of the ice near the ice-indentor interface.
ICE DAMAGE AND LAYER FORMATION
The indentation experiments of Barnes and Tabor (1966) documented a recrystallized texture at the ice-indentor interface. Cold temperature (–10 °C) tests induced a smaller
grain size and a shallower depth of the recrystallization zone than those done at –1.2 °C. Above that temperature, they provided evidence for pressure melting of the ice
followed by re-freezing. Barnes et al. (1971) also identified a zone of recrystallized ice that formed at the surface of a single crystal during sliding experiments, where the basal plane of the new crystals were oriented preferentially in the plane of sliding.
Kheisen and his co-workers (Kheisin and Cherapanov, 1970; Kurdyumov and Kheisin, 1976) were amongst the first investigators to document the fine grained nature of the damaged ice generated during impact tests. These were performed by dropping a 300 kg steel ball on an ice surface. They pointed out to the existence of ice particles of submicroscopic size dispersed amidst these crystals and acting as a ‘lubricant for the matrix’, resulting in a ‘finely dispersed crushed layer behaving as a layer of viscous liquid’. Attention was drawn to the effect of pressure melting and frictional heating. Kheisin’s work also led to the analysis of extrusion, treating the crushed layer as a viscous fluid, using essentially lubricant theory.
Ice blocks were retrieved by Sinha and Cai (1992) from the multi-year ice surface that was indented during the 1989 medium-scale test series, with a spherical indentor 1000 mm in diameter. These blocks sampled areas consisting of crushed ice as well as ‘blue zones’ – the latter made from what appeared to be undamaged ice similar to that occurring outside the indentation surface. The results of these investigations showed that the blue zones were characterized by extensive recrystallization textures. They report that ‘the demarkation boundary between intact ice and the crushed layer is remarkably distinct’. A similar observation was made by Muggeridge et al. (1999), who examined iceberg ice that was submitted to impact tests in the field.
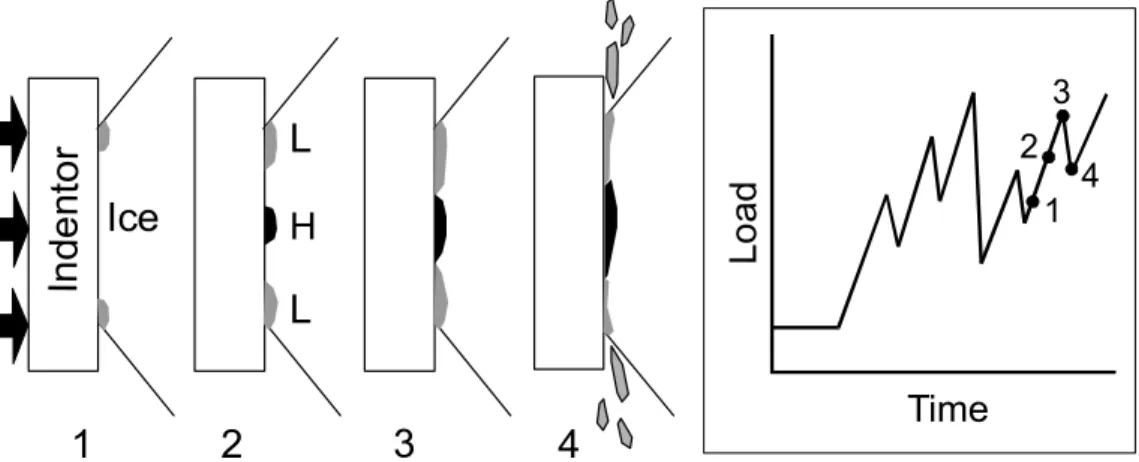
The occurrence of a layer of damaged ice along the interface with the indentor raises two fundamental issues, which an adequate analysis of an interaction event can not ignore. The first one is concerned with the origin of this feature. How was this layer formed? Why would the damage recorded in the ice manifest itself as intensely fractured zones in places, while in adjacent areas the damage is mostly characterized by a strong recrystallization texture? The second issue concerns the existence of this damage layer, how it would affect the energy transfer from the indentor into the ice and the potential link between this layer and the extrusion of ice. A model was developed by Jordaan and his co-workers, which attempts to reconcile evidence gathered from both field and laboratory test programs. Figure 1 shows some of the key elements that are part of this model, including the development of a damaged zone along the ice-structure interface and the resulting load cycling. The aim of the test program presented below is to establish what is the nature of this damage at a small scale and how it compares with that observed in the field. It is the first step of an ongoing effort to study the scaling of high pressure zones.
Time L o a d 1 2 3 4 1 2 3 4 In d e nto r Ice L H L
Figure 1: Sequence of events (left) leading to load cycling (right) during an interaction event. L: Low pressure area, H: High pressure area. Only one cycle is shown here. 1: Initiation of failure through brittle and semi-brittle mechanisms, 2: Initiation of failure involving ecrystallization textures, 3: Propagation of f ; 4: Extrusion and load drop.
pressure melting and leading to r ailure zones
LABORATORY TEST PROGRAM Experimental procedures
The ice was produced from distilled, de-ionized water. Several liters of this water were frozen in a clean bucket, and the resulting ice was crushed and sieved between mesh sizes of 3.35 and 4.75 mm. This ice, used as seeds, was then stored at –15 °C. A given amount of it was later put in cylindrical molds 150 mm in internal diameter and 60– 130 mm in height. The bottom of the molds was a thin plastic membrane secured around the mold with a rubber band. The seeds were then flooded with water at a temperature lying between 5 and 10 °C. This mixture was stirred so as to allow the seeds to form a uniform ice cover, varying in thickness between 10 and 30 mm, in each of the molds. These were then laid on top of a styrofoam sheet and its content allowed to freeze at –15 °C. In the process, the lower surface of the ice, which was against the plastic membrane, bulged. The plastic was removed and the bulge was leveled down flush with the lower part of the steel mold by rubbing it against a flat steel plate at room temperature. All molds were then left overnight in a cold room set to the target test temperature and in which mechanical testing was done. A second ice type was also used. It was produced by freezing unseeded water in the mold, yielding large crystals with vertical c-axes.
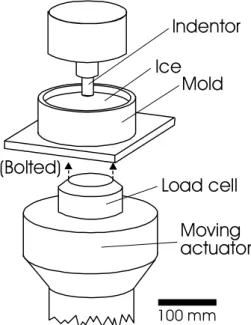
The indentor, made from soft steel, was reasonably smooth although localized rusting was observed prior to some tests. It had a diameter of 20 mm and a spherical surface with a radius of curvature of 25.6 mm. This represents a scaled-down version of the spherical indentor used in the field (Frederking et al., 1990), with a reduction factor of 50. It was mounted on a Materials Testing Systems (MTS) test frame (Fig. 2) which was housed in a cold room. The ram was controlled using MTS Test Star II software, operated on a 486 microprocessor-based computer with an OS/2 platform. The computer and software also performed data acquisition. Penetration depth for all tests was 2.6 mm. Indentation velocity ranged from 0.1 to 10 mm/s, but the tests reported herein were done at 4 mm/s. Target test temperatures were –20, –10 and –2 °C. This was achieved by leaving the ice specimens in the cold room set at one of these temperatures, for at least 15 hours.
After each test, the mold and the indented ice it contained were stored at –15 °C. A day or two later, they were taken out of the deep freeze and a hair dryer was used to warm up the steel walls of the mold just enough to let the ice slip out of it. The upper surface of the ice was thermally insulated during this process. We still expect the temperature of that surface to have increased somewhat but not considerably, given the thermal inertia of the ice specimen.
The ice was then stored again at –15 °C for a day, and transferred to a cold room where the double microtoming technique described by Sinha (1977) was used to produce thin sections. Throughout this procedure, care was taken not to disturb the indented surface. The orientation of these sections was perpendicular to the indented surface. They were cut so as to intersect the center of the indentation zone. Non digital colour photographs of the sections were taken between cross-polarized light and in plane polarized transmitted light. Light reflected from the side was also used to bring out free surfaces such as individual cracks and bubbles. Zones with uniformly scattered light indicated intense microcracking (Meglis et al., 1999).
Results
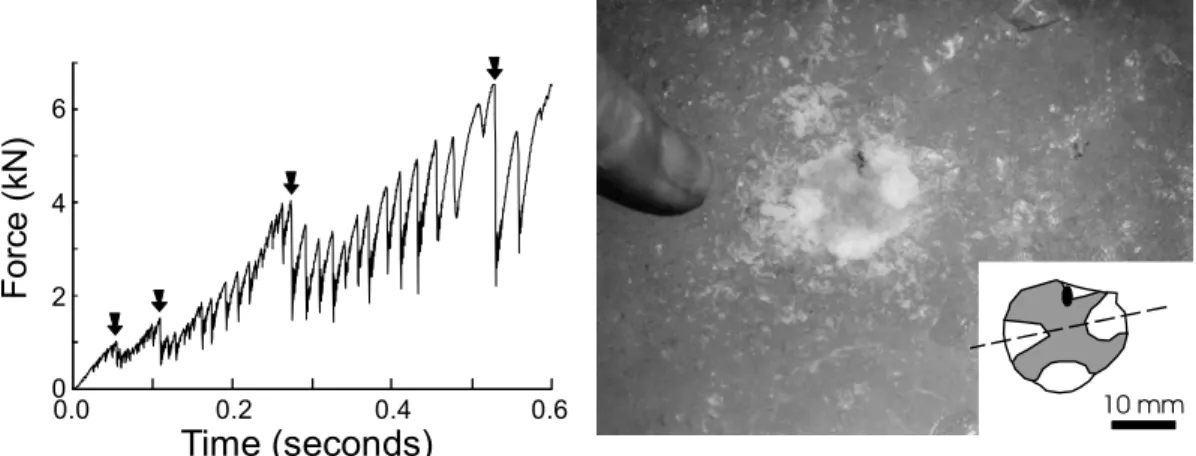
All tests gave rise to load cycling, with peak frequencies in the order of 50–100 Hz (Fig. 3, left). In all cases, fine-grained, pulverized ice was produced as a result of the interaction. This process was accompanied by a high-frequency crackling sound. A variation in the size of the particles was observed between tests, ranging from a sub-mm, powder-like material to fragments up to 4 mm in maximum dimension. The indented ice surface was characterized by a dark zone varying in shape and surface area, surrounded by lighter areas defined by crushed ice (Fig. 3, right). In some cases, distinct radial cracks were generated during the indentation event, which extended from the contact point to the edge of the mold. Thin section analysis has indicated that the darker areas along the indentation surface are underlain by recrystallized ice. The lighter areas, on the other hand, are mostly characterized by a network of microcracks so dense that individual fracture surfaces are not resolvable at the scale of our observations.
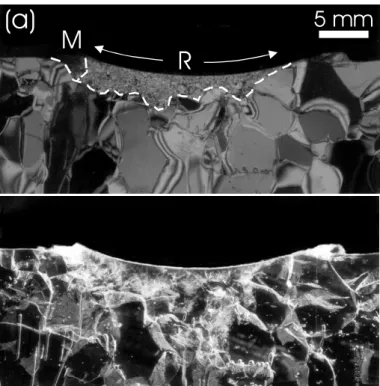
Figure 4 displays sections from tests done at three different temperatures. All showed the presence of a layer of damaged ice, which appeared in the form of microcracking or grain refinement. The latter is referred to as recrystallization in that it is defined by new crystals, as indicated by a difference in birefringence colour between neighboring grains, without evidence for intercrystalline cracking. The damage zone extended to a maximum depth of 4–5 mm for all cases. The high temperature test (–2 °C) yielded mostly fine grained ice with little evidence of microcracking. The test conducted at –10 °C (also documented in Fig. 3) shows a central recrystallized zone, with minor cracking, and microcracking on either side. The –20 °C test led predominantly to microcracking. Cracks also formed more locally well below the damage layer, some
Ice Indentor Mold (Bolted) Load cell Moving actuator 100 mm Figure 2: Schematics of test set-up.
0.0 0.2 0.4 0.6 Time (seconds) F o rc e ( k N ) 0 2 4 6 10 mm
Figure 3: Left) Load trace for an indentation test done at -10 C and a displacement rate of 4 mm/s. Arrows indicate larger drops in load. Right) Ice surface for this test, showing a dark grey, cross-shaped zone (shaded area in the inset) in a light, crushed ice matrix. The dotted line indicates the orientation of the section in Fig. 4b. A rust stain left by the indentor is visible in the upper center.
o
occurring along the grain boundaries of the original ice crystal assemblage, others running across them. In thin sections, these cracks had two predominant orientations: parallel to the indentation surface and extending away from it in a radial fashion. A recrystallization texture was also observed below the damage layer. It occurred preferentially along grain boundaries.
DISCUSSION
The features we observe in the indented ice surface are remarkably similar to those reported by Sinha and Cai (1992) from a medium-scale field testing program, namely the occurrence of a damage zone in the ice near the interface with the indentor. This is particularly the case for a test temperature of –10 °C, where the resulting damage was divided into a recrystallized zone surrounded with crushed ice. Recrystallization may be present also in the crushed zones but it can not be identified due to the dense network of cracks. The temperature of the ice surface reported for the field tests was about –14 °C (Frederking et al., 1990). The thickness of the damaged zone in our ice appears to represent a scaled-down version of what it was in the field, where a thickness of up to 200 mm was observed.
Pressure melting is probably effective in our indentation experiments as well, especially those done at the higher temperature. In fact, the variation in internal structure of the ice as a function of temperature reported herein is not unlike Barnes and Tabor’s (1966) findings. But it is unclear as to how much of the grain refinement we observe involves dynamic recrystallization as opposed to partial melting followed by re-freezing.
The grain size has not been scaled down in our experiments and it is legitimate to wonder how this parameter affects deformation. For instance, how much control do grain boundaries exert on the amount of cracking and recrystallization? Does this parameter have an influence on the size of the fragments making up the extruded ice? It is suspected that the larger load drops (Fig. 3) occurred as a result of the larger cracks observed below the damaged layer. On the other hand, some of these cracks may have been produced during specimen manipulation and thin sectioning.
Figure 4: Vertical thin sections for tests carried out at a) -2 C, b) -10 C and c) -20 C. The photographs are taken with cross polarized light (upper) and plane polarized with scattered light reflected from the side (lower). Damage development is outlined with a dotted white line in the upper photograph (R: Recrystallization, M: Microcracking). In (c), a portion of the damage zone was removed during thin sectioning.
o o o
(a)
5 mm
R
M
Figure 4: (Cont )d
CONCLUSION
The interaction between a small spherical indentor with non-saline, granular ice led to the production of a damage layer extending to a maximum depth of 4–5 mm below the surface of indentation. For tests done at –2 °C, this zone was characterized by a uniform grain refinement along most of the ice-indentor interface. For tests done at –10 °C, the damage was divided into recrystallized areas, with a dense network of microcracks on either side. For tests done at –20 °C, microcracking predominated. The features observed in our experiments, particularly those from testing done at –10 °C, are nearly identical to what is reported elsewhere from a medium-scale field testing program with an ice surface at –14 °C. This is a strong indication that the deformation mechanisms operating at both scales are similar in nature.
ACKNOWLEDGMENT
Permission to use the NRC cold room facility in St. John’s is gratefully acknowledged. Financial support was provided by the Natural Sciences and Engineering Research Council of Canada (NSERC), the Government of Canada through the Program on Energy Research and Development (PERD), and the Canada-Newfoundland Offshore Development Fund.
REFERENCES
Barnes, P. and Tabor, D. Plastic flow and pressure melting in the deformation of ice I.
Nature 210: 878–882 (1966).
Proceedings of the Royal Society of London A324: 127–155 (1971).
Frederking, R.M.W., Jordaan, I.J. and McCallum, J.S. Field tests of ice indentation at medium scale Hobson’s Choice Ice Island. In Proceedings of the 10th International Association for Hydraulic Engineering and Research Symposium, Vol. 2, Espoo
(1990) 931–944.
Gagnon, R.E. Generation of melt during crushing experiments on freshwater ice. Cold
Regions Science and Technology 22: 385–398 (1994a).
Gagnon, R.E. Melt-Layer thickness measurements during crushing experiments on fresh-water ice. Journal of Glaciology 40: 119–124 (1994b).
Jefferies, M.G. and Wright, W.H. Dynamic response of “Molikpaq” to ice-structure interaction. In Proceedings of the 7th Conference on Offshore Mechanics and Arctic Engineering, Vol. 4, Houston (1988) 201–220.
Jordaan, I.J.. Mechanics of ice-structure interaction. Engineering Fracture Mechanics 68: 1923–1960 (2001).
Jordaan, I.J. and Xiao, J. Interplay between damage and fracture in ice-structure interaction. In Proceedings of the 11th International Association for Hydraulic Engineering and Research Symposium, Vol. 3, Banff (1992) 1448–1467.
Kheisin, D.E. and Cherepanov, N.W. Change of ice structure in the zone of impact of a solid body against the ice cover surface. In Problems of the Arctic and Antarctic, Issues 33–35 (A.F. Treshnikof), Israel Program for Scientific Translations (1970) 239–245. Kurdyumov, V.A. and Kheisin, D.E. Hydrodynamic model of the impact of a solid on ice.
Prikladnaya Mekhanika 12(10): 103–109 (1976) [Transl.].
Masterson, D.M., Frederking, R.M.W., Jordaan, I.J. and Spencer, P.A. Description of multi-year ice indentation tests at Hobson’s Choice Ice Island – 1990. In Proceedings
of the 12th Conference on Offshore Mechanics and Arctic Engineering, Vol. 4,
Glascow (1993) 145–155.
Masterson, D.M., Spencer, P.A., Nevel, D.E. and Nordgren, R.P. Velocity effects from multi-year ice tests. In Proceedings of the 18th Conference on Offshore Mechanics and Arctic Engineering. St. Johns, Newfoundland (1999) 1–27.
Meaney, R., Jordaan, I.J. and Xiao, J. Analysis of medium scale ice-indentation tests. Cold
Regions Science and Technology 24: 279–287 (1996).
Meglis, I.L., Melanson, P.M. and Jordaan, I.J. Microstructural change in ice: II. Creep behavior under triaxial stress conditions. Journal of Glaciology 45: 438–448 (1999). Muggeridge, K.J. and Jordaan, I.J. Microstructural change in ice III. Observations from an
iceberg impact zone. Journal of Glaciology 45: 449–456 (1999).
Sinha, N.K. Technique for studying the structure of sea ice. Journal of Glaciology 18: 315–323 (1977).
Sinha, N.K. and Cai, B. Analysis of Ice from Medium-Scale Indentation Tests. NRC Laboratory Memorandum IME-CRE-LM-002 (1992) 63p.