HAL Id: hal-01575692
https://hal.archives-ouvertes.fr/hal-01575692
Submitted on 19 Nov 2019
HAL is a multi-disciplinary open access
archive for the deposit and dissemination of
sci-entific research documents, whether they are
pub-lished or not. The documents may come from
teaching and research institutions in France or
abroad, or from public or private research centers.
L’archive ouverte pluridisciplinaire HAL, est
destinée au dépôt et à la diffusion de documents
scientifiques de niveau recherche, publiés ou non,
émanant des établissements d’enseignement et de
recherche français ou étrangers, des laboratoires
publics ou privés.
Sylvain Payraudeau, Flavie Cernesson, Marie-George Tournoud, Keith J.
Beven
To cite this version:
Sylvain Payraudeau, Flavie Cernesson, Marie-George Tournoud, Keith J. Beven. Modelling nitrogen
loads at the catchment scale under the influence of land use. Physics and Chemistry of the Earth,
Elsevier, 2004, 29 (11-12), pp.811-819. �10.1016/j.pce.2004.05.008�. �hal-01575692�
Modelling nitrogen loads at the catchment scale under the
influence of land use
S. Payraudeau
a, F. Cernesson
b, M.G. Tournoud
a, K.J. Beven
ca Hydrosciences Montpellier, UMR5569 UM2 – CNRS – IRD – UM1, Maison des Sciences de l’Eau, Universite Montpellier 2,
Montpellier 34095, France
b Laboratoire Structures et Syst emes Spatiaux, CEMAGREF-ENGREF, 500 av. J.F. Breton, Montpellier 34093, France c Department of Environmental Science, Lancaster University, Lancaster LA1 4YQ, UK
Accepted 24 May 2004
Introduction
Water quality models generally require large quanti- ties of different types of data: meteorological variables (rainfall, air temperature, . . .) for the forcing processes, spatial data (altitude, soil, land use, . . .) for the description of the basin and human activities (waste water, agriculture water use, fertilizing calendar, . . .). All these data are subject to uncertainties that can have significant effects on the model results. Thus evaluation of confidence in the model predictions should be a re- quired step for modellers (Beven and Freer, 2001; Bev- en, 2002). The uncertainties on physical data (such as rainfall) are commonly analysed (see among others
Bertoni, 2001). For spatial data such as land use maps, difficulties arise because the uncertainties are closely linked to the sophisticated methods used for obtaining the data.
Different sources of information are valuable for land use characterisation: field observations, aerial photo- graphs or remotely sensed data. Only remotely sensed data allow land use classification with automatic or semi-automatic routines on large areas (Schultz, 1993), which is why it is now the main source for land use data. The quality of land use maps depends on numerous factors including the quantity of available scenes and the dates at which they were taken, the relief of the study area and the character of its landscape, the sensor characteristics, the classification techniques and, of course, the choice of the land use categories.
Thus to obtain an accurate classification of a scene is a complex process. Land use maps resulting from scene
interpretation are subject to positional or categorical uncertainties (Girard and Girard, 1999). The positional uncertainties are due to the difficulties in detecting the boundaries of the object (Goodchild, 1993). The cate- gorical uncertainties correspond to the errors in the land use type associated with a pixel (Girard and Girard, 1999). These positional and categorical uncertainties in land use data have significant effects on the results of hydrological (Bertoni, 2001) and water quality models (Eckhardt et al., 2003).
Model confidence can be evaluated in two steps: the first step, called sensitivity analysis, analyses the sensi- tivity of the model responses to variations in the input data; the second step, called uncertainty analysis, studies the propagation of the uncertainties in the input data on the response of the model. These two methods are dif- ferent in terms of concepts but use similar tools (Chang et al., 1993).
In this paper, we develop a methodology to test the confidence of a water quality model to land use data uncertainties. The analysis is focused on categorical er- rors for agricultural land use categories and both a sensitivity analysis and an uncertainty analysis are ap- plied successively. The test is conducted with the water quality model POL on the Pallas river (France).
2. Methodology
2.1. Land use data specificities
In land use maps, three general categories of land use are distinguished: urban area, natural area and agri- cultural area. Since farming lands are the most impor- tant in water quality modelling (particularly for nitrogen or phosphorus modelling) we chose to focus on the categorical uncertainties on agricultural zones. We studied four types of farming: vineyard, orchard, mar- ket gardening and cereal. We characterised the uncer- tainties using confusion matrices based on the process of generating the land use map from remote sensing images.
The confusion matrix gives the number of pixels that are well- or misclassified, comparing the interpreted image to a reference field data set (Campbell, 1996). The confusion matrix elements can be written using absolute or relative (standardised) values, by dividing the element
In this work, we use confusion matrices, standardised by the reference data set categories, that allow categor- ical errors due to the classification to be represented in applying the POL model.
2.2. Model description
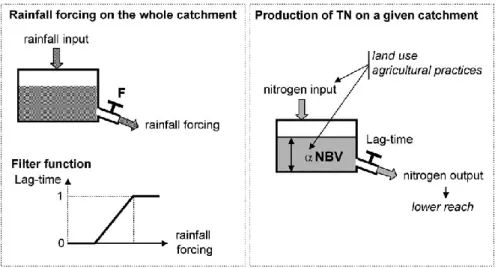
The water quality model POL generates the catch- ment response to a rainfall event in terms of total nitrogen (TN) fluxes. The confidence of the model will be studied on the TN load at the catchment outlet and on the duration of the pollution event (Fig. 1).
The model is based on a semi-distributed approach, so that the spatial variability of human activities can be taken into account. DEM data, a land use map, infor- mation on agricultural practices, specification of nitro- gen point sources and rainfall data are required. The catchment is delineated into hydrological units (Rodri- guez-Iturbe and Gupta, 1983)––sub-catchments and river reaches––for which geomorphological characteris- tics (area, slopes, length) and land use properties are defined (Payraudeau et al., 2001). Nitrogen point sour- ces (such as sewage treatment plants) are defined as di- rect inputs in the river.
Two processes are considered in the model: (i) the production of TN loads by the sub-catchments during the rainfall event and (ii) the transport of these TN loads along the river reaches. Two simplifying assumptions are made in representing the complex processes of nitrogen delivery to the catchment outlet: (i) the rainfall triggers the TN mobilisation on the surface of the sub- catchments; (ii) TN loads are conservative along the river reaches during the event.
The production of TN on a given sub-catchment is represented by a simple linear reservoir. At the begin- ning of the rainfall event, the reservoir content is a proportion (/) of the initial nitrogen stock NBV on the whole catchment. The proportion / is the ratio of agricultural areas on the sub-catchment to those on the catchment. NBV is the first parameter of the model. To reduce the number of parameters to be estimated, the
Rainfall (mm/h)
Time
of this column (or row). Written in standardised form, the confusion matrix for a perfect classification is a diagonal matrix with 100% for each diagonal element and 0% for the other elements. If we can consider that there is no influence due to the sampling of the field data set, the confusion matrix is perfectly known. Then, it is possible to estimate, on the whole basin, the true area of each land use category using the confusion matrix.
(kg-N/h) TN load (kg)
10 %
Event duration (h)
Fig. 1. TN flux variables definition. Time
Fig. 2. Formalisation of TN production on the a sub-catchment.
lag-time of the reservoir is assumed to be the same for all the sub-catchments. It is related to the rainfall event, through a filter function for which a coefficient F is the second parameter of the model (Fig. 2).
The transport of TN fluxes along a river reach is represented by a series of linear reservoirs. The number of reservoirs depends on the length of the reach, and it is assumed that one elementary reservoir is needed for a 900-m long reach. The lag-time T of the reservoirs is assumed to be the same for all the reaches. It is the third parameter of the model (Fig. 3).
The variability of the three parameters has been studied for various rainfall events on different small catchments in the South of France (Payraudeau, 2002). It has been shown that (i) the filter coefficient F can be set at a common value to all catchments and events; (ii) the river lag-time T can be statistically related to the duration of the rainfall event and the total rainfall amount in the 30 days before the event; (iii) the initial stock NBV can be related to the farming types and the
Transport of TN on a given catchment
point sources nitrogen input
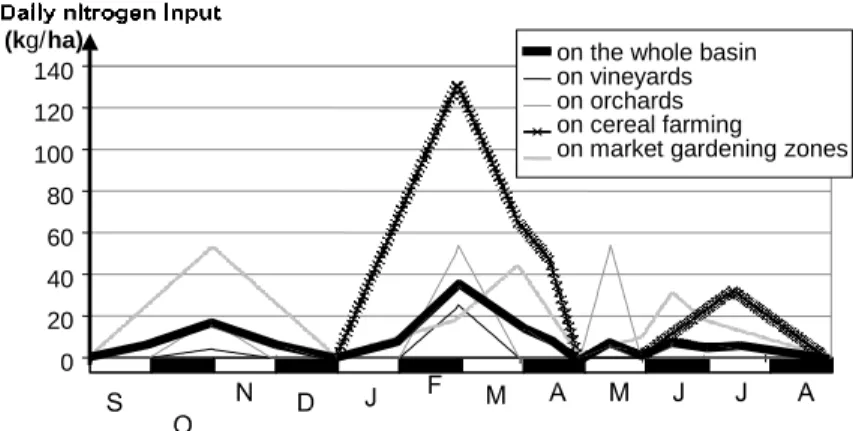
agricultural practices, by linear relationships that are also assumed to be the same throughout the catchment. The initial stock NBV is a simple function of the mean of the daily nitrogen fertilizer inputs for each type of farming, weighted by their respective areas on the whole catchment. A fuzzy approach was used to distribute the annual fertilizer inputs on a daily basis during the fer- tilizing period, as shown in Fig. 4. These estimations of the POL model parameters provide acceptable simula- tions of nitrogen loads (Payraudeau, 2002) and can be used for the sensitivity analysis and the uncertainty analysis.
2.3. Evaluation of the model confidence
Different statistical methods (correlation analysis, sensitivity indices, Monte-Carlo based method as Gen- eralised Likelihood Uncertainty Estimation method) can be used to study the model behaviour under the influence of model input errors (see among others, Helton, 1993; Yulianty et al., 1999; Beven, 2001; . . .).
In this paper, the model confidence is evaluated by comparisons between model responses during rainfall events in terms of event load and duration at the basin outlet for simulated or true land use maps. The criteria of the sensitivity analysis are chosen as ratios:
load/ref-upstream reach nitrogen input
upper catchment nitrogen input
erence load and duration/reference duration. The refer- ence values are the model responses for the available land use map.
T
nitrogen output downstream reach
Fig. 3. Formalisation of TN transport in a river reach.
2.3.1. Sensitivity analysis
To test the sensitivity of the model response to land use means to identify if this input is important or not in the modelling.
Some recent papers present analysis of sensitivities of land use data on water quality models. Eckhardt et al. (2003) studied step by step the evolution of SWAT-G model responses to uniform land use on the whole
(kg/ha) 140 120 100 80 60 40 20 0
on the whole basin on vineyards on orchards on cereal farming on market gardening zones
Fig. 4. NBV determination.
catchment and to some other radical changes. Crosetto et al. (2000) defined sensitivity indices based on many simulations of landscape. We choose to compare the model responses according different simulations based on four uniform land use data sets (one for each agri- cultural category), in a similar way to the study of Eckhardt et al. (2003).
2.3.2. Uncertainty analysis
From the point of view of a modeller, land use map uncertainties are related to the resolution, the choice of the categories, the sampling of the reference data set or to the interpretation bias. The effects of resolution and choice of categories on hydrological models have al- ready been analysed (Payraudeau et al., 2003; Cotter et al., 2003; . . .). The errors due to the image interpre- tation or to the sampling of the reference data set are dealt with by remote sensing specialists (Lewis et al., 2000; Hubert-Moy et al., 2001; Girard and Girard, 1999; . . .) with the aim of proposing some methods to reduce the categorical uncertainties.
Here, we generate multiple realisations of the catch- ment land use map. These realisations are not built pixel by pixel, considering some land use attributes, but are obtained using generated proportions of agricultural land use on the catchment by random sampling in a way consistent with the confusion matrix. This method is compatible with the assimilation of land use data in the POL model. The distribution of the responses of POL model corresponding to the different land use maps is then studied relative to the reference response.
3. Results
3.1. The application site
The Pallas river, located in the South of France, drains an area of 52 km2 . It is a rural basin, with a
sparse population and no significant industrial activity.
The available land use data take into account seven categories: natural, urban and mining areas plus four agricultural classes. As a recent study indicated no sig- nificant change of urban and natural areas (AME-Di- ren, 2000), CORINE land cover data (I.F.E.N., 1988) are used to classify the non-agricultural areas. The agricultural land use map results from the supervised classification of a multispectral image obtained on May 30th 1996 by the SPOT 3 sensor, with a spatial resolu- tion of 20 m · 20 m (Sagot, 1999). Agricultural areas cover 52% of the whole basin. The disused mining area (2 km2 ) is of no importance for the nitrogen dynamics
that are studied here. This remote sensing classification is considered as the reference land use map (Fig. 5). The confusion matrix (Table 1) has been built according to field data collected in 1996 (Sagot, 1999). The confusion matrix shows that only two-thirds of the pixels are correctly classified in the land use map. The main con- fusion is the misclassification of vineyard, market gar- dening and cereal areas; for example, respectively 20% and 12% of the real surface of the vineyard are classified into market gardening and cereal on the map. Agricul- tural practice data were collected by surveys (Table 2).
The POL model was run with the values of the three parameters as described previously on three rainfall events, with the reference land use map. The reference results are summarised in the Table 3. The estimated values of the daily amount of fertilizer for each culti- vation type and for each event are presented Table 4, they allow the calculation of the initial stock NBV. 3.2. Sensitivity analysis
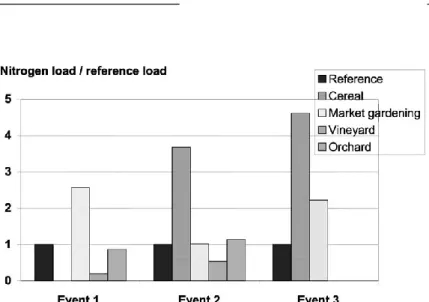
The sensitivities of the model results to uniform land use are shown in Fig. 6 for the nitrogen load and in Fig. 7 for the event duration. The nitrogen load is very sen- sitive to changes in the uniform land use whereas the event duration sensitivity to uniform land use is lower.
Uniform land use affects only the nitrogen production in the subcatchments but does not change the nitrogen
68 Market gardening 20 66 7 4 Orchard 0 0 64 12 Cereal 12 2 12 62 24 100 102 134
Fig. 5. Pallas basin: land use map obtained from CORINE land cover and a SPOT image classification (Sagot, 1999).
Table 1
Standardised confusion matrix corresponding to the agricultural classification (Sagot, 1999) Field data
Interpreted data
Categories Vineyard
Vineyard Market gardening 32 Orchard 17 Cereal 22 100% 100% 100% 100% Table 2
Agricultural practices: fertilisation inputs and calendar (Chambre d’Agriculture, 2000)
J F M A M J J A S O N D Nitrogen inputs kg/ha/year Vineyard Market gardening Orchard Cereal Table 3
Reference results of the model output variables and of the initial stock NBV for the three studied rainfall events
Date Rainfall (mm) Total nitrogen load (kg) Event duration (h) NBV (kg/ha)
Event 1 19/10/1994 119 8146 95 13
Event 2 13/03/1996 55.6 3372 92 28.3
Table 4
Reference values of the daily amount of fertilizer for each cultivation type and for each event
Date Cereal Daily amount of fertilizer (kg/ha) for
Market gardening Vineyard Orchard
Event 1 19/10/1994 0 43.1 2.5 11.3
Event 2 13/03/1996 104.9 28.8 15.1 32.3
Events 3 22/04/1996 24 11.2 0 0
Fig. 6. Nitrogen load for uniform land use.
Duration / reference duration 1.5 Reference Cereal Market gardening Vineyard Orchard 1 0.5 0
Event 1 Event 2Event 3
Fig. 7. Event duration for uniform land use.
transport in the river. That may explain the weak sen- sitivity of event duration to uniform land use.
Focusing on nitrogen load (Fig. 6), we notice two variations: between the cultivation types and between events. These variations are explained by the variation of NBV.
Thus for Event 1, there is no nitrogen fertilisation input during this period on the cereal areas (Table 4) and the simplistic method retained to estimate NBV assumes that all the inputs are used by the cultivation
type, or leached during the fertilizing period. Therefore NBV and the model outputs are null for this land use scenario. The other scenarios lead to various nitrogen loads between 19% for vineyard and 256% for market gardening, relative to the reference load.
For Event 2, the maximal nitrogen load is obtained with the cereal scenario corresponding to 368% of the reference load. The minimal nitrogen load corresponds to the vineyard scenario with 54% of the reference load. The nitrogen load values for market gardening (102%)
and orchard (114%) scenarios are close to the reference nitrogen load value.
For Event 3, the maximal nitrogen load values are obtained for cereal (462%) and market gardening (223%) scenarios. There are no fertilisation input on the vineyards and orchards;. consequently the nitrogen load is null for these two scenarios.
3.3. Uncertainty analysis
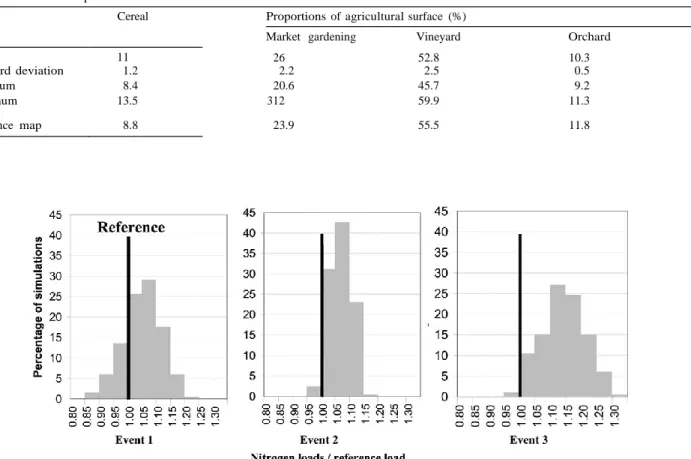
Two hundred realisations of the land use map are generated to analyse the effects of categorical uncer- tainties in land use. A summary of the descriptive sta- tistics of the simulated proportions of agricultural land use on the catchment and the proportions stemming from the reference land use map are supplied Table 5. It shows some trends: small difference of the orchard sur- faces, overestimation of the cereal and market gardening areas, and underestimation of the vineyard surfaces. For the rest of the analysis, we prefer to use the misclassifi- cation of each land use category (expressed as a pro- portion of the agricultural surface) by the difference of a simulated land use proportion to the corresponding reference proportion. These misclassifications can be
positive or negative, and their sum is obviously equal to 0. We propose a misclassified surface index (MSI) as the sum of the positive differences. For the realisation set presented in this paper, MSI is bounded by 1% and 10%, which means that from 1% to 10% of the total agricul- tural area are misclassified.
Fig. 8 shows the frequency distribution of nitrogen loads in comparison with the reference nitrogen load for the three events. The results for the event duration are not shown but, as in the sensitivity analysis, the event duration is not very sensitive to the land use variation: the maximal difference is less than 4% for the three events. The low impact of categorical land use uncer- tainty on the event duration is a result of the POL model structure. Note the generated nitrogen load ranges: [85%, 125%] for Event 1, [95%, 120%] for Event 2, [95%, 135%] for Event 3 (Fig. 8). Thus, the frequency distri- bution of nitrogen load is more scattered than the fre- quency distribution of MSI. Nevertheless, regression analysis between load and MSI shows that respectively for Events 1, 2 and 3, 49%, 46%, 75% of the variance of the estimated nitrogen load can be explained by MSI. To go further, we quantify the influence of the mis- classification of each land use category on the load by a
Table 5
Summary of the descriptive statistics of the proportions of 200 simulated agricultural land use on the catchment and the proportions stemming from the reference land use map
Cereal Proportions of agricultural surface (%)
Market gardening Vineyard Orchard
Mean 11 26 52.8 10.3
Standard deviation 1.2 2.2 2.5 0.5
Minimum 8.4 20.6 45.7 9.2
Maximum 13.5 312 59.9 11.3
Reference map 8.8 23.9 55.5 11.8
descending stepwise regression analysis. For Event 1, the errors on market gardening classification explain almost all the variance of the load (coefficient of determina- tion ¼ 0.9963 for a risk of first order of 5%). For Events 2 and 3, the errors on cereal and market gardening are significant in explaining the variance of the load (coef- ficient determination ¼ 0.9948 and 0.9998). These good results can be explained by (i) the combination of the misclassification effect and of the important differences in fertilizer inputs for the different land uses and (ii) the structure of the production function in the model.
4. Conclusion
The confidence of an event-based water quality model to land use data uncertainties has been studied focusing on categorical uncertainties. The agricultural areas affect directly the initial nitrogen stock value according to the agricultural practices: cultivation type, fertiliser inputs and cultural calendar. In this current version of the model that constitutes a first step of modelling, the nitrogen stock is calculated for the whole catchment based on the proportion of different cultivation types. Thus, the uncertainty in the land use classification only affects the production function of nitrogen load and not the transport function. Note also that this simple model structure assumes homogeneity in runoff generation and in N mobilisation.
The sensitivity analysis and the uncertainty analysis have shown that the nitrogen load is significantly af- fected by the land use data. A method to analyse the categorical land use uncertainty by using the classifica- tion confusion matrix information has been proposed. For this first step we have limited the sampling to 200 realisations and studied three events. First purely methodological improvements should be (i) to analyse the uncertainty on a bigger sample and all the rainfall events of a year, to take account better the diversity of events and antecedent conditions; (ii) to consider not only misclassification errors but all the uncertainties who affect land use data (reference data sampling, res- olution, choice of the categories). The categorical land use uncertainty results in significant uncertainty in the predicted nitrogen loads. This impact could be reduced or increased in different events as a function of the fer- tilisation calendar. A second improvement should be a modification of the simplistic method to determinate NBV taking account the accumulation of nitrogen in the soil during the cultural cycle. The effects of positional land use uncertainty could not be studied using this semi-distributed model in which the initial nitrogen stock is determined for the whole catchment. So, a third possible improvement will be to improve the determi- nation of the local initial nitrogen stock with a better knowledge of agricultural practices, and/or of the spatial
distribution. Finally, to continue the model confidence evaluation, the effects of the other input variables have to be analysed. The impact of rainfall data uncertainty is usually very significant on hydrological model predic- tions (Nandakumar and Mein, 1997). The current ver- sion of the POL model is based on a homogeneous rainfall and runoff generation for the whole catchment. In the next version of the model, the production func- tion will be parameterised on each subcatchment. This model evolution will require the spatial variability of rain to be taken into account using distributed rain-ra- dar images. The ultimate aim should be the determina- tion of the respective part of each input data uncertainty on the model output uncertainties.
References
AME-Diren, 2000. Carte de l’occupation du sol des bassins versants des zones humides du littoral du Languedoc-Roussillon, 1/50 000. Available from <www.geozoum.org>.
Bertoni, J.C., 2001. Etude hydrologique et analyse des incertitudes sur trois bassins versants semi urbanis es de la r egion centrale d’Argentine. PhD, Universit e Montpellier II, Montpellier, p. 305. Beven, K.J., 2001. Rainfall-Runoff Modelling: The Primer. Wiley,
Chichester.
Beven, K.J., 2002. Towards an alternative blueprint for a physically- based digitally simulated hydrologic response modelling system. Hydrological Processes 16 (2), 189–206.
Beven, K.J., Freer, J., 2001. Equifinality, data assimilation, and uncertainty estimation in mechanistic modelling of complex envi- ronmental systems using the GLUE methodology. Journal of Hydrology 249, 11–29.
Campbell, J.B., 1996. Introduction to Remote Sensing. Taylor and Francis. pp. 375–398.
Chambre d’Agriculture, 2000. Suivi- evaluation des pratiques agricoles en mati ere de fertilisation azot ee (campagne 1997–1998). Chambre d’Agriculture de l’H erault, p. 22.
Chang, C.H., Yang, J.C., Tung, Y.K., 1993. Sensitivity and uncer- tainty analyses of a sediment transport model: a global approach. Journal of Stochastic Hydrology and Hydraulics 7 (4), 299– 314.
Cotter, A.S., Chaubey, I., Costello, T.A., Soerens, T.S., Nelson, M.A., 2003. Water quality model output uncertainty as affected by spatial resolution of input data. Journal of the American Water Resources Association 39 (4), 977–986.
Crosetto, M., Tarantola, S., Saltelli, A., 2000. Sensitivity and uncertainty analysis in spatial modelling based on GIS. Agriculture Ecosystems & Environment 81, 71–79.
Eckhardt, K., Breuer, L., Frede, H.G., 2003. Parameter uncertainty and the significance of simulated land use change effects. Journal of hydrology 1–4, 164–176.
Girard, M.C., Girard, C., 1999. Traitement des donn ees de t el ed etec- tion. DUNOD, Paris. p. 529.
Goodchild, M.F., 1993. Data models and data quality: problems and prospects. Environmental Modeling with GIS, 94–103.
Helton, J.C., 1993. Uncertainty and sensitivity analysis techniques for use in performance assessment for radioactive waste disposal. Reliability Engineering & System Safety 42, 327–367.
Hubert-Moy, L., Cotonner, A., Le Du, L., Chardin, A., Perez, P., 2001. A comparison of parametric classification procedures of remotely sensed data applied on different landscape units. Remote Sensing of Environment 75, 174–187.
I.F.E.N., 1988. Base de donn ees CORINE Land Cover v.1 de 1988 version 5 ha ( IFEN, 1996). Available from <www.ifen.fr>. Lewis, H.G., Brown, M., Tatmall, A.R.L., 2000. Incorporating
uncertainty in land cover classification from remote sensing imagery. Advanced Space Research 26 (7), 1123– 1126.
Nandakumar, N., Mein, R.G., 1997. Uncertainty in rainfall-runoff model simulations and the implications for predicting the hydro- logic effects of land-use change. Journal of Hydrology 192, 211– 232.
Payraudeau, S., 2002. Mod elisation distribu ee des flux d’azote sur des petits bassins versants m editerran eens. PhD, Engref, Montpellier, p. 436.
Payraudeau, S., Tournoud, M.G., Cernesson, F., 2003. Sensitivity of effective rainfall amount to land use description using GIS tool. Case of a small Mediterranean catchment. Physics and Chemistry of the Earth, Parts A/B/C 28 (6–7), 255–262.
Payraudeau, S., Tournoud, M.G., Cernesson, F., Picot, B., 2001. Annual nutrients export modelling by analysis of landuse and topographic information: case of a small Mediterranean catch- ment. Water Science & Technology 44 (2–3), 321–327.
Rodriguez-Iturbe, I., Gupta, V.K., 1983. Scale problems in hydrology. Journal of Hydrology 65 (special issue), 175–208.
Sagot, O., 1999. Conception et r ealisation d’une couche d’informations g eor ef erenc ees sur l’occupation du sol des zones humides et de leurs bassins versants du littoral de la r egion Languedoc-Roussillon. Universit e Louis Pasteur, Strasbourg, p. 62.
Schultz, G.A., 1993. Application of GIS and remote sensing in hydrology. HydroGIS’93: Application of Geographic Information Systems in hydrology and water resources management, Vienna, Austria, April 1993, no. 211, IAHS Publication, pp. 127–140. Yulianty, J.S., Lence, B.J., Johnson, G.V., Takyi, A.K., 1999. Non-
point source water quality management under input information uncertainty. Journal of Environmental Management 55, 199–217.