Publisher’s version / Version de l'éditeur:
Advances in Cement Research, 15, April 2, pp. 51-56, 2003-04-01
READ THESE TERMS AND CONDITIONS CAREFULLY BEFORE USING THIS WEBSITE.
https://nrc-publications.canada.ca/eng/copyright
Vous avez des questions? Nous pouvons vous aider. Pour communiquer directement avec un auteur, consultez la
première page de la revue dans laquelle son article a été publié afin de trouver ses coordonnées. Si vous n’arrivez pas à les repérer, communiquez avec nous à PublicationsArchive-ArchivesPublications@nrc-cnrc.gc.ca.
Questions? Contact the NRC Publications Archive team at
PublicationsArchive-ArchivesPublications@nrc-cnrc.gc.ca. If you wish to email the authors directly, please see the first page of the publication for their contact information.
NRC Publications Archive
Archives des publications du CNRC
This publication could be one of several versions: author’s original, accepted manuscript or the publisher’s version. / La version de cette publication peut être l’une des suivantes : la version prépublication de l’auteur, la version acceptée du manuscrit ou la version de l’éditeur.
Access and use of this website and the material on it are subject to the Terms and Conditions set forth at
Early age strain recovery of hardened cement paste - microstructural factors
Beaudoin, J. J.; Tamtsia, B. T.
https://publications-cnrc.canada.ca/fra/droits
L’accès à ce site Web et l’utilisation de son contenu sont assujettis aux conditions présentées dans le site LISEZ CES CONDITIONS ATTENTIVEMENT AVANT D’UTILISER CE SITE WEB.
NRC Publications Record / Notice d'Archives des publications de CNRC:
https://nrc-publications.canada.ca/eng/view/object/?id=d9f512c7-4ebd-4f12-a0ca-284bd5210121 https://publications-cnrc.canada.ca/fra/voir/objet/?id=d9f512c7-4ebd-4f12-a0ca-284bd5210121
Early age strain recovery of hardened cement paste – microstructural factors
Beaudoin, J.J. ; Tamtsia, B.T.
NRCC-45706
A version of this document is published in / Une version de ce document se trouve dans: Advances in Cement Research, v. 15, no. 2, April 2003, pp. 51-56
EARLY AGE STRAIN RECOVERY OF HARDENED CEMENT PASTE – MICROSTRUCTURAL FACTORS
J.J. Beaudoin* and B.T. Tamtsia*
*Institute for Research in Construction, National Research
Council of Canada, Ottawa, Canada, K1A 0R6
SYNOPSIS
The total strain and strain recovery-time response of hardened cement paste subjected to a sustained load was followed using impedance spectroscopy. An immediate increase in the high frequency arc diameter on removal of the load was interpreted in terms of microstructural behavior. The nature of the strain recovery characteristics were observed to be strongly dependent on the water-cement ratio. Aspects of a strain recovery mechanism based on re-adsorption of water on unloading are discussed.
1. Introduction
Total strain recovery (creep and shrinkage) and creep recovery are important quantities in the design of concrete elements subjected to variable stress. Analysis of creep recovery data has formed the basis for arguments concerning the mechanism of creep itself.1 Issues concerning the relevance of reversible and irreversible components of creep and their relationship to microstructural processes occuring during recovery are central to continuing research on the subject. Significant differences in the nature of creep and creep recovery have been reported.2 These include the dependence on strength and the properties of cement used.
Models for the response of concrete to the combined effects of drying and sustained load have been advanced.3 These generally relate to the quantity of water residing in the microporous C-S-H structure. There is at the present time, however, no reliable method of establishing the equilibrium state and distribution of water in pores of concrete under applied stress. It has been shown that impedance spectroscopy techniques are sensitive to microstructural changes due to both hydration and the application of a sustained load.4 The objective of this work was to re-examine the strain recovery process for hardened cement paste (subjected to a sustained load) using impedance spectroscopy techniques. A clearer understanding of the role of water was sought.
2. The 96% RH Environment
The experimental results in this investigation were obtained in a CO2 free environment maintained at 96% RH. The choice of this humidity is discussed in the following paragraphs.
A characteristic of the water sorption isotherm for cement paste is that the desorption branch (in the high humidity region) is less steep than the adsorption branch as a result of the large secondary hysteresis.5 The amount of water desorbed at 96% RH is only about six per cent of the D-dried mass of the cement pastes. The concept of D-drying was first introduced by Copeland and Hayes.6 It referred to drying of cement paste by outgassing to the vapor pressure of dry ice at –79°C (0.5 x 10⁻³ mm Hg). Most of the capillary pores continue to contain some bulk water at 96% RH. Those pores that empty would still have adsorbed films on their surfaces.
A.C. impedance spectra are readily obtained when equilibrium is attained at 96% RH as the system is still effectively percolated. The objective of choosing a test humidity of 96% RH was to provide a test environment for both creep and shrinkage measurements (shrinkage, although small, will occur due to meniscus effects) while minimizing any significant decrease in percolation. Changes in the spectra are readily detected during the equilibrium process. It is well known that the menisci do not completely rupture until about 45% RH where there is a marked effect in the length change desorption isotherm due to elastic rebound.7
3. Impedance Behavior of Cementitious Materials
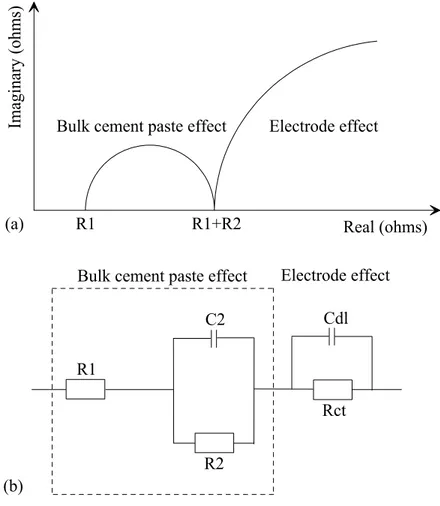
Impedance spectra recorded over a wide range of frequencies (from 15 MHz to 1 Hz) have provided new information and insight on cement paste microstructure, hydration and creep.4 An idealized impedance spectrum for a cement system is plotted in the real versus imaginary plane, Figure 1 (a). A single arc in the high-frequency range with a small part of a second arc in a relatively low-frequency region is shown. The high-frequency arc (HFA) is attributed to the bulk cement paste impedance behavior and the second arc is due to the cement paste-electrode surface capacitance contribution.8 The intercepts R1 (at the high-frequency end, at c. 20 MHz-7MHz) and R1 + R2 (at the minimum between the electrode arc and bulk arc, at frequency c. 100 MHz) are important parameters providing information related to cement paste microstructure. Interpretation of an impedance spectrum (IS) usually involves modeling with an equivalent circuit (Figure 1 (b)) until the electrical response of the elemental microstructure of the cement paste is well simulated.
Cement-based materials generally contain a broad size distribution of conducting pores.9,10 The network of these conducting pores continuously changes during the drying process.11-13 This change can be detected in A.C. impedance spectra.11-15 Christensen et.al.16 found the cement paste to be a complicated composite conductor because its microstructure and the conductivity of its pore fluid are interrelated and time-dependent. McCarter et.al. have shown that in mortar samples the water adsorbed by capillary suction forces has a significant influence on the electrical response.17
Previous investigations8-20 have indicated that impedance behavior of the hydrating Portland cement system depends upon the ionic concentration of the pore solution and porosity. The high frequency arc diameter (or chord), R2, has been shown to be an inverse function of porosity, mean pore size and ionic concentration of the pore solution. In practice, an ideal semi-circle is generally not observed in most materials. It is normally an inclined semi-circle with its center depressed below the real axis by a finite angle referred to as the depression angle. This behavior normally associated with a spread of relaxation times21 cannot be described by the classical Debye equation employing a single relaxation time.22,23 A dispersive, frequency-dependent element or so-called constant phase element (CPE)24-26 can be introduced to account for the shape of the depressed complex plot. The impedance contribution of this element can be expressed as follows: n o j A CPE Z( )= −1( ω)− (1)
where n = 1-2/π · αd and αd is the depression angle parameter. Therefore, n can be used to represent the degree of perfection of the capacitor and represents a measure of how far the arc is depressed below the real impedance axis.
4. Experimental Program
Specimen Preparation and Characteristics
The hydrated cement paste used for this experimental study was made with type 10 Portland cement mixed with de-aired distilled water at a w/c = 0.50. The Portland cement had the following composition in percent: SiO2 (20.72); Al2O3 (5.87); Fe2O3 (3.07); CaO (62.66); MgO (3.46); SO3 (2.18) and free lime (0.24). The Bogue composition was as follows: C3S (46.5); C2S (24.6); C3A (10.4) and C4AF (8.3). The fineness of the cement was 340 m2/kg. Vacuum mixing was carried out in hollow perspex cylinder 30 mm in diameter and 80 mm in length. Mixing of the paste was carried out using a magnetic stirrer placed inside the cylinder and the latter was placed between two large magnets.27 This ensured homogeneity. The cylinders were slowly rotated while the paste hardened in order to avoid bleeding and resulting in a homogeneous product. Specimens were demoulded after 24 hours and stored in lime water at 22°C for up to two years.
The resistivity of the saturated cement paste at 2 years was about 35.2 Ω.m. The compressive strength at 28 days was 34.5 MPa. The stress-strength ratio for the creep tests performed on 2 year old samples was 0.30. The samples were fabricated from paste cylinders in order to obtain a ‘T-shaped’ specimen about 1 mm thick with a height of 25.4 mm and a flange width of 5.72 mm. A special jig was constructed to facilitate the cutting of the specimens with a precision saw.
5. The Coupled A.C. Impedance – Strain Measurement System
The A.C. impedance shrinkage strain (unloaded) and total strain (loaded) spectral responses were carried out by mounting the ‘T-shaped’ specimens on a fixed frame linking the specimens to a load cell through electrode interfaces which were connected to a Solartron 1260 frequency response analyzer. The microstructural changes were continuously monitored in a controlled relative humidity environment as the time under load increased. Details of the experimental device as well as detail of the ‘T-shaped’ specimen-electrode connection interface are provided elsewhere.28
6. Total Strain and Strain Recovery Tests
Samples were saturated surface dry and directly used for test without any further treatment. The following experiments were conducted:
• Shrinkage measurements on unloaded specimens from saturation to about 96% relative humidity.
• Total strain measurements from saturation to about 96% RH under sustained load (at a stress-strength ratio = 0.30) for a period of 3 days followed by strain recovery measurements after the removal of the load.
• Real-time A.C. impedance spectra determination associated with the shrinkage test.
• Real-time A.C. impedance spectra determination associated with total strain and strain recovery tests.
• Real-time A.C. impedance spectra determination for unloaded paste samples hydrating under wet conditions (100% RH).
7. Results and Discussion
Total Strain and Strain Recovery
Typical curves of total strain (creep + shrinkage) of hardened cement paste (w/c = 0.35; subjected to a sustained load) versus time are plotted in Figure 2. The test was performed in a CO2 free environment at 96% RH. The age at loading varied from 18 to 30h. The applied stress – strength ratio was 0.30. Creep recovery curves are also shown after unloading at 3 days. Total strain at 3 days and values of the immediate strain recovery on unloading are given in Table 1 for pastes prepared at both w/c = 0.35 and 0.50.
The results in Table 1 indicate that the total strain and immediate strain recovery increase significantly with age at loading for the w/c = 0.35 paste. Concurrent with this is only a small increase in the degree of hydration (0.349 to 0.379). The total strain is larger for the more porous w/c = 0.50 paste at 18 and 24 hours. Although the degree of hydration is higher (about 0.401 and 0.420) the total strain is larger reflecting the influence of the increased porosity. The magnitude of strain recovery for the w/c ratio = 0.50 paste remains similar at the three test ages. The total strain and strain recovery at 30 hours is less than that for the w/c = 0.35 paste indicating that the higher degree of hydration for the w/c = 0.50 paste (0.450 at 30h) begins to be the dominant factor controlling behavior.
8. Impedance Analysis of Total Strain and Strain Recovery Behavior
Descriptors of the microstructure of hardened cement paste can be derived from characteristics of the high frequency arc (HFA, as described earlier) in the impedance plane. The size of the high frequency arc diameter is dependent upon porosity, pore size and pore fluid conductivity. It has been shown by several authors that the HFA diameter increases in size as hydration progresses.19 It also increases in size due to the application of a sustained load or exposure to drying with moisture loss to the environment).4
The HFA diameter was obtained as a function of time (up to 172 hours) for unloaded and loaded specimens maintained at 96% RH and for unloaded specimens kept continuously saturated i.e. at 100% RH, (Figures 3, 4). The loaded specimens were unloaded at 3 days. The HFA diameter increased immediately after unloading and continued to increase at a slower rate for the duration of the test. This increase in HFA diameter at the beginning of the strain recovery process is of particular interest. The increase is not attributed to microcracking processes as the application of a load at a stress-strength ratio of 0.30 is below the microcracking limit.29 The application of the applied load would seem to have the effect of redistributing the water within the paste microstructure.3,30 The characteristics of the strain recovery curves for the w/c = 0.35 paste (Figure 3) can be rationalized as follows. On unloading, the pore structure adjusts resulting in re-adsorption of the adsorbate in the fine pores and moisture transfer from the larger pores. The readjustment is rapid, the microstructure stabilizes and the strain recovery curves rejoin the curves for the unloaded specimens drying at 96% RH. The pore coarsening effects that are known to occur on drying do not appear (in the case of the w/c = 0.35
paste) to have been irreversibly affected by the sustained load. The set of curves at each loading age are qualitatively similar suggesting that the strain recovery process is similar. The strain recovery characteristics of the w/c = 0.50 paste are quite different than those of w/c = 0.35 paste. The relative position of the various curves is strongly dependent on the age at loading (Figure 4). The HFA diameter curve (at 18h) for the unloaded (shrinkage at 96% RH) specimens is significantly displaced (to higher values) from the curves for specimens loaded (at 96% RH) and unloaded (maintained at 100% RH). The total strain curve at 24 hours occupies an intermediate position with respect to the unloaded (shrinkage at 96% RH) curve and the curve representing continuous hydration (unloaded) at 100% RH. The total strain curve at 30 hours lies close to the unloaded (shrinkage at 96% RH) curve. There is a large immediate recovery value of the HFA on unloading. It exceeds the value for the unloaded shrinkage curve by a substantial amount. Larger amounts of C-S-H are present in the w/c = 0.50 pastes (higher degree of hydration) than in the w/c = 0.35 pastes. Re-adsorption on unloading should involve a greater amount of water transfer to finer pores and the greater resistance observed in the impedance spectra. The change in the relative positioning of the total strain curve (with age at loading) towards a close proximity with the unloaded curve suggests that the dominating effect of porosity on microstructural response shifts to a dominance determined by the degree of hydration. The strain recovery curve at 30h has about a 100% increase in the value of the HFA. This suggests the re-adsorption effect is significant.
9. Conclusions
1. Microstructural changes affecting the total strain of hardened cement paste subjected to a sustained load at early ages can be studied in real-time using impedance spectroscopy.
2. The immediate strain recovery of hardened cement paste (at an early age) on removal of a sustained load can also be characterized by impedance spectroscopy.
3. An immediate increase in the high frequency arc diameter (HFA) of the impedance spectrum is observed on removal of a sustained load from hardened cement paste. The increase in HFA diameter is possibly due to re-adsorption of water into the fine pore structure of the paste.
4. The nature of the strain recovery characteristics (at an early age) of cement paste is strongly dependent on water-cement ratio. The microstructural response (at w/c = 0.35) on loading appears to be nearly reversible (the HFA is recoverable) on unloading. This is not the case at w/c = 0.50 where the immediate recovery of the HFA size exceeds that of the original unloaded samples.
5. Re-adsorption of water (on unloading) through mass transfer to the finer pores of the cement paste can account for increased resistance and values of the HFA diameter on unloading specimens.
References
1. NEVILLE A.M. Creep of Concrete: Plain, Reinforced and Prestressed, Chapter 8, North-Holland Publishing Company, Amsterdam, 1970, PP. 193-219.
2. NEVILLE A.M. Recovery of Creep and Observations on the Mechanism of Creep of Concrete, Applied Science Research, 1960, No. 9, pp. 71-84.
3. MILLS R.H. Creep and Shrinkage of Concrete Containing Mixtures of Portland Cement and High-Magnesia Blast Furnace Slag, Transport in South Africa Institute for Civil Engineering, 1969, No. 11, pp. 1-11.
4. BEAUDOIN J.J., TAMTSIA B. and MARCHAND J. A Re-examination of Creep Mechanisms in Hydrated Cement Systems, L’industria italiana del Cemento, 2000, No. 757, pp. 688-697.
5. FELDMAN R.F. Sorption and Length-Change Scanning Isotherms of Methanol and Water on Hydrated Portland Cement, Proceedings Fifth International Symposium on Chemistry of Cement, Tokyo, 1968, Vol. III, Part III, pp. 53-66.
6. COPELAND L.E. and HAYES J.C. Determination of Non-evaporable Water in Hardened Portland Cement Paste, A.S.T.M. Bulletin, 1953, pp. 70-74.
7. RAMACHANDRAN V.S., FELDMAN R.F. and BEAUDOIN J.J. Concrete Science, Heyden & Son, London, U.K., 1981, pp. 427.
8. GU P., XIE P., FU Y. and BEAUDOIN J.J. A.C. Impedance Phenomena in Hydrating Cement Systems: Origin of the High Frequency Arc, Cement and Concrete Research,1994, No. 24, Vol. 2, pp. 704-706.
9. VON SCHWEIDLER Studien über die Anomalien im Verhaltem der Dielektrika, Ann. D. Physik, 1907, No. 27, 711.
10. JONSCHER A.K. Physical Basis of Dielectric Loss, Nature, 1975, No. 253, Vol. 717 and No. 256, Vol. 566.
11. MacDONALD J.R. Impedance Spectroscopy, John Wiley, New York, 1987, pp. 346. 12. ALFORD N. Mc N. and DOUBLE D.D. Adsorption at the Gas-Solid and
Liquid-Solid Interface, Studies in Surface Science and Catalysis 10, Ed. By J. Rouquerol and K.S.W. Sing, Elsevier, Amsterdam, 1982, pp. 259-266.
13. DALGLIESH B.J., PRATT P.L. and TOULSON E. Fractographic Studies of Microstructural Development in Hydrated Portland Cement, Journal of Materials Science, 1982, No. 17, p. 2199.
14. McCARTER W.J., WATSON D.W. and CHRISP T.M. Surface Zone Concrete: Drying, Absorption and Moisture Distribution, Journal of Materials in Civil Engineering, 2001, No. 13, Vol. 1, pp 49-57.
15. TASHIRA C. and SHIMAMURA H. Dependence of the Electrical Resistivity on Evaporable Water Content in Hardened Cement Pastes, Materials Science Letter, 1987, No. 6, p. 1379.
16. CHRISTENSEN B.J., MASON T.O. and JENNINGS H.M. Experimental and Computer Simulation Results for the Electrical Conductivity of Portland Cement Paste, Materials Research Society Symposium Proceedings, 1992, No. 245, pp. 259-264.
17. McCARTER W.J. and GARVIN S. Dependence of Electrical Impedance of Cement Based Materials on Their Moisture Condition, Journal of Physics. D. Applied Physics, 1989, No. 22, Vol. 11, pp. 1773-1776.
18. XU Z., GU P., XIE P. and BEAUDOIN J.J. Application of A.C. Impedance Techniques in Studies of Porous Cementitious Materials (II). Relationship Between ACIS Behavior and the Porous Microstructure, Cement and Concrete Research, 1993, No. 25, Vol. 4, pp. 853-862.
19. GU P., XU Z., XIE P. and BEAUDOIN J.J. Application of A.C. Impedance Techniques in Studies of Porous Cementitious Materials (I). Influence of Solid Phase and Pore Solution on High Frequency Resistance, Cement and Concrete Research, 1993, No. 23, Vol. 3, pp. 531-540.
20. McCARTER W.J. and CURRAN P.N. The Electrical Response Characteristics of Setting Cement Paste, Magazine of Concrete Research, 1984, No. 36, Vol. 126, pp. 42-49.
21. McCARTER W.J., GARVIN S. and BOUZID N. Impedance Measurement on Cement Paste, Journal of Materials Science, 1988, No. 7, Vol. 10, pp. 1056-1057. 22. MacDONALD J.R. and JOHNSON W.B. Chapter One, Fundamentals of Impedance
Spectroscopy, in Impedance Spectroscopy, Edited by J. Ross MacDonald, John Wiley & Sons, New York, 1987, p. 346.
23. GU P., XIE P., FU Y. and BEAUDOIN J.J. A.C. Impedance Phenomena in Hydrating Cement Systems: Frequency Dispersion Angle and Pore Size Distribution, Cement and Concrete Research, 1994, No. 24, Vol. 1, PP. 86-88.
24. SLUYTERS-REHBACH M. and SLUYTERS J.H. Electroanalytical Chemistry, Vol. 4, Edit. A.J. Bard, Marcel Dekker, New York, 1990, pp. 1-125.
25. COLE K.S. and COLE R.H. Dispersion and Absorption in Dielectrics I. Alternating Current Characteristics, Journal of Chemical Physics, 1941, No. 9, pp. 341-351.
26. SCUDERI C.A., MASON T.O. and JENNINGS H.M. Impedance Spectra of Hydrating Cement Pastes, Journal of Materials Science, 1991, No. 26, pp. 349-353. 27. SEREDA P.J. and SWENSON E.G. Apparatus for Preparing Portland Cement Paste
of High Water Cement Ratio, Materials Research and Standards, 1967, No. 7, Vol. 4, p. 152.
28. TAMTSIA B. and BEAUDOIN J. J. Basic Creep of Hardened Portland Cement Paste: A Re-Examination of the Role of Water. Cement and Concrete Research, 2000, No. 30, Vol. 9, pp. 1465-1475.
29. HANSEN T.C. Creep and Stress Relaxation of Concrete, Proceedings Swedish Cement and Concrete Research Institute, Stockholm, 1960, No. 31, pp. 112.
30. TAMTSIA B.T. The Role of C-S-H Microstructure and Calcium Hydroxide on Creep and Shrinkage of Hardened Portland Cement Paste, Ph.D. Thesis, University of Ottawa, 2001, p. 261.
Figure Captions
Figure 1 (a) Schematic plot of a high frequency arc in the impedance complex plane obtained for cement paste systems; (b) A simplified electrical equivalent circuit for hydrating cement systems. R1, R2, and C2 are high-frequency resistance, solid-liquid interface resistance and capacitance. Rct and Cdl are cement-electrode interface charge transfer resistance and double layer capacitance.
Figure 2 Total strain (creep + shrinkage) of hardened cement paste (w/c = 0.35) while conditioning at 96% RH and loaded at different ages of hydration.
Figure 3 High frequency arc diameter versus time curves for unloaded and loaded hardened cement paste (w/c = 0.35). Specimens tested at 96% RH and loaded at: (a) 18h; (b) 24h; (c) 30h.
Figure 4 High frequency arc diameter versus time curves for unloaded and loaded hardened cement paste (w/c = 0.50). Specimens tested at 96% RH and loaded at: (a) 18h; (b) 24h; (c) 30h.
Real (ohms)
Imaginary (ohms)
R1 R1+R2
(a)
Bulk cement paste effect Electrode effect
R1
R2
C2 Cdl
Rct
(b)
Bulk cement paste effect Electrode effect
Figure 1. (a) Schematic plot of a high frequency arc in the impedance complex plane obtained for cement paste systems. (b) A simplified electrical equivalent circuit for hydrating cement systems. R1, R2, and C2 are high-frequency resistance, solid-liquid interface resistance and capacitance. Rct and Cdl are cement-electrode interface charge transfer resistance and double layer capacitance.
0 600 1200 1800 2400 0 1 2 3 4 5 6
hydration period, days
Total strain, in
18 hours old 24 hours old 30 hours old
7
Figure 2. Total strain (creep + shrinkage) of hardened cement paste (w/c=0.35) while conditioning at 96% RH and loaded at different ages of hydration
0 5000 10000 15000 20000 25000 30000 35000 shrinkage (unloaded) total strain recovery strain continuously w et (unloaded)
HFA diameter, ohms
Age at loading: 18h load removed (a) 5000 10000 15000 20000 25000 30000 35000 40000 45000 shrinkage (unloaded) total strain recovery strain continuously w et (unloaded)
HFA diameter, ohms
Age at loading: 24h load removed (b) 0 5000 10000 15000 20000 25000 30000 35000 0 20 40 60 80 100 120 140 160 180
Hydration period, hours
HFA diameter, ohms
shrinkage (unloaded) total strain recovery strain continuously w et (unloaded) Age at loading: 30h load removed (c)
Figure 3. High frequency arc diameter versus time curves for unloaded and loaded hardened cement paste (w/c=0.35). Specimens tested at 96% RH and loaded
0 20000 40000 60000 80000 100000 120000 140000 160000
HFA diameter, ohms
shrinkage (unloaded) total strain recovery strain continuously w et (unloaded) Age at loaging: 24h (b) load removed 20000 40000 60000 80000 100000 120000 140000 160000
HFA diameter, ohms
shrinkage (unloaded) total strain recovery strain continuously w et (unloaded) 0 Age at loaging: 18h (a) load removed 0 20000 40000 60000 80000 100000 120000 140000 0 20 40 60 80 100 120 140 160 180
Hydration period, hours
HFA diameter, ohms
shrinkage (unloaded) total strain recovery strain continuously w et (unloaded) Age at loaging: 30h (c) load removed
Figure 4. High frequency arc diameter versus time curves for unloaded and loaded hardened cement paste (w/c=0.50). Specimens tested at 96% RH and loaded
Table 1: Total strain and strain recovery.
W/C Age at Loading (h) Total Strain
(µε) Immediate Recovery (3d) 18 700 400 24 1150 800 0.35 30 2200 1500 18 1650 400 24 1600 300 0.50 30 1250 350