An analysis of morphological changes in visual cortical neurons
after knocking down scaffolding proteins of glutamate receptors
by
Connie M. Yee
SUBMITTED TO THE DEPARTMENT OF MECHANICAL ENGINEERING IN PARTIAL FULFILLMENT OF THE REQUIREMENTS FOR THE DEGREE OF
BACHELOR OF SCIENCE IN ENGINEERING AT THE
MASSACHUSETTS INSTITUTE OF TECHNOLOGY
JUNE 2008
©2008 Connie M. Yee. All rights reserved. The author hereby grants to MIT permission to reproduce
and to distribute publicly paper and electronic copies of this thesis document in whole or in part
in any medium now known or hereafter created.
Signature of Author
/
artment of Mechanical ]gineeringS.• - - May 9,2008
Certified by:
/
Martha Constantine-Paton
Professor of Biolog and Brain and Cognitive Sciences Thesis Supervisor Accepted by:John H. Lienhard V Professor of Mechanical Engineering
j
Chairman, Undergraduate Thesis Committee
MASSACHL;SETTS INSTrtE OF TECHNOLOGY
AUG 1 -4 2008
LIBRARIES
An analysis of morphological changes in visual cortical neurons
after knocking down scaffolding proteins of glutamate receptors
by
Connie M. Yee
Submitted to the Department of Mechanical Engineering on May 9, 2008 in partial fulfillment of the
requirements for the Degree of Bachelor of Science in Engineering as recommended by the Department of Mechanical Engineering
ABSTRACT
NMDA receptor subunit changes have an important implication in synaptic development, learning, memory, and neuronal disorders. Previous studies have suggested that two membrane-associated guanylate kinase (MAGUK) family scaffolding proteins, SAP102 and PSD-95, are involved in the switch from predominance of NMDA receptors rich in NR2B subunits to that of NMDA receptors rich in NR2A subunits. Normally, eye opening causes PSD-95 levels to increase at synapses and its interactions with NR2A to increase while its interactions with NR2B decrease. In order to identify the exact roles of the two MAGUKs, this study examined changes in dendritic morphology of mouse visual cortical neurons at postnatal day 15 induced by eye opening and knocking down each of the two MAGUKs with small inhibitory RNAs (siRNAs). The changes I found include smaller cell bodies, increased frequency of dendritic branching, and a decrease in the number of dendritic intersections with a radial sphere centered on the cell body. Since dendritic patterning is critical for neuronal information processing, these results suggest an important aspect of MAGUK functions in cortical development. Further studies including mice at different ages and mice with closed eyes will determine the roles of MAGUKs in age- and activity-dependent development of the visual cortical circuit.
Thesis Supervisor: Martha Constantine-Paton
1. Introduction
Proper sensory inputs during the early developmental period are necessary for formation of functional neural circuits. As seen in children with untreated cataract, occlusion of normal experiences in early stage can cause lifelong deficits in brain function. The visual pathway has been a widely-used model system to study activity-dependent developmental processes in animal model systems. Our understanding of how early experiences shape neural circuits have greatly advanced over the past few decades, but the detailed molecular mechanisms remain unknown.
One of the key molecules underlying activity-dependent development is the N-methyl-D-aspartate receptor (NMDAR). The NMDAR is a subunit of ionotropic glutamate receptors, which have been implicated in brain development, learning, memory, and neuronal disorders. It is essential for synapse formation, maturation of neuronal connections, and modulation of synaptic transmission such as long-term potentiation (LTP) and depression (LTD). The NMDAR is a complex with two obligatory NR1 subunits and at most two of four NR2 subunits, NR2A-2D. In the visual cortex, NR2A and NR2B are major subunits of NMDAR. NR2A is predominant in mature animals, while NR2B has high expression in the embryo and neonate but lower levels as the brain matures. Visual activity plays a major role in NMDAR subunit exchange from receptors rich in NR2B subunits to those rich in NR2A subunits. Developmental changes in NMDAR subunit composition affect channel kinetics and calcium permeability, which can alter responses of postsynaptic neurons, and in turn, the property of the cortical neuronal network (Phillips et al. 2007).
NMDARs are localized at excitatory postsynaptic membranes with many other signaling and cytoskeletal proteins. Membrane-associated guanylate kinase (MAGUK) family proteins, SAP102 and PSD-95, play an important role in organizing a structural element on the dendritic spine, called the postsynaptic density (PSD). MAGUKs have multiprotein-interaction domains and link glutamate receptors to signaling molecules, which can direct presynaptic inputs to the specific downstream signaling cascades. It has been hypothesized that there are preferential interactions between SAP102 and NR2B; and PSD-95 and NR2A. Previous work using proteins from dendritic fractions of neurons in the visual cortex showed that PSD-95 exhibits large increases in synaptic expression shortly after eye opening around postnatal day (P) 13, while SAP102 levels increase from PO and gradually drop in the adult. Furthermore, eye-opening also induces more interactions of NR2A and PSD-95 (van Zundert et al. 2004). Truncating mutations in SAP 102 were found in families with moderate to severe X-linked mental retardation, strongly suggesting the importance of SAP102 functions in early development (Tarpey et al. 2004).
The formation and development of dendrites can reflect the changes in neuronal circuitry that may have been caused by changes in the NMDARs and their associated signaling molecules. Dendritic formation is a highly dynamic process and is affected by factors, such as light-induced visual activity. Only a few hours of light stimuli can stabilize existing branches and induce formation of new dendritic branches. Since cytoskeletal proteins in dendrites and spines are modulated by many signaling cascades, calcium influx through activated NMDARs can activate downstream effectors and regulate dendritic growth and branching, as well as formation of spines (Chen et al. 2005). After the onset of patterned vision, NMDAR activation plays a significant role in structural refinement, specifically elimination of unnecessary synapses and decrease in axonal sprouting (Phillips et al. 2007).
Spines and dendritic shafts are the locations of synaptic connections and integration of information. Therefore, anomalies in dendritic morphology are linked to pathological conditions such as schizophrenia and stress, and genetic syndromes associated with mental retardation (MR). Some of the observations of pyramidal neurons in the cerebral cortex in neurological diseases indicate fewer and shorter dendritic branches that have abnormal morphology and number of spines. A MR-associated disorder, such as Down syndrome, has been linked to spine dysgenesis and a decline in spine density. In Rubinstein-Taybi Syndrome, the cell body, or soma, is smaller. Schizophrenic patients show reduced dendritic spine density in layer III neurons of the dorsolateral prefrontal cortex, which might underlie cognitive dysfunctions such as working memory deficit (Kaufmann et al. 2000; Lewis et al. 2008).
The purpose of this study is to investigate the roles of SAP102 and PSD-95 in brain plasticity by focusing on dendritic morphological changes induced by eye opening. We chose pyramidal neurons in the lower layer II/III of the primary visual cortex (V1), as illustrated in Fig. (1), because previous studies revealed that these neurons show a high levels of plasticity in response to visual stimuli (Gordon et al. 1996). Lentivirus-delivered short hairpin RNA (shRNA) can efficiently knock down MAGUK expressions in layer II/III neurons in vivo. We examined and quantified the alterations in dendritic branch patterns and neuronal architecture that arise from knocking down a MAGUK.
2. Materials and Methods
2.1 Construction of lentiviral shRNA expression vector
The lentiviral shRNA expression vector was constructed from the pLL 3.7 vector by replacing the CMV promoter with the human synapsin 1 promoter to enhance expression of the green fluorescent protein (GFP) reporter and the knockdown constructs in neurons (Rubinson et al. 2003). For knockdown (KD) of PSD-95 or SAP102 expression, the following oligonucleotides encoding a short hairpin RNA (shRNA) were inserted under the U6 promoter using HpaI and XhoI sites. Lentiviruses were produced in Human embryonic kidney 193 FT cells as previously described (Lois et al. 2002). Lentivirus expressing only GFP was used as a control. PSD95 KD shRNA 5' tGATGAAGACACGCCCCCTCttcaagagaGAGGGGGCGTGTCTTCATCttttttc 3' 5' tcgagaaaaaaGATGAAGACACGCCCCCTCtctcttgaaGAGGGGGCGTGTCTTCATCa 3' SAP 102 KD shRNA 5' tGCCAGTGACACGACAAGAAttcaagagaTTCTTGTCGTGTCACTGGCttttttc 3' 5' tcgagaaaaaaGCCAGTGACACGACAAGAAtctcttgaaTTCTTGTCGTGTCACTGGCa 3' 2.2 In utero lentiviral injection
A 15.5-day pregnant mouse was anesthetized with 1.25% Avertin (0.03ml/g, ip injection). After removal of abdominal fur the surface of skin was cleaned with betadine and 70% ethanol three times. A midline incision was made from the xyphoid process to the pubis using a scalpel and scissors. Embryos in utero were taken out of the peritoneal cavity using sterile cotton swabs. 1pl of lentiviral solution containing 1-5 x 10⁴ infectious particle was injected into the lateral ventricles of embryo using a Hamilton syringe (No. 75; 5pl) and a customized 32 gauge needle. After the injections, the uterus was placed back into the peritoneal cavity and lavaged with sterile PBS. The abdominal musculature was sutured using 4-0 silk sutures and the skin was closed using a Clay Adams 9mm autoclips at 0.5cm apart. The mouse was placed on its back in the cage onto a 37C water bath and administrated with Buprenorphine (0.05mg/kg, sc injection) prior to recovery from anesthesia. All animals were treated in accordance with MIT's ICAC guidelines.
2.3 Perfusion, Sectioning and Immunohistochemistry
Mice were perfused with cold 4% Paraformaldehyde in PBS, post-fixed overnight at 4
oC, and sectioned with a Vibratome at 100pm. The sectioned cortices were blocked and permeabilized with PBS containing 10% normal goat serum, 5% bovine serum albumin and 1% TX-100 for 1hr at RT. Primary antibodies listed below were dissolved in PBS containing 10% normal goat serum, 5% bovine serum albumin and 0.3% TX-100 at the indicated concentrations. Slices were incubated with primary antibodies overnight at 40C and with secondary antibodies
and 10pM DAPI (Sigma) for 2hr at RT. After three times wash with PBS, cortical slices were mounted on glass slides using Fluoromount-G (Electron microscopy).
Antibodies used for immunohistochemistory: anti-GFP (chicken, Abcam, ab13970 1:1000), anti-Brn-2 (rabbit, Santa Cruz, H-60 1:2000), anti-NeuN (mouse, Millipore, MAB377,
1:5000), anti-chicken Alexa 488, anti-rabbit Alexa 543 and anti-mouse Alexa 633 (goat, Invitrogen, 1:2000).
2.4 Image acquisition
Neurons were selected from lower layer II/III in the medial region of the primary visual cortex based on the mouse brain atlas and immunostaining. Anti-GFP immunostaining was used for enhancement and long term preservation of fluorescent signals. As illustrated in Fig. (2), co-immunostaining of transcription factor Brn-2, a marker for layer II/III, and counterstaining of NeuN and DAPI that stain the cell body were used to determine the laminar structure. Confocal z-stack images were acquired with the Nikon PCM 2000 microscope (0.3pm interval, 60x objective lens, 2x digital zoom). Three z-stack images were taken at each z-position to create averaged images for noise reduction.
GFP
Brn-2
NeuN
DAPI
NIll
IV
Vl
WM
Figure 2. Immunostaining for GFP, Brn-2, NeuN, and DAPI
2.5 Tracing and 3-D reconstruction
In a blinded study, the selected neurons were digitally reconstructed with a Neurolucida system (MBF Bioscience). The dendritic branching patterns were then evaluated with the Neurolucida software, which performed various analyses, such as a standard Sholl analysis and Polar histogram. Statistical analysis was performed with the SPSS software (SPSS Inc.).
3 Results and Discussion
3.1 Neuron Reconstruction
Figure 3 shows representative images of the 3-D reconstructed pyramidal neurons from each group.
Figure 3. (Next page) Representative images of 3D-reconstructed layer II/III pyramidal neurons in the primary visual cortex. Neurons are illustrated with soma and dendrites in black and axons
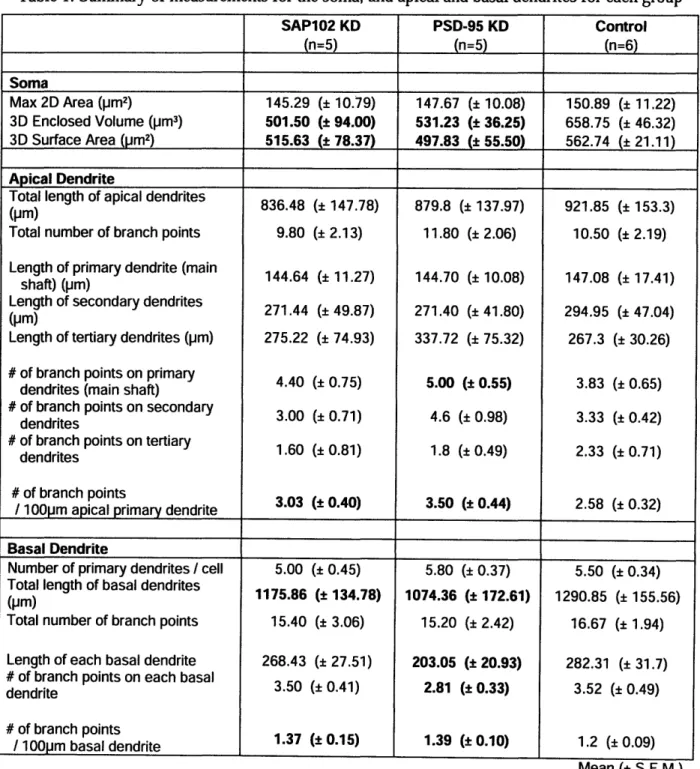
The key measurements for the soma, and apical and basal dendrites for each group are summarized in Table 1.
Table 1. Summary of measurements for the soma, and apical and basal dendrites for each group
SAP102 KD PSD-95 KD Control (n=5) (n=5) (n=6) Soma Max 2D Area (pm2) 145.29 (+ 10.79) 147.67 (± 10.08) 150.89 (± 11.22) 3D Enclosed Volume (pm3) 501.50 (± 94.00) 531.23 (+ 36.25) 658.75 (+ 46.32) 3D Surface Area (pm2) 515.63 (+ 78.37) 497.83 (+ 55.50) 562.74 (± 21.11) Apical Dendrite
Total length of apical dendrites
Total length of apical dendrites 836.48 (± 147.78) 879.8 (± 137.97) 921.85 (± 153.3)
(pm)
Total number of branch points 9.80 (± 2.13) 11.80 (± 2.06) 10.50 (± 2.19) Length of primary dendrite (mainLength of primary dendrite (main 144.64 (± 11.27) 144.70 (± 10.08) 147.08 (± 17.41)
shaft) (pm)
Length of secondary dendrites
(m)Length of secondary dendrites 271.44 (+ 49.87) 271.40 (± 41.80) 294.95 (± 47.04) (pm)
Length of tertiary dendrites (pm) 275.22 (± 74.93) 337.72 (± 75.32) 267.3 (± 30.26)
# of branch points on primary# of bdendrites (mapoints on primary 4.40 (± 0.75) 5.00 (+ 0.55) 3.83 (± 0.65)
dendrites (main shaft)
# of branch points on secondary
dendrites 3.00 (+ 0.71) 4.6 (± 0.98) 3.33 (± 0.42)
# of branch points on tertiary
dendrites 1.60 (± 0.81) 1.8 (+ 0.49) 2.33 (± 0.71)
# of branch points
/ 100pm apical primary dendrite 3.03 (+ 0.40) 3.50 (_ 0.44) 2.58 (± 0.32) Basal Dendrite
Number of primary dendrites / cell 5.00 (± 0.45) 5.80 (± 0.37) 5.50 (± 0.34) Total length of basal dendrites
Total length of basal dendrites 1175.86 (t 134.78) 1074.36 (+ 172.61) 1290.85 (± 155.56) Total number of branch points 15.40 (± 3.06) 15.20 (± 2.42) 16.67 (± 1.94) Length of each basal dendrite 268.43 (± 27.51) 203.05 (± 20.93) 282.31 (± 31.7)
# of branch points on each basal
dendrite 3.50 (± 0.41) 2.81 ( 0.33) 3.52 (± 0.49)
# of branch points
/ 100pm basal dendrite 1.37 (+ 0.15) 1.39 (+ 0.10) 1.2 (± 0.09)
Mean (± S.E.M.) Bold fonts indicate values for which potentially significant changes appear.
3.2 Soma
As seen in Fig. 4, there was no significant change in the maximum 2D soma area between the control group and the groups with knocked down SAP102 and PSD-95. However, knocking down either protein resulted in a lower 3D enclosed volume and surface area of the soma. This is consistent with earlier studies that suggest that soma size is correlated with dendritic structure. Lewis et al. showed that deep layer III pyramidal neurons in dorsolateral prefrontal cortex of schizophrenic patients have 9.1 % smaller cross-sectional soma area even though this difference was not statistically significant (Lewis et al. 2008). The current data suggest that both scaffolding proteins may be essential in the proper development of normal soma size.
Figure 4. The maximum 2D area, 3D volume, and surface area data, averaged by group. Averaged values of each group are plotted with the error bars representing the standard errors of
mean.
Soma Maximum 2D Area (pmz )
200
-150
100 .
0
--SAP102 KD PSD-95 KD Control
Soma 3D Enclosed Volume (pmm) Soma Surface Area (pmr)
6 0 0 - .. ... .... ... ... .. .... . 0 . T 400. I 300 200100
i
n iSAP102 KD PSD-95 KD Control SAP102 KD PSD-95 KD Control
700 600 500 400 300 200 100 0 I
-
.
I I3.3 Apical Dendrite
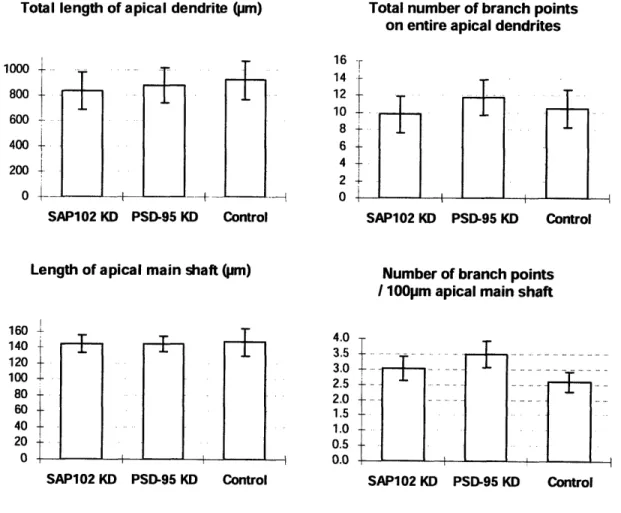
The total length of the entire apical dendrite is comparable among the three groups. There is a trend of an increase in the total number of branch points on the apical dendrite for PSD-95 KD. To study this further, we analyzed the branch points only on the main shaft. The length of the apical main shaft was measured from the soma to the apical tufts. Since the length of the apical main shaft is similar across the groups, we normalized the number of branch points and looked at it over 100pm. An intriguing result suggested by these data is that knocking down either SAP102 or PSD-95 may increase the number of branch points on the main shaft of the apical dendrite, compared to the control group.
Figure 5. The lengths and number of branch points on the apical dendrite, as well those on its main shaft
Total length of apical dendrite (pm)
1000 ..._. 800 600 400 200 0 ,. ._ SAP102 KD PSD-95 KD Control
Length of apical main shaft (prm)
160 140 120 100 80 60 40 20 0
-F
Total number of branch points on entire apical dendrites
SAP102 KD PSD-95 KD Control
Number of branch points
I 100pm apical main shaft 4.0 3.5 3.0 2.5 2.0 1.5 1.0 0.5 0.0 SAP102 KD PSD-95 KD Control I I i I I ! T SAP102 KD PSD-95 KD Control
3.4 Basal Dendrite
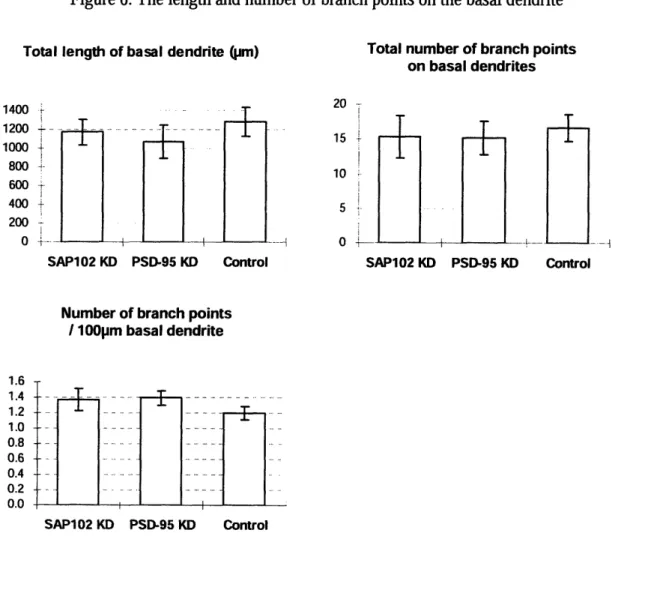
Analysis on the basal dendrite was performed on trees that were traced 100pm or longer. Since neurons have more basal dendrites than a single apical dendrite, more data points were obtained from the reconstructions. Knocking down SAP102 reduces the total length of the basal dendrite slightly, while knocking down PSD-95 causes a greater decrease. The finding lends support to a study done on the dendritic arbor in the optic tectum of zebrafish. Niell and colleagues found that PSD-95 localizes on stable dendrites, and that PSD puncta formation is concurrent with arbor growth (Niell et al. 2004).
There was also a trend for an increase in the number of branch points per 100pm of the basal dendrites for both SAP102 KD and PSD-95 KD, as seen in Fig. (6).
SAP-102 and PSD-95 likely play different roles in the development process, but a significant difference in the two groups was not detected from our study. Our results demonstrate that knocking down either of the two proteins causes its dendritic arbor to have more branches and the total length of basal dendrites to decrease.
Figure 6. The length and number of branch points on the basal dendrite
Total length of basal dendrite (Ijm)
1400 1200.... ... . 1000 -800 600 400 200 0 -- , SAP102 KD PSD-95 KD Control
Number of branch points 100pm basal dendrite
3-"I
Total number of branch points on basal dendrites 15 10 5 0-SAP102 KD PSD-95 KD Control SAP102 KD PSD-95 KD Control
ii
.
.... .... ... .... .... .... ......
...
...
....
....
....
...
....
....
....
.
.
....
..
..
....
....
...
r..
....
...
...
3.5 Sholl analysis
The Sholl analysis analyzes the number of objects within, or the number of intersections in a set of nested concentric spheres that are centered at the soma, as illustrated in Fig. (7). A shell is the volume contained out to a radius, but is not inclusive of the volume of any smaller spheres.
Figure 7. Sholl analysis with spheres surrounding the smallest sphere of radius ro and increasing in size by radius r.
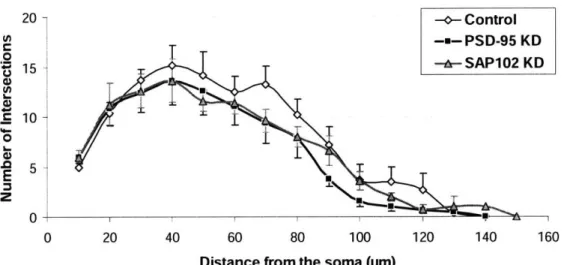
The Sholl analysis was performed on the basal dendritic trees for spheres in radius increments of 10pm. Since there were not many data points for the apical dendrites, the Sholl analysis for them was excluded.
As seen in Fig. (8), PSD-95 KD and SAP102 KD roughly follow the same trend in the decrease in the number of intersections as the distance from the soma increases. However, there is clearly a reduction in the number of intersections for SAP102 KD, and an even greater decline for PSD-95 KD.
Figure 8. Sholl analysis data for basal dendrites for each group
0
I - ^. I
I
0 20 40 60 80 100 120 140 160Distance from the soma (prm)
3.6 Polar histogram
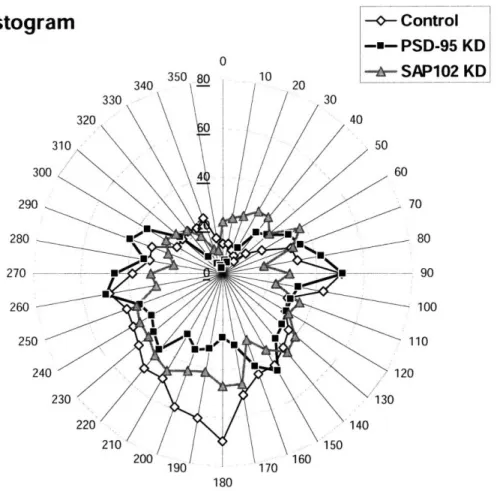
The polar histogram shows the overall direction of dendritic growth and plots length as a function of direction. Each segment of a dendritic tree is divided into a series of straight line segments, which are aggregated in bins according to their directional orientation. The circular polar histogram graph indicates the total length in a bin as a wedge with the same directional orientation. This analysis was performed on the basal dendrites, as exemplified in Fig. (9).
Figure 9. A polar histogram plot on a representative neuron
(Left) 3D reconstructed neuron is illustrated with basal dendrites in black and soma, axons and apical dendrites in gray. The scale bar represents 50pm. (Right) The length of basal dendritic growth direction is summed and plotted for every 100.
~-Figure 10 shows a radial distribution plot of the averages of lengths within each of the groups. Reducing the 3D tracings of the neurons to a 2D polar histogram shows that the extensions of basal dendrites into the lateral direction look similar between control and KD neurons. However, knocking-down a MAGUK reduce the basal dendritic extensions into the deeper cortical layer, particularly PSD-95 KD shows a greater reduction of dendritic growth
around 1800.
Many of the visual inputs from the retina project into layer IV in the primary visual cortex via the lateral geniculate nucleus in the thalamus. Therefore, loss of dendritic extensions into layer IV suggests that MAGUKs and NMDAR signaling are involved in proper dendritic development to receive the thalamic inputs after the onset of patterned vision.
Figure 10. PSD-95 KD reduces the basal dendritic extensions into the deeper cortical layer.
Polar Histogram
29 280 270 260 25 --- Control -=- PSD-95 KDA LE•• AIt 4 E/iP
80
90
100
10
Averaged lengths of basal dendritic extension of each group are plotted every 100. 0' corresponds to the direction to the surface (upper layer II/III and layer I), 1800 to the deep cortical layer (layer IV), and 900 and 2700 to the lateral.
IVL RU
4. Conclusion
The visual pathway has been widely used to study development, but the mechanism by which neural circuits are shaped is unknown. This study examines the importance of the role of MAGUKs in the signaling pathway during development. Because dendrites are sites of the integration of information, an alteration in the signaling processes can be visualized in a change in the dendritic arborization. We show that knocking down these proteins results in a decrease in soma size, an increase in the frequency of dendritic branching, and a reduction in the number of dendritic intersections with a radial sphere centered on the soma. Furthermore, PSD-95 KD reduces the extensions of basal dendrites into the deeper cortical layer. These abnormalities have potential implications in mental retardation and pathological conditions like schizophrenia.
Several factors influenced the outcome of this study. The small size of our study population may have prevented findings with a greater statistical significance. There is also a possibility that PSD-95 and SAP102 work cooperatively. Recent studies showed that MAGUK family proteins can compensate for the absence of the other (Elias et al. 2007). A decrease in the expression of one may stimulate the other, which would affect the results of our experiment. A study that knocks down both at the same time can provide further insight.
In most analyses, PSD-95 KD showed greater effects on dendritic morphology than SAP102 KD. It is probably due to the age of mice used in this study. At P15, two days after eye-opening, PSD-95 begins to accumulate at visual cortical synapses and is thought to relocate SAP102 from synapses into extrasynaptic membranes (van Zundert et al. 2004). Future studies using different ages of mice will address the age-specific roles of MAGUKs in dendritic development.
Acknowledgements
I would like to thank Professor Constantine-Paton and Dr. Yasunobu Murata for their guidance throughout this study and providing the lab equipment.
References
Chen Y. and Ghosh A. (2005). "Regulation of dendritic development by neuronal activity." J Neurobiol 64(1): 4-10.
Elias G. M. and Nicoll R. A. (2007). "Synaptic trafficking of glutamate receptors by MAGUK scaffolding proteins." Trends Cell Biol 17(7): 343-52.
Gordon J. A. and Stryker M. P. (1996). "Experience-dependent plasticity of binocular responses in the primary visual cortex of the mouse." J Neurosci 16(10): 3274-86.
Kaufmann W. E. and Moser H. W. (2000). "Dendritic anomalies in disorders associated with mental retardation." Cereb Cortex 10(10): 981-91.
Lewis D. A. and Gonzalez-Burgos G. (2008). "Neuroplasticity of neocortical circuits in schizophrenia." Neuropsychopharmacology 33(1): 141-65.
Lois C., Hong E. J., Pease S., et al. (2002). "Germline transmission and tissue-specific expression of transgenes delivered by lentiviral vectors." Science 295(5556): 868-72. Niell C. M., Meyer M. P. and Smith S. J. (2004). "In vivo imaging of synapse formation on a
growing dendritic arbor." Nat Neurosci 7(3): 254-60.
Phillips M. P. and Constantine-Paton M. (2007). "NMDA Receptors and Development." The Encyclopedia of Neuroscience.
Rubinson D. A., Dillon C. P., Kwiatkowski A. V., et al. (2003). "A lentivirus-based system to functionally silence genes in primary mammalian cells, stem cells and transgenic mice by RNA interference." Nat Genet 33(3): 401-6.
Tarpey P., Parnau J., Blow M., et al. (2004).."Mutations in the DLG3 gene cause nonsyndromic X-linked mental retardation." Am J Hum Genet 75(2): 318-24.
van Zundert B., Yoshii A. and Constantine-Paton M. (2004). "Receptor compartmentalization and trafficking at glutamate synapses: a developmental proposal." Trends Neurosci 27(7):


