Publisher’s version / Version de l'éditeur:
Journal of the Acoustical Society of America, 88, 2, pp. 871-878, 1990-08
READ THESE TERMS AND CONDITIONS CAREFULLY BEFORE USING THIS WEBSITE. https://nrc-publications.canada.ca/eng/copyright
Vous avez des questions? Nous pouvons vous aider. Pour communiquer directement avec un auteur, consultez la première page de la revue dans laquelle son article a été publié afin de trouver ses coordonnées. Si vous n’arrivez pas à les repérer, communiquez avec nous à PublicationsArchive-ArchivesPublications@nrc-cnrc.gc.ca.
Questions? Contact the NRC Publications Archive team at
PublicationsArchive-ArchivesPublications@nrc-cnrc.gc.ca. If you wish to email the authors directly, please see the first page of the publication for their contact information.
NRC Publications Archive
Archives des publications du CNRC
This publication could be one of several versions: author’s original, accepted manuscript or the publisher’s version. / La version de cette publication peut être l’une des suivantes : la version prépublication de l’auteur, la version acceptée du manuscrit ou la version de l’éditeur.
Access and use of this website and the material on it are subject to the Terms and Conditions set forth at
On the accuracy of models for predicting sound propagation in fitted
rooms
Hodgson, M. R.
https://publications-cnrc.canada.ca/fra/droits
L’accès à ce site Web et l’utilisation de son contenu sont assujettis aux conditions présentées dans le site LISEZ CES CONDITIONS ATTENTIVEMENT AVANT D’UTILISER CE SITE WEB.
NRC Publications Record / Notice d'Archives des publications de CNRC:
https://nrc-publications.canada.ca/eng/view/object/?id=da7c99e9-96c2-499b-bf99-666b0e8ce97a https://publications-cnrc.canada.ca/fra/voir/objet/?id=da7c99e9-96c2-499b-bf99-666b0e8ce97a
Ser
TH
1
N27
dNational Research
Conseil national
no,
16864
C ouncil Canada
de recherches Canada
c, 2
B L D G
Institute for
lnstitut de
-- - -
Research in
recherche en
Construction
construction
On the Accuracy of Models for Predicting
Sound Propagation in Fitted Rooms
by Murray Hodgson
Reprinted from
the Journal of the
Acoustical Society of America
Vol. 88, No. 2
August 1990
p. 871-878
(IRC Paper No. 1686)
NRCC
32356
N R C
-
CISTII R C
L I B R A R Y
JA?.
16
'c:!Cet article vise
A
aider A &valuer la prkision et ltapplicabilit6 des modeles de
prevision de la propagation du son dans les locaux amenages comme les
usines, les salles de classe et les bureaux. Les modeles etudies sont des
modeles au 1/50, les modeles de Jovicic, Lindqvist, Hodgson, Kurze, et de
Lemire et Nicolas, basks sur la mbthode des images, la formule empirique de
Friberg, et le modele de tra~age
de rayons dtOndet et Barbry. Les previsions
des modeles analytiques de propagation du son sont comparks aux resultats
des mesures de propagation du son dans un modele au 1/50 et dans un
entrep8t contenant chacun des parall6l&pip&des
rectangles de densite variable
ayant une repartition
A
peu pres isotrope. Les resultats indiquent que les
modeles de Friberg et de Lemire et Nicolas sont fondamentalement
incorrects. Meme s'il existe des versions plus universelles, les versions des
modeles de Jovicic et Kurze, tels qu'etudiks ici, staverent d'une applicabilite
limitke parce qu'elles ne tiennent pas compte des rkflexions sur les parois
verticales. Les modeles de Hodgson et Lindqvist semblent precis dans certains
cas limit&. Cette etude preliminaire a rev416 que le modele de tracage de
rayons d'Ondet et Barbry est le plus precis de tous ceux qui ont &t&
examines.
En outre, il est assez souple aux plans de la g6ometrie du local, de la
repartition des surfaces absorbantes et de celle du mobilier. I1 semble &re le
modele qui se prete le mieux
A
la prevision de la propagation du son dans les
On the accuracy of models for predicting sound propagation
in fitted rooms
Murray Hodgson
Institute forResearch in Construction, National Research Council, Ottawa, Ontario KIA OR6, Canada
(Received 6 July 1989; accepted for publication 4 April 1990)
The objective of this article is to make a contribution to the evaluation of the accuracy and applicability of models for predicting the sound propagation in fitted rooms such as factories, classrooms, and offices. The models studied are 1 :50 scale models; the method-of-image models of Jovicic, Lindqvist, Hodgson, Kurze, and of Lemire and Nicolas; the empirical formula of Friberg; and Ondet and Barbry's ray-tracing model. Sound propagation predictions by the analytic models are compared with the results of sound propagation measurements in a 1:50 scale model and in a warehouse, both containing various densities of approximately
isotropically distributed, rectangular-parallelepipedic fittings. The results indicate that the models of Friberg and of Lemire and Nicolas are fundamentally incorrect. While more
generally applicable versions exist, the versions of the models of Jovicic and Kurze studied here are found to be of limited applicability since they ignore vertical-wall reflections. The Hodgson and Lindqvist models appear to be accurate in certain limited cases. This preliminary study found the ray-tracing model of Ondet and Barbry to be the most accurate of all the cases studied. Furthermore, it has the necessary flexibility with respect to room geometry, surface- absorption distribution, and fitting distribution. It appears to be the model with the greatest applicability to fitted-room sound propagation prediction.
PACS numbers: 43.55.Ka, 43.50.Jh
INTRODUCTION
With the recent increase in awareness of the relationship between noise in the workplace and hearing loss, researchers and practitioners have become more and more preoccupied with the question of factory noise prevention and control. Models that permit factory noise levels to be predicted are an invaluable part of the noise-control process. Such models allow noise levels in a factory to be predicted before the fac- tory is built, and changes to its construction, shape, layout, and noise sources made to keep the noise to within accepta- ble limits. They allow the efficacy of noise-control measures to be studied. They allow limits to be put on the noise output of the equipment or on worker exposure times. They can avoid costly changes once the factory is built and in oper- ation.
The object of the present study was to make a contribu- tion to the evaluation of the accuracy and applicability of various prediction models. As discussed in detail below, we have considered the analytic models of Jovicic,' Friberg,2 Lindqvi~t,~ Hodgsoq4 Lemire and N i c o l a ~ , ~ K ~ r z e , ~ and Ondet and Barbry.' Predictions by these models have to some extent been compared with one another; more impor- tantly, these predictions have been compared with the ex- perimental results of Hodgson and Orlowskis and of Ondet and Barbry.' It should be mentioned that scale models also constitute a sound-field prediction method. While the appli- cability of this prediction method has been discussed else- where,9 it is of interest to consider the results of the present study in this light as well.
Given that comparisons were made with only two ex- perimental configurations, this study constitutes only a par- tial or preliminary evaluation of the prediction models.
Further comparisons of this kind are required to establish their validity more definitively.
I. PREDICTION OF FITTED-ROOM SOUND FIELDS Prediction methods-for example, for predicting rever- beration times in concert halls-have existed for years. Most of these methods apply to essentially empty rooms; the pre- diction of sound propagation and sound decay in such rooms is the subject of a recent study. ' O However, these methods do
not in general apply to certain rooms, such as factories, class- rooms, and offices. Such rooms are not empty, but contain many obstacles in the space. These "fittingsv-the many machines, stockpiles, benches, etc., in factories, or the desks, screens, etc., in offices and classrooms-scatter and absorb propagating sound waves, modifying the sound field in the space. Of particular interest to the present study is the effect of fittings on the steady-state noise level in factories. This is quantified by the sound propagation (SP) defined as the variation with distance r from an omnidirectional point source of the sound pressure level L, ( r ) minus the free-field source power level L,:SP(r) = L, ( r ) - L, in dB.
The influence of fittings on room sound fields has been demonstrated experimentally by various researchers. Kut- truff" studied their effect on sound decay in reverberation chambers. Hodgson12 and Hodgson and O r l o w ~ k i ' ~ mea- sured their effect on sound propagation and sound decay in full-size and scale-model factories. Ondet and Barbry7 mea- sured noise levels in a warehouse with various distributions of fittings. Briefly, the introduction of fittings redistributes sound toward a source due to backscattering, resulting in possibly higher noise levels near a source and much lower levels far from a source. Fittings also strongly increase
sound-decay rates; they result in a more diffuse sound field and a larger variety of angles of incidence of sound on the absorbent surfaces, thus increasing sound absorption.
Since the 1960's, many analytic models for predicting noise levels in factories have been developed. The first of these did not specifically model the fittings, only their effect on, for example, the rate of decrease of noise level with dis- tance. Kraak and Jeske14 made the first attempt specifically to incorporate fittings into a prediction model in a one-di- mensional ( 1-D) analysis. Kraak15 extended this to the case of 2-D-scattering cylinders. Jovicic' developed a method-of- images model including more realistic three-dimensionally- scattering fittings. He used a fitted-region impulse response derived by Kuttruff.16 Friberg2 developed an empirical for- mula, based on factory measurements, for predicting the slope of the sound propagation curve from the density and height of the fittings. Lindqvist3 derived a modified fitted- region impulse response to predict factory noise. Hodgson4 extended Jovicic's analysis. Lemire and Nicolas5 incorporat- ed fittings into a method-of-image prediction in a simplified way. Kurze6 proposed a novel analysis based on solving the diffusion equation. Ondet and Barbry7 applied ray-tracing techniques to fitted-factory prediction. KuttruffI7 suggested that fitted rooms could be modeled as empty rooms with diffusely reflecting surfaces. In all of these studies, the au- thors attempted to validate their prediction models in com- parison with experiments in full-size or scale-model rooms containing fittings. In most cases, few details are given of the various experimental-parameter values or of how these were obtained, though excellent agreement between prediction and experiment was usually reported.
It is clearly of considerable relevance to establish the accuracy and applicability of the various prediction models. To do so, they can be compared with one another for various hypothetical configurations. More conclusively, predictions can be compared with controlled experiments in rooms closely representing the theoretical hypotheses and whose relevant parameter values are known. In the case of fac- tories, the two main parameter values that are not known a priori are the surface absorption coefficients, whose estima- tion is discussed in detail elsewhere," and the fitting density and absorption coefficients.
With respect to the fitting density, most prediction mod- els quantify this parameter using the average fitting scatter- ing cross-section volume density, that is, the total fitting scattering cross section divided by the volume in question. Kuttruff16 showed that, in the limit of high frequencies and for spherical obstacles, this quantity, Q in m
',
is equal to S/4V, where S is the total fitting surface area and V is the volume of the region. This factor is in fact the inverse of the mean free path between the fittings. With respect to validat- ing prediction models, clearly real factories, offices, etc., are poor test rooms, since the effective surface areas of the fit- tings are not known. Fortunately, two experimental studies have been made in rooms containing rectangular-parallele- pipedic fittings of known surface area. Hodgson and Or- lowski13 tested a 1:50 scale model with various densities of cubic fittings. Ondet and Barbry7 tested a warehouse con- taining polystyrene blocks as fittings.872 J. Acoust. Soc. Am., Vol. 88, No. 2, August 1990
The applicability of a model depends, in addition to its accuracy, on the extent to which it models the acoustic char- acteristics of typical fitted rooms, such as factories, offices, and classrooms. These characteristics, which should be kept in mind during the discussion, are as follows: The rooms may be of any geometry from quasicubic to highly dispro- portionate and may be subdivided by partial walls, floors, and screens; and the surface absorption may be nonuniform- ly distributed. Factory roofs have high effective absorption at low frequency due to transmission. Rooms may have a carpet or an absorbent ceiling treatment; the fittings are usually predominantly near the floor, though they may be distributed throughout the building; source and receiver po- sitions, while often near the floor, may be anywhere in the building.
II. THE PREDICTION MODELS CONSIDERED
In this section, the seven analytic sound propagation prediction models considered in this study are briefly pre- sented. We discuss their theoretical approaches as well as the assumptions and limitations of each model. Of course, full details and derivations are found in the original papers. Note that all of the models assume an omnidirectional source, surface and fitting absorption characterized by the absorp- tion coefficient, specularly reflecting surfaces, and air ab- sorption quantified by the air-absorption exponent. Note also that all of the models are also capable of predicting the sound propagation in empty rooms ( Q = 0 m -
'
).A. Jovicic model (Ref. 1)
The Jovicic model is based on a basic (i.e., phase and wave sphericity ignored) method of images approach. While more generalized versions exist, those studied here are the versions for which full prediction information (i.e., surface- absorption loss factors) is available. They consider two room shapes: "flat" rooms of infinite length and width; and "duct" rooms of infinite length, and width equal to height. In the flat-room case, the line of image sources is approxi- mated by a continuous linear source; in the duct-room case, the plane of image sources is approximated by a continuous planar source. The source and receiver are assumed to be at half height (flat room) or at half height and width (duct room )
.
In the analysis, the unscattered and scattered energy contributions are treated separately and are then summed. The unscattered-energy analysis is based on that for an emp- ty room; the various surfaces can have different absorption coefficients. However, the scattered-energy analysis as- sumes uniform surface absorption. It further assumes isotro- pically distributed, diffusely scattering fittings with density Q (i.e., described by the Kuttruff expression). The analysis is based on the impulse response derived by Kuttruff16 for infinite fitted regions on the assumption that the lengths of the source/receiver propagation paths are greater than the mean free path between the fittings. Finite regions are dealt with by introducing appropriate boundary reflection condi- tions; in particular, surface absorption loss factors were de- rived for the flat and duct cases. Also, the integration of the
energy contribution over the line or plane source is approxi- mated by a Bessel function, valid for low surface, fitting, and air-absorption losses. Finally, air absorption is accounted for on the assumption that the distances from all images to the receiver are equal to the source/receiver distance. The mod- el involves negligible calculation times.
B. Friberg model (Ref. 2)
The Friberg model is an empirical formula derived from measurements in 48 factories. The sound propagation curve is assumed to be of constant slope (on a logarithmic distance scale) and the slope (in dB/doubling of distance) of the dB(A) curve is predicted. No mention is made of its abso- lute level, necessary for predicting noise levels. In principle, long factories of any shape are modeled. The fittings, of arbi- trary density, are assumed to be located on the floor and to have some average height. Surface absorption is quantified by the ceiling absorption coefficient at "around 1000 Hz." The slope depends on this coefficient and on tabulated con- stants whose values depend on the fitting density and room shape as determined by qualitative descriptors. The model involves negligible calculation times.
C. Lindqvist model (Ref. 3)
The Lindqvist model is based on a basic method-of-im- ages approach. It applies to arbitrary rectangular-parallel- epiped rooms, and any source and receiver positions. The room surfaces can have arbitrary absorption coefficients. The fittings are described by the Kuttruff Q factor. As in the case of the Jovicic model, the unscattered and scattered ener- gies are treated separately. The scattered energy is based on a rigorously derived fitted-region impulse response. The mod- el includes approximate expressions for energy losses due to surface absorption based on assumptions about the room shape and source and receiver positions. Lindqvist also de- rived a modified expression for the fitting scattering cross- section density applicable to the case of large fittings. Lindq- vist predictions involve long calculation times.
D. Hodgson model (Ref. 4)
The Hodgson model is an extension of the Jovicic mod- el, and is thus again based on a basic method-of-images ap- proach. Any long, rectangular-parallelepipedic room and any source and receiver positions can be considered. The line and place source Bessel-function approximations, as well as that associated with air absorption, are not used. However, the model is limited in the scattered-sound analysis by con- sidering uniform surface absorption, zero fitting density as far as the end-wall image sources are concerned, and in re- taining the approximate Jovicic surface-absorption loss ex- pressions. The Hodgson model involves moderate calcula- tion times.
E. Lemire and Nicolas model (Ref. 5)
The Lemire and Nicolas model is also based on a basic method-of-image approach. However, it differs from other such approaches in two ways. First, an analytic expression is used to evaluate the energy contribution of higher-order im-
873 J. Acoust. Soc. Am., Vol. 88, No. 2, August 1990
ages. Second, fittings are assumed to be located on the floor and to have a certain height (which may be equal to the room height). Their density is constant in this lower layer; the upper layer, if it exists, is empty. Sound propagating in the fitted layer is assumed to be attenuated exponentially with the distance traveled in the layer. The attenuation con- stant is to be determined; it is not obviously related to the fitting dimensions nor to the Kuttruff Q factor. The Lemire and Nicolas model involves moderate run times.
F. Kurze model (Ref. 6)
The Kurze model is also based on a basic method-of- images approach. As for the Jovicic flat-room model, the room is assumed to have infinite length and width. In addi- tion, the source and receiver are located on the floor, which is assumed completely nonabsorptive, though the ceiling ab- sorption is variable. Fittings are assumed to be isotropically distributed, and are described by the Kuttruff Q factor. The unscattered and scattered energies are considered separate- ly; the latter contribution is obtained from a solution of the diffusion equation for an infinite region containing weakly absorbing fittings, assuming high ceiling absorption.
It is important to note that Kurze's analysis contains a source of confusion. It assumes the source power is that mea- sured in thepresence of a reflecting floor. All the other mod- els considered here used the free-field sound power ( 3 dB lower). The Kurze model involves short calculation times.
G. Ondet and Barbry model (Ref. 7)
The Ondet and Barbry model is based on ray-tracing techniques. Phase and wave sphericity are ignored. Rays of zero dimension (as opposed, for example, to cones) are con- sidered. The model applies to rooms of any shape defined by planar surfaces, and to arbitrary source and receiver posi- tions. The receiver is a cube of finite side length; the resulting SP levels are thus averages over the cube. The room surfaces can have arbitrary absorption coefficients. Regarding fit- tings, the room can be subdivided into a number of parallele- pipedic subvolumes containing isotropically distributed fit- tings of arbitrary density (described by the Kuttruff Q factor) and absorption. The Ondet and Barbry model in- volves fairly long run times.
Ill. EXPERIMENTATION AND COMPARISONS MADE
In order to evaluate prediction accuracy, and as dis- cussed in detail below, predictions were compared with sound propagation measurements made in a scale-model factory and in a warehouse when empty and containing par- allelepipedic, isotropically distributed fittings. Following are brief details of these two test rooms and the experiments made.
A. Scale-model factory (Refs. 8 and 13)
The 1 5 0 scale model had full-scale (FS) dimensions of 1 lOX 55 X 5.5 mFS high. Its surfaces were of varnished wood. The source, an omnidirectional air jet whose acoustic power had been previously measured, was located at half height and width and at 5 mFS from one end wall. The SP
was measured at receiver locations at half height and width, at distances of 5, 10, 15,20, 30, 50,70, and 90 mFS from the source, and in the nonstandard octave bands centered at 160, 3 15, 630, and 1250 HzFS. Surface absorption coefficients were determined from sound-decay measurements in a simi- lar model with cubic shape (i.e., in an approximately diffuse field). The air absorption was determined from the tempera- ture and relative humidity measured at the time of test. To simulate fittings, blocks of varnished wood were suspended isotropically throughout the model. These were cubes of 2.25 mFS side length. Measurements were made in the mod- el when empty and when containing 110 ( Q = 0.025 mFS -
'
) and 220 ( Q = 0.05 mFS -'
) blocks.The experimental uncertainty associated with the SP measurements has been evaluated and can be as high as 3 dB in certain cases.' This uncertainty includes that associated with the sound power of the air-jet source, this affecting equally all source/receiver distances and thus the absolute level of the SP curve. It also includes contributions whose effect varies with source/receiver distance. This relatively high uncertainty affects the extent to which definitive con- clusions can be drawn from comparisons between predic- tions and scale-model measurements.
Results are presented here for the 630-HzFS octave band, for which the experimental uncertainties and possible standing-wave effects are relatively small. At this frequency, the surface and fitting (varnished wood) absorption coeffi- cient was 0.07 and the air-absorption exponent averaged 0.001 Np/m. Note that the highly disproportionate shape of the scale model and the nondiffuse sound field associated with such a shape imply that the use of the diffuse-field coef- ficient in all predictions is a source of error, though this would be expected to be small.
B. Full-size warehouse (Ref. 7)
Sound propagation measurements were carried out by the INRS, Nancy, France in a rectangular-parallelepipedic, factorylike room built inside an empty warehouse. The test room had dimensions of 30 X 8
x
3.8 m high. The floor was of concrete, the walls were of concrete block, and the sus- pended ceiling was of mineral wool with an aluminum-foil facing on the inner surface. The source, an omnidirectional loudspeaker array of known sound power, was located near one corner at a height of 0.85 m. Measurements were made, in octave bands from 125-4000 Hz, at receiver positions along the length of the test room at half width and at a height of 1.5 m. The warehouse contained 40 polystyrene blocks with dimensions of 0.5 ~ 0 . 5x
3 m high, corresponding to Q = 0.135 m -'
.
The blocks were located at the centers ofthe 40 subsurfaces created by dividing the floor into 3- (length) X 2-m (width) areas, and all had the same orienta- tion. Note that this, and the fact that the fittings did not extend to full height, means that their distribution was not completely isotropic.
The results used in this study are those published for the 2000-Hz octave band. According to the authors, and based on measurements and tabulated data, the relevant absorp- tion coefficients are: floor = 0.05, walls = 0.1, ceil- ing = 0.15, and fittings = 0.3. An air-absorption exponent
874 J. Acoust. Soc. Am., Vol. 88, No. 2, August 1990
of 0.003 m -
'
, corresponding to a temperature of 20 "C anda relative humidity of 5096, was used in the predictions. The measured SP levels were obtained from the published fig- ures.
C. Comparisons made
Except in the case of the Friberg model, as discussed below, comparisons were made between predicted and mea- sured SP curves for the following cases: scale model, 630 HzFS, Q = 0,0.025,0.05 mFS
'
; and warehouse, 2000 Hz. Comparisons were also made between the various predic- tions for the scale-model configuration with Q = 0.1 mFS'
.
While it was not practical to make measurements with this fitting density, it is more representative of the aver- age fitting density in real factories; it was thus of interest to evaluate the analytic models in this case. Predictions were made using the appropriate geometries, absorption coeffi- cients, source and receiver positions, air-absorption expo- nents, and, except as discussed below, isotropic Q values.As mentioned above, the Lemire and Nicolas model quantifies the fitting density using a parameter whose rela- tion to the fitting dimensions is not known. Thus predictions were made for an appropriate range of values of this param- eter.
Regarding Friberg prediction, it requires a value for the ceiling absorption coefficient at about 1000 Hz. The coeffi- cients for 630 HzFs (scale model) and 2000 Hz (ware- house) were used here, introducing a source of error. Also, the Friberg model quantifies the fitting density, assuming the fittings to extend from the floor upward, according to their height and floor area covered. In the case of the scale model with suspended fittings, it is not obvious which fitting classification, if any, applies. Thus predictions were made for the complete range (low to high) of fitting densities. Note that Friberg states that a low fitting density also de- scribes empty factories.
IV. RESULTS AND DISCUSSION A. Preliminary observations
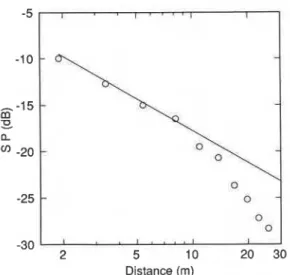
It is appropriate to make several preliminary observa- tions concerning the experimental results. Figure 1 shows the SP curves measured in the scale model with the three fitting densities; and Fig. 2 shows the SP curve for the fitted warehouse. Two general tendencies are apparent. First, in all fitted configurations the SP curves are convex-that is, their slope increases with distance. Second, as is clear from Fig. 1, increasing the fitting density has little effect on SP levels within about 20 m of the source, but strongly decreases levels at larger distances. These tendencies are similar to those measured in other full-sized, fitted factories.12
B. Accuracy of the Friberg model
Figure 1 compares the SP curves measured in the fitted scale model with those predicted for low, medium, and high fitting densities using the Friberg model. Figure 2 compares the measured and Friberg-predicted curves for the ware- house. Clearly, the Friberg model deviates from experiment in assuming a constant SP curve slope. Apparently a double
-40
0
-405 10 20 50 100 5 10 20 50 100
Distance (m) Distance (m)
FIG. 1. Sound propagation curves in the scale model as measured ( 0 , Q = 0
,-
I. ,A,
Q = 0.025 m - '; 0, Q = 0.05 m I ) and as predicted by the Fri-berg model for low (upper curve), medium, and high (lower curve) fitting densities. The vertical position of the predicted curves has been chosen arbi- trarily.
slope would be considerably more accurate. While the pre- dicted slope increases with fitting density, as found experi- mentally at large distances, only in the warehouse at short distances is there any agreement between the predicted and short- or long-distance predicted slopes, and this may be fortuitous. In particular, Friberg overestimates the slope in the empty scale model.
C. Accuracy of the Lemire and Nicolas model
Figure 3 shows the SP curves measured in the scale model and those predicted using the Lemire and Nicolas model with decay constants of 0,0.01,0.05, and 0.09 m p
'
.
Figure 4 shows the curves measured in the warehouse and those predicted with decay constants-of 0.01, 0.15, and 0.3 m-'
.
In the case of the empty model, Lemire and Nicolas prediction agrees well with those of Lindqvist and Hodgson, as expected; this will be discussed further below.FIG. 3. Sound propagation curves in the scale model as measured with three fitting densities ( 0 , Q = O m
';
A,
Q = 0.025 m - I; 0, Q = 0.05 m ) and as predicted by the Lemire and Nicolas model for decay constant values of Om - ' (upper curve), 0.01 m - ', 0.05 m I, and0.09 m (lower curve).Regarding the three fitted configurations, the Lemire and Nicolas model deviates from experiment in predicting, for any value of the decay constant, a concave (slope de- creasing with distance) SP curve. Furthermore, while it cor- rectly predicts levels that decrease with increasing fitting density at large distances, that it also does so at short dis- tances does not agree with experiment. For no value of the decay constant is good agreement between prediction and experiment found or, obviously, possible. Apparently, mod- eling the effect of fittings on sound propagation as a simple exponential decrease is not correct. In particular, it leads to levels at short distances being significantly underestimated. This is explained by its not accounting for SP level increases due to backscattering from the fittings.12
D. Empty-factory prediction
While it is not the main objective of this report, since all of the models are capable of predicting the sound propaga-
-30 2 5 10 20 30 Distance (m) -30
'
I. . . .
I I I 2 5 10 20 30 Distance (m)FIG. 2. Sound propagation curves in the warehouse as measured (0) and as FIG. 4. Sound propagation curves in the warehouse as measured ( 0 ) and as
predicted by the Friberg model (-). The vertical position of the predicted predicted by the Lemire and Nicolas model for decay constant values of curve has been arbitrarily chosen. 0.01 m 1 (upper curve), 0.15 m - ' , and0.3 m 1 (lower curve).
tion in empty ( Q = 0 m -
'
) rooms and since measurements were made in the empty scale model, it is of interest to com- ment on the accuracy of the various models in this case, which has been discussed in detail elsewhere.'' Figure 5 ( a ) shows the measured curves, and the corresponding predic- tions by the Jovicic (flat), Hodgson, Kurze, Lindqvist, and Ondet and Barbry models. Note that with width-to-height and length-to-height ratios of 10 and 20, respectively, the scale model is a good approximation to the flat rooms mod- eled by the Jovicic and Kurze models considered here.Clearly, the Hodgson, Lindqvist, and (as discussed above, see Fig. 3) Lemire and Nicolas models predict very similar levels. This is expected since the three method-of- images models are essentially the same in the case of no fit- tings. The slight differences can be explained by different convergence criteria. Note that this also demonstrates the accuracy of the Lemire and Nicolas analytic expression for the contribution of higher-order images. Predictions by the Ondet and Barbry ray-tracing model are almost identical to those by the image models.
Clearly, the Jovicic (flat) and Kurze model predictions, while similar to one another, are significantly lower than the others. This can be explained by their not accounting for side-wall reflections. Predictions made using the Hodgson model for very large width and length were within 0.1 dB of those by the Jovicic (flat) model. The Kurze model predicts higher levels since it assumes a source on a nonabsorptive floor. It is clearly not adequate, even in this very wide and long room, to ignore the vertical surfaces.
Comparing predictions by the Hodgson, Lindqvist, and Lemire and Nicolas models with experiment, it can be seen that, while the curves are of similar shape, the predicted levels are about 2 dB higher. The agreement is slightly worse at large distances, since the slight down-turning of the ex- perimental curve is not predicted. These results are dis- cussed in detail elsewhere.'' The fact that predicted levels
Distance (m) Distance (m)
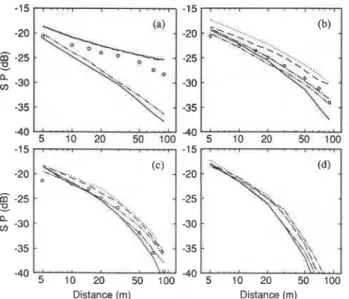
FIG. 5. Sound propagation curve in the scale model with four fitting densi- ties [ ( a ) Q = O m 1 ; ( b ) Q=0.025m1; ( c ) Q=0.05m1; ( d ) Q=O.l
m-'1 as measured (0) and as predicted by the following models: (-), Jovicic (flat); (---), Lindqvist; (---), Hodgson; (----), Kurze; ( - - -
), Ondet and Barbry.
?re generally higher can be explained by experimental er- rors, those at large distances by a parameter, such as diffuse surface reflection, not having been modeled theoretically.
E. Fitted-room prediction
Figure 5(b)-(d) shows the SP curves measured in the fitted scale model and those predicted by the Jovicic (flat), Hodgson, Kurze, Lindqvist, and Ondet and Barbry models. Figure 6 shows the corresponding results for the warehouse. First, note that all models predict convex SP curves, in agreement with experiment.
Considering the Jovicic (flat) and Kurze models, these tend to predict levels lower than measured, the differences being greatest in the warehouse, and decreasing with in- creasing fitting density. This can again be explained by these models not including vertical surfaces that are more impor- tant in the narrow warehouse, and whose importance de- creases with increasing fitting density. In general, and in- creasingly with distance, Kurze predicts higher levels than Jovicic (flat). The fact that this is not the case at short dis- tances and low fitting density can be explained by the Bessel- function approximation, which overestimates in such cases.4 Note also that both the Jovicic (flat) and Kurze models predict SP levels that increase with fitting density at short distances, in disagreement with experiment.
The warehouse, with a width-to-height ratio of 2.1, is perhaps closer to a Jovicic duct room than to his flat room. Thus it is relevant to compare Jovicic (duct) prediction with the warehouse results. To do this, the duct side length must be chosen. In the case of a room with nonsquare cross sec- tion, several choices are possible for the side length. It can be set equal to the height, the width, the average dimension, or that value that conserves the cross-sectional area. Note that if the cross-sectional area is not correctly modeled, neither is the fitting density. Predictions were first made with a side length equal to 5.5 m, thus preserving the cross-sectional area and fitting density. Predicted levels were 1 . 5 4 dB be- low those measured. Though it implies a more densely fitted
c
-40
5 10 20 30
Distance (m)
FIG. 6. Sound propagation curves in the warehouse as measured (0) and as predicted by thefollowingmodels: (-), Jovicic (flat); (-), Jovicic (duct) with sidelength = 3.8 m; (---), Lindqvist; (---), Hodgson; (--),
Kurze; (- - -), Ondet and Barbry.
room, prediction with a side length equal to the true room height gave best agreement with experiment, as shown in Fig. 6. That better agreement cannot be obtained is likely due to the source and receiver not being at half height and width.
Consider now the Hodgson and Ondet and Barbry pre-
dictions. With Q = 0.025 m -
'
[Fig. 5(b)1 ,
they predict lev-els that are higher than those measured. Hodgson prediction is slightly higher, which can be explained by the low preci- sion of the Kuttruff impulse response at very low fitting den- sity. Lindqvist predictions agree well with experiment. For
Q = 0.05 m -
'
[Fig. 5 ( c )1,
Hodgson and Ondet and Barbrypredictions are very similar and are higher than experiment. The Lindqvist model predicts levels that are lower than ex-
periment at all but the largest distances. For Q = 0.1 m -
'
[Fig. 5 ( d )
1,
Hodgson and Ondet and Barbry predict similarlevels, with Lindqvist prediction being somewhat lower. This is also the case in the warehouse (Fig. 6) for which Hodgson and Ondet and Barbry agree well with experiment and Lindqvist is lower by several dB. The explanation for the low Lindqvist levels is not known. Note also that as the fit- ting density increases and, therefore, the underestimation due to ignoring the vertical walls decreases, Jovicic (flat) and Kurze predictions approach those of Hodgson and On- det and Barbry. Finally, regarding the variation of short- distance levels with increasing fitting density, the Hodgson model predicts slight increases, the Lindqvist model predicts slight decreases, and the Ondet and Barbry model predicts no significant change, in agreement with experiment.
V. CONCLUSIONS
The following conclusions regarding the accuracy and applicability of the various prediction models are consistent with the results of the comparisons between prediction and experiment, with the comments on the accuracy of the ex- perimental results, and with the general characteristics of typical factories.
( a ) The SP levels measured in the scale model are in general about 2 dB low due to source calibration errors. Giv- en the other limitations of small scale modeling tech-
n i q u e ~ , ~ , ~ , ' ~ scale models appear to constitute an inaccurate
prediction method.
(b) The Friberg model incorrectly predicts the shape of the SP curves, does not specify how to fix their absolute levels, and is therefore apparently of little applicability.
( c ) The Lemire and Nicolas model, while of consider- able interest for empty-room prediction, is of little applica- bility to fitted-room prediction. Its assumption of exponen- tial attenuation due to fittings is incorrect, and leads to incorrect predictions of the SP curve shape and, in particu- lar, underestimated levels at short distances. The analytic expression for the contribution of higher image orders is ac- curate.
( d ) The Jovicic (flat) model tends to underestimate lev- els since it ignores vertical-wall reflections. The underesti- mation only is negligible in very wide and long rooms with sufficiently dense fittings. The model tends to overestimate levels at low fitting densities due to the Bessel-function ap- proximation. The assumptions of uniform surface absorp-
tion and isotropic fittings may limit applicability in some cases.
( e ) The Jovicic (duct) model predicts SP in long duct rooms with source and receiver on the duct centerline with reasonable accuracy. Further study is required to determine how to assign the duct side length in the case of rooms with height not equal to width. The assumptions of uniform sur- face absorption and isotropic fittings may limit applicability in some cases.
(f) The Kurze model tends to underestimate levels in ignoring vertical-wall reflections, and to overestimate levels in the case of sources not located immediately against a hard floor. The assumptions regarding surface absorption and fit- ting distributions may limit applicability.
(g) The Lindqvist model gives accurate predictions in rooms that are empty or have low-density fittings, but in- creasingly underestimates levels as the fitting density in- creases. Note that this conclusion is in disagreement with reported findings of Ondet and of Jovicic, who made inde- pendent comparisons of predictions by their and Lindqvist's model and found good agreement at high fitting densi- ties.",19 The assumption of isotropic fittings may limit the applicability of the model in many cases.
( h ) The Hodgson model gives accurate predictions in long rooms with uniform surface absorption and isotropic, sufficiently dense fittings. At low fitting densities, levels are overestimated.
( i ) The Ondet and Barbry ray-tracing model provides accurate predictions in all applicable cases. In addition, this is the only model that is applicable to nonparallelepipedic rooms and to rooms with nonisotropic fittings. Though it requires significant computing resources, this model far out- performs the others tested and appears to be the best choice for fitted-room prediction.
Finally, it must be emphasized, given that comparisons were made with only two experimental configurations, that this study constitutes only a partial or preliminary evalua- tion of the prediction models. Further comparisons are re- quired to establish their validity more definitively.
ACKNOWLEDGMENTS
The author would like to acknowledge the contribution to this work made by Gilles Morel, Ecole Nationale des Tra- vaux Publics de l'Etat, Lyon, France who programmed sev- eral of the models and made many preliminary predictions during his "stage" at the Universitt de Sherbrooke. He would also like to thank Ralf Friberg, Svetozar Jovicic, U1- rich Kurze, and Elizabeth Lindqvist for their comments on the draft manuscript.
I S. Jovicic, Anleitung zur Vorausbestimmung des Schallpegels in Betriebs-
gebauden (Miiller-BBM GmbH, Plannegg bei Munchen, 1979).
R. Friberg, Noise Control Vib. Reduct. 6,75-79 ( 1975).
E. A. Lindqvist, Appl. Acoust. 16, 183-214 ( 1983).
4 M . R. Hodgson, "Physical and theoretical models as tools for the study of [AV:factory sound fields," Ph.D. dissertation, University of Southamp- ton (1983).
5 G . R. Lemire and J. Nicolas, Noise Control Eng. J. 24, 58-67 (1985). 6U . J. Kurze, J. Sound Vib. 98,349-364 (1985).
'A. M. Ondet and J. L. Barbry, J. Acoust. Soc. Am. 85,787-796 (1989). 8 M . R. Hodgson and R. J. Orlowski, J. Sound Vib. 1 1 3 , 2 9 4 6 (1987).
I
877This paper is being distributed in reprint form by the Institute for Research in Construction. A list of building practice and research publications available from
the
Institute may be obtained by writing to Publications Section, Institute for Research in Construction, National Research Council of Canada, Ottawa, Ontario, KIA 0R6.
Ce document est distribu6 sous forme de tir6-a-part par 1'Institut de recherche en construction.