Characterizing Ash Properties and Effects on Diesel Particulate
Filter Flow Resistance
by
Gregory James Monahan
B.S., Mechanical Engineering Villanova University, 2014
Submitted to the Department of Mechanical Engineering in Partial Fulfillment of the Requirements for the Degree of
Masters of Science in Mechanical Engineering
at the
Massachusetts Institute of Technology
June 2016
© 2016 Massachusetts Institute of Technology. All rights reserved.
Signature of Author:
Department of Mechanical Engineering May 18, 2016
Certified by:
Victor W. Wong Principal Research Scientist and Lecturer in Mechanical Engineering Thesis Supervisor
Accepted by:
Rohan Abeyaratne Professor of Mechanical Engineering Graduate Officer
2
3
Characterizing Ash Properties and Effects on Diesel Particulate
Filter Flow Resistance
by
Gregory James Monahan
Submitted to the Department of Mechanical Engineering on May 18, 2016 in Partial Fulfillment of the Requirements for the Degree of
Masters of Science in Mechanical Engineering
ABSTRACT
As a result of increasingly stringent emissions regulations, Diesel Particulate Filters (DPF) have become a widespread method of reducing particulate emissions in both on and off highway diesel engine use. This particular aftertreatment system is chosen for its high filtration efficiency and relative simplicity. The porous ceramic substrate captures the particulate matter which is comprised of combustible soot and inorganic metallic ash. While the soot can be cleared from the filter through high temperature oxidation, the small amount of ash remains in the filter. The presence of these soot and ash particles creates an increase in the flow resistance of the filter which creates more backpressure on the engine and results in a decrease in fuel economy.
Over the life of the filter, the ash particles become a significant portion of particulate matter in the filter and the resulting flow resistance. While the effects of ash and soot on filter performance have been extensively studied, the underlying deposition mechanisms and effects of various ash properties are not well understood. The focus of this research is to investigate the effects of ash properties such as packing density and chemistry on the flow resistance of both the ash cake layer and the filter substrate. The results of this and other research can support the optimization of operating conditions, regeneration strategies, and lubricant additive formulations for decreased system backpressure.
Additionally, this research seeks to develop and improve advanced diagnostic tools in order to bridge the gap between macro scale quantifiable flow resistance and micro scale deposition characteristics. Using both high resolution X-Ray CT imaging and flow simulation tools, a method is tested by which values for ash and filter permeability can be calculated to investigate local micro scale filter phenomena or various lab and field samples.
Thesis Supervisor: Victor W. Wong
4
5
ACKNOWLEDGEMENTS
My time at MIT has been a uniquely wonderful opportunity to challenge my own engineering abilities, work with some of the brightest people I have ever met, and find something new to learn every day. It would not have been possible without the support of my family, the faculty, and the many students with whom I have worked.
First, I would like to thank my thesis advisor, Dr. Wong, for giving me the opportunity to come to MIT, to conduct research in the Sloan Automotive Lab, and to learn and grow as a young engineer. Under his guidance, I learned the skills necessary to manage my time and projects and to think critically and solve the many problems that arise in experimental work. He not only emphasized the importance of graduate research, but also how to apply the knowledge learned here to be successful in industry.
My research would not have been possible without the support of the Aftertreatment Research Consortium. I learned a great deal from speaking with and presenting to the many industry representatives at our meetings.
I would like to give a special thanks to Dr. Kamp for being an incredible mentor and friend. His work ethic, passion for science, and wealth of knowledge have been an inspiration to me and have motivated me to constantly strive to do better work. Much of my research would not have been possible without his efforts.
I also want to thank Dr. Sappok for all of his support. He helped to make my transition to MIT and graduate research a smooth one through his guidance and his availability to help with any issue. I constantly borrowed from his experience and expertise in order to complete my research objectives.
My research would not have been possible with all of the help of the fantastic Sloan personnel. Thane DeWitt and Raymond Phan constantly went above and beyond to keep the lab running even in the midst of renovations and make sure our experimental setups were in working order. Janet Sabio was always behind the scenes making sure we had everything we needed. Their knowledge and expertise were invaluable and their company made the lab a pleasant workplace.
To my lab mates, Nick Custer, Paul Folino, Michael Arnold, Yosuke Obuchi, Yuesen Wang, Claudio Marciano, Amanda Hamlet, and Vicky Lee, thank you for making my time in the lab particularly enjoyable. With your help and friendship, my experience was infinitely more productive and memorable.
I would also like to thank the many people I have met at MIT. I have made some lifelong friends and have been able to work together on some incredible projects that have defined my
experience at MIT.
Finally, I would like to thank my family. I never imagined I would be able to attend MIT and could not have done it without their love and support. This has been a once in a lifetime experience and it would not have been possible without all of your sacrifices.
6
7
CONTENTS
ABSTRACT ... 3 ACKNOWLEDGEMENTS ... 5 LIST OF FIGURES ... 9 LIST OF TABLES ... 11 NOMENCLATURE ... 13 1. INTRODUCTION ... 15 1.1. Diesel Engines ... 161.1.1. Diesel Engine Advantages ... 17
1.2. Diesel Engine Emissions ... 18
1.2.1. Emission Reduction Methods... 19
2. DIESEL PARTICULATE FILTERS ... 22
2.1. DPF Fundamentals ... 22
2.2. Lubricant Derived Ash ... 23
2.2.1. Ash Sources and Chemistries ... 25
2.3. Ash Effects on DPF Performance ... 26
2.3.1. Lubricant Additive Chemistry Effects ... 29
3. EXPERIMENTAL SETUP AND APPROACH ... 34
3.1. Compressed Ash Permeability Experiment ... 34
3.1.1. Experiment Design ... 34
3.1.2. System Design ... 35
3.1.3. Test Matrix and Procedure ... 39
3.2. Initial Pore Build-up and Lubricant Chemistry Experiment ... 41
3.2.1. System Design and Setup ... 42
3.2.2. Test Plan ... 46
4. RESULTS ... 50
4.1. Compressed Ash Permeability Experiment ... 50
4.1.1. Pressure Drop Results and Repeatability ... 50
4.2. Initial Pore Build-up and Lubricant Chemistry Experiment ... 59
4.2.1. Pressure Drop Results ... 59
4.2.2. Post Mortem Analysis ... 65
5. ADVANCED DIAGNOSTIC ANALYSIS ... 70
8
5.1.1. Background ... 71
5.1.2. Sample Preparation and Setup ... 73
5.1.3. Test Plan ... 77
5.2. Image Processing and Analysis ... 78
5.2.1. Imaging Results ... 78
5.2.2. Segmentation Methods ... 85
5.2.3. Porosity Results ... 87
5.2.4. Permeability Analysis ... 90
6. CONCLUSIONS AND FUTURE WORK ... 94
6.1. Compressed Ash Cake Layer Permeability ... 94
6.2. Initial Pore Buildup Pressure Drop and Post Mortem Analysis ... 94
6.3. High Resolution X-Ray CT Imaging Method Development ... 95
6.4. Future Work and Recommendations ... 96
9
LIST OF FIGURES
Figure 1.1: EPA NOx and PM Standards Over Time ... 19
Figure 2.1: Flow Direction of Wall Flow Monolith DPF ... 22
Figure 2.2: Portion of Filter PM Consisting of Ash Over Filter Life ... 24
Figure 2.3: Typical Location of Ash Deposition Within a DPF ... 24
Figure 2.4: Stages of Ash Deposition in DPF and Effect on Pressure Drop in [4] ... 27
Figure 2.5: Effect of Ash Loading on Soot Loaded Pressure Drop Increase in [17] ... 28
Figure 2.6: Pressure Drop Trends of Several DPFs Loaded with Single Additive Ash Chemistries ... 30
Figure 2.7: Morphology Variation Due to Ash Chemistry ... 30
Figure 3.1: Schematic of Flow Bench... 36
Figure 3.2: Ash Loading Process for Accurate Density ... 36
Figure 3.3: Design of Wafer Holder ... 38
Figure 3.4: The Stages of Wafer Sample Preparation and Loading ... 39
Figure 3.5: MIT Accelerated Ash Loading System Schematic ... 43
Figure 3.6: Design of New Filter Holder for Quick Removal ... 45
Figure 4.1: Pressure Drop vs Flow Rate for a Test Ash for Repeatability ... 50
Figure 4.2: Slope of Pressure Drop vs Flow Rate Curves at Each Packing Density for 6 Repeatability Runs ... 52
Figure 4.3: 95% Confidence Interval of Slopes over 6 Repeatability Runs ... 52
Figure 4.4: Pressure Drop Slopes vs Packing Density for Each Ash Type ... 53
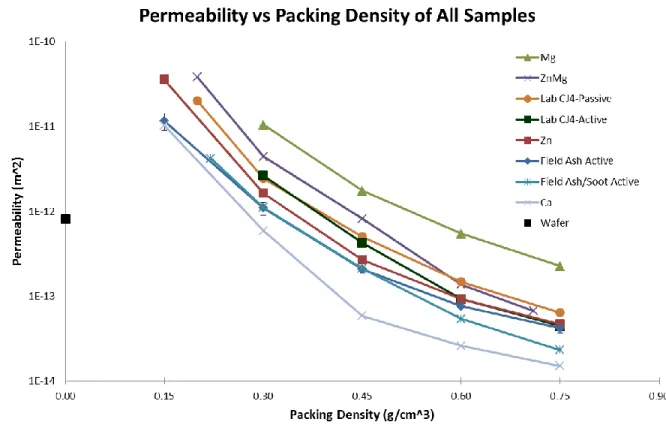
Figure 4.5: Permeability vs Packing Density for All Lab and Field Samples on Log Scale ... 55
Figure 4.6: Comparison of Lab and Field Ash Permeability ... 56
Figure 4.7: Comparison of Lab Generated Ash Permeability of Various Lubricant Additive Compositions ... 57
Figure 4.8: Relative Permeability Comparison Normalized to Magnesium At Each Packing Density ... 58
Figure 4.9: Sample Pressure Drop Data At Each Soot Loading Level ... 60
Figure 4.10: DPF Pressure Drop Increase Due to PM Loading for Normalization ... 61
Figure 4.11: Pressure Drop vs Ash Load for Three Mg Ash Loaded Filters ... 62
Figure 4.12: Pressure Drop vs Ash Load for Remaining Two Ca Ash Loaded Filters ... 62
Figure 4.13: Cracked Exit Channels on Ca Filter 1 ... 63
Figure 4.14: All Pressure Drop Vs Ash Load Measurements for Both Oil Types ... 64
Figure 4.15: Pressure Drop Data Overlaid with Previous Results ... 65
Figure 4.16: Low Resolution X-Ray CT Image of Ash Plug for Ca Ash Loaded Filter ... 65
Figure 4.17: X-Ray CT Image of Inside of Mg Ash Loaded Inlet Channel ... 66
Figure 4.18: SEM Images of Mg Ash Loaded Surface Pores ... 67
Figure 4.19: SEM Images of Ca Ash Loaded Surface Pores ... 67
Figure 5.1: Diagram of X-Ray CT Source, Sample, and Detector Setup ... 71
Figure 5.2: Typical Stepwise Process of Filter X-Ray CT Scanning Through Smaller Samples (Kamp) ... 72
Figure 5.3: Diagram of Loss of View of Non-Centered Sample at High Magnification ... 74
Figure 5.4: Single Channel Holder to Center the Filter Sample ... 75
10
Figure 5.6: Comparison of Previous Highest Resolution CT Image with Early Results of Coated Single Channel Using New Methods ... 79 Figure 5.7: Samples of 3D data of Single Channels of Clean Coated (left, Case 3) and Clean Uncoated (right, Case 2) Filters ... 80 Figure 5.8: Difference in Channel Wall Surface Between Clean Uncoated (Case 2) and Clean Coated Samples (Case 3) ... 80 Figure 5.9: Side by Side Comparison of Clean Uncoated Filter Surface with SEM Image (Case 2) ... 81 Figure 5.10: Side by Side Comparison of Clean Coated Filter Surface with SEM Image (Case 3) ... 82 Figure 5.11: Slice Through Large Porous Ash Particle Compared to FIB and SEM Image ... 83 Figure 5.12: 2D CT Slice (left) Demonstrating Ash in Surface Pores Compared With SEM Image (right)(Kamp) ... 83 Figure 5.13: 3D Image of Field Generated Ash Loaded Sample From Case 7 ... 84 Figure 5.14: Side by Side Comparison of Single Additive Ash Types from Case 5 (b) and Case 6 (a) ... 85 Figure 5.15: Image Grayscale Histogram and Threshold Effect on Measured Filter Porosity ... 86 Figure 5.16: Segmented Subsection of Filter Wall and Ash Cake Layer ... 87 Figure 5.17: Region of Measured Porosity in 2D Slice (left) vs Region of Measured Volume Porosity Over All Slices (right) ... 88 Figure 5.18: Comparison of Porosity of 10 Slice Average vs Volume Porosity of Two Filter Sections of Case 1 ... 89 Figure 5.19: Porosity Variation Through Wall Thickness for Coated (Case 3) and Uncoated Filter (Case 2) Samples... 89
11
LIST OF TABLES
Table 2.1: Results of Permeability Estimations in [19] ... 32
Table 3.1: Contributions to DPF Pressure Drop ... 35
Table 3.2: Test Matrix for Ash Cake Layer Permeability Experiment ... 40
Table 3.3: Lubricant Elemental Composition Used in the Experiments Described in [5] ... 40
Table 3.4: Accelerated Ash Loading System Operating Conditions ... 44
Table 3.5: Specifications of Diesel Engine for Soot Loading ... 44
Table 3.6: Lubricant Additive Formulation for Experimental CJ4 Oils ... 47
Table 3.7: Filter Specifications for Ash Loading Experiment ... 47
Table 5.1: List of Samples Scanned Using X-Ray CT and Type of Scan ... 77
Table 5.2: Comparison of Simulated Permeability from 3D Image Data with Previous Wall Permeability Calculations ... 92
12
13
NOMENCLATURE
AFR – Air/Fuel Ratio CI – Compression Ignition CO – Carbon Monoxide CPSI – Cells Per Square Inch CR – Compression Ratio DPF – Diesel Particulate Filter ER – Expansion Ratio
ESEM – Environmental Scanning Electron Microscopy FIB – Focused Ion Beam
HC – Hydrocarbon IC – Internal Combustion
ICE – Internal Combustion Engine NOx – Nitrogen Oxides
PM – Particulate Matter
SCR – Selective Catalytic Reduction SI – Spark Ignition
SV – Space Velocity TDC – Top Dead Center
TEM – Transmission Electron Microscope X-Ray CT – X-Ray Computed Tomography ZDDP – Zinc Dialkyldithiophosphates
14
15
1.
INTRODUCTION
The diesel engine is a reciprocating internal combustion (IC) engine that is used widely in transportation and power generation. The engine generates power through the combustion of an air and fuel mixture that drives a piston producing mechanical work. The diesel engine differs from a typical spark ignition engine in that the air is compressed to a high pressure and
temperature and the diesel fuel is then injected, evaporated, and auto-ignited as opposed to the ignition energy being delivered from a spark plug. [1]
The diesel engine is extremely successful because it is a highly efficient power plant. Its high efficiency comes from the high compression ratios that it allows and low engine speeds. There is no concern for knock due to the injection scheme which is a typical concern for high
compression in spark ignition (SI) engines. This higher efficiency also results in a lower CO2 output compared to gasoline engines but it has a lower specific output. These result in diesel engines being more effective for larger scale marine, highway, and power generation uses.
One major downside to diesel engines is the generation of a high amount of particulate matter or PM. This PM is a combination of carbon soot from locally rich regions of combustion and a metallic incombustible ash from lubricant additives. Both of these are hazardous to human health and can cause significant health issues. As a result, aftertreatment systems are used to collect and prevent these emissions. One of the major aftertreatment systems used and is the focus of this work is the diesel particulate filter (DPF) which is a porous ceramic honeycomb filter with filtration efficiencies up to 99%. The filter traps the soot and ash in its porous structure and allows the clean exhaust gasses to pass through. The collection of soot and ash, however, has a negative effect on filter performance and pressure drop and can also decrease the life of the filter. This increase in pressure drop can also decrease the efficiency and fuel economy of the system as well as increase operating and maintenance costs. There is a significant need to understand the deposition mechanisms, properties, and effects of this PM at both a macroscale level and a microscale level to increase filter performance and lifetime. The focus of this work will be a combination of micro and macro scale experiments and analysis to better understand the range of effects on the DPF.
16
1.1.
Diesel Engines
The diesel engine was first created by Rudolph Diesel in 1892 and he subsequently built his prototype compression ignition engine in 1897. As mentioned, the primary difference between an SI engine and CI engine is the method of ignition of the fuel. This type of reciprocating internal combustion engine utilizes the high pressure compressed air and accurately timed fuel injection to produce combustion and release the energy required to create usable mechanical work. [1]
During the intake stroke, air is pulled at near atmospheric pressure into the cylinder through the motion of the piston. The intake valve then closes and the engine goes through the compression stroke. This is an area of significant difference with a typical SI engine since CI engines have typical compression ratios (CR) in the range of 12 – 24 compared to 8 – 12 in SI engines. The equation for thermal efficiency of an engine is shown below and is a function of CR assuming CR is equal to expansion ratio (ER). [1]
𝜂 = 1 − (
1
𝐶𝑅
(𝛾−1))
Thus, the higher compression ratio of the CI engine results in a higher thermal efficiency. CI engines can reach cylinder pressures as high as 40-50 bar and temperatures up to 800 - 1000⁰C during this compression stroke. Prior to the completion of the compression stroke at top dead center (TDC), atomized liquid fuel is injected into the cylinder at high pressure. This liquid fuel becomes entrained in the air and creates a combustible air-fuel mixture. The high temperature and pressure of the cylinder after the compression stroke ignites the mixture and the release of energy creates the work in the expansion stroke to drive the crankshaft. This work also drives the required pumping to push air out during the exhaust stroke and in during the next intake stroke. [1]
Another major difference between SI and CI engines is the method by which load is modulated or restricted. In a typical SI engine, the intake air is throttled using a valve. SI engines determine the amount of fuel to be injected based on the amount of throttled intake air comes in and a target
17
air/fuel ratio (AFR). CI engines, however, are not throttled and modulate their load purely
through the amount of fuel injected. CI engines typically run very lean and so are not as sensitive to small changes in AFR as SI engines since they do not run at stoichiometric. These differences lead to some advantages and disadvantages compared to SI engines. [1]
1.1.1. Diesel Engine Advantages
There are several distinct advantages of diesel engines compared to traditional SI engines as a result of the differences mentioned above. The most obvious and significant advantage is the higher efficiency of the engine which leads to better fuel economy and decreased greenhouse gas emissions. Because of the relative simplicity of the diesel engine and lack of knock concerns, there is also increased durability, reliability, and lower maintenance costs. The unthrottled operation of the diesel engine also results in decreased pumping losses which results in higher efficiency. All of these combined improvements translate to a 20 – 40% in fuel economy when compared to a similar output SI engine. [1]
Another benefit of the lean engine operation is the minimal amount of unburnt fuel remaining in the cylinder after each burn cycle. This results in lower hydrocarbon (HC) emissions which have negative impacts on human health. The higher AFR also greatly reduces the amount of carbon monoxide emissions (CO) which are directly related due to the high availability of oxygen for complete combustion. [3]
The heat release from diesel engines occurs at a faster rate and earlier in the combustion process which results in much higher torque at low speeds than SI engines. This operation at low speeds has distinct advantages. Frictional losses are reduced since they are speed dependent and lower operating speed also increases the reliability of the system and allows for larger engines. The heat losses also decrease with size which means that the diesel engine scales very well. This means that the diesel engine is an effective means of power generation for a wide range of applications. [1]
18
1.2.
Diesel Engine Emissions
As mentioned before, one of the disadvantages of diesel engines are some of the emissions that are created. The two primary emissions of concern with diesel engines are nitrogen oxides (NOx)
and PM. NOx emissions are generated at high temperatures and pressures where oxygen can
react with relatively stable N2 molecules. This means that NOx generation is higher than in a
similar power SI engine because of the diesel engine’s higher CR. PM or carbonaceous soot, on the other hand, is a result of the fuel injection and mixing differences of a direct injection system like a diesel engine. While the full cylinder volume contains a very lean mixture of air and fuel, the effect of injecting atomized liquid fuel into the cylinder just before ignition is that there is locally a very heterogeneous mixture. Locally rich regions of air and fuel do not fully oxidize and creates this soot or ash if the local region includes lubricant. Finding methods for improved fuel air mixing is a large area for mitigation of PM generation but one main method to decrease soot generation is to increase cylinder temperatures. Higher cylinder temperatures lead to more complete oxidation of the carbon soot particles even after the initial burn phase. Unfortunately, as mentioned above, this leads to an increase in NOx generation which brings about the NOx/PM
tradeoff in diesel engines. It is difficult to decrease the generation of one without impacting the other. There are several system options in place to reduce diesel emissions which will be discussed later. [3]
There are significant human health hazards associated with diesel exhaust emissions that
necessitate reductions in emissions. Longer term exposure to the contaminants in diesel exhaust can lead to the development of lung cancer. Even short term exposure to the fine particles lead to eye, nose, throat, and lung irritation. It can also cause coughs, headaches, and nausea. These emissions also can cause the development and aggravation of chronic respiratory symptoms or asthma. The formation and release of NOx is also a primary constituent of acid rain. [4]
As a result of PM and NOx generation as well as CO and HC and all of their associated health
effects, there are regulations in place limiting the amount of each emission type that can be created. Over time, these restrictions have become increasingly more stringent, signaling a need for increased public safety as well as motivation for engineering improvement.
19
Figure 1.1: EPA NOx and PM Standards Over Time
As shown in Figure 1.1, there has been order of magnitude reductions in allowable PM and NOx
emissions over the past two decades requiring new systems and methods for emission reductions. [6]
1.2.1. Emission Reduction Methods
There are several different types of diesel emission reduction systems that have been
implemented in order to keep up with the increasingly stringent emission standards. The first involves changes in engine configuration, operating conditions, and control strategy. These typically result in either running in inefficient modes to reduce emissions and causing a fuel economy penalty or still run into the standard PM/NOx tradeoff. Other methods of reducing
engine emissions are achieved through the use of aftertreatment systems. These are systems downstream of the engine with the purpose of either treating or removing the emissions so they are not harmful upon release. Because HC and CO emissions are comparatively low in a diesel engine, the main focus is the reduction of NOx and PM.
One method of treating NOx emissions is through the use of a selective catalytic reduction (SCR)
20
nitrogen compounds such as ammonia or urea in the presence of typically platinum catalysts. Through several chemical processes, the NOx compounds are converted with the nitrogen compounds into nitrogen gas and water. The benefit is that the NOx is removed from the exhaust
stream however the nitrogen compound is consumed in the process. This requires both an expensive aftertreatment system as well as an ammonia or urea tank that needs to be refilled. Another system that is used is a lean NOx trap which is a porous material called zeolite that
absorbs NOx. The zeolite can absorb a finite amount of these emissions before it must be treated which also creates an expensive and repetitive process. [7]
The primary method of controlling PM emissions is through the use of a DPF. As briefly mentioned, this is a porous ceramic honeycomb filter that traps particulate emissions while allowing gaseous exhaust to escape through the filter. This method is highly effective since it has filtration efficiencies of up to 99%. However, as more PM is captured within the filter, the restriction to exhaust flow increases which increases the backpressure on the engine and reduces fuel economy. To clear out the buildup of carbon soot, the filter is periodically regenerated at high temperature to burn off the soot into CO2. While the soot is removed, a small amount of
metallic ash particles derived from the lubricant additives remain in the filter. Over the life of the filter and after many regeneration cycles, the impact of this metallic ash becomes significant. There has been a large effort to understand the many effects that this ash has on filter
performance as well as how to mitigate these effects. The next section will investigate some of the current knowledge while the main body of this work will seek to further understand these mechanisms.
21
22
2.
DIESEL PARTICULATE FILTERS
The primary method used for soot capture and oxidation in order to meet PM emission
regulations is the DPF. Commercial DPFs were first used in in 1985 on Mercedes cars equipped with a 3.0 L turbocharged IDI engine sold in California. After initial technical issues plagued the use of the DPF, continuing development and stringent particle emission reduction requirements of 80 – 90% promoted widespread adoption of the DPF. This includes both on and off highway as well as light and heavy duty vehicles. As a relatively simple system to implement, the DPF has also has been used as a retro fit solution on many vehicles. [8]
2.1.
DPF Fundamentals
As a result of years of development iterations, the most common type of DPF is a ceramic, honeycomb, wall flow monolith filter due to its cost and high filtration efficiency. The
honeycomb structure is made of an extruded porous ceramic with flow channels open at the inlet and outlet. A wall flow filter is one where every other inlet channel is plugged and the opposite outlet channels are plugged. This geometry forces the exhaust gasses to filter through the porous channel walls down the length of the filter where particles can be trapped. An example of this structure is shown below in Figure 2.1.
23
As a result, the porous structure is the critical filtration medium and is a tightly controlled part of the manufacturing process. As PM starts to build up in the pores and ultimately on top of the channel wall surface, the filtration efficiency increases due to it acting as an additional filter medium. This results in filtration efficiencies up to 99%. [9] However, this accumulation increases the flow restriction within the pores of the filter and increases the thickness of the porous medium that it must flow through. This increase in back pressure results in a decrease in fuel economy. [10] The PM that is trapped in the filter is a combination of mostly carbonaceous soot and a small amount of metallic ash derived from lubricant additives. The soot comprises about 99% of the PM matter by mass. [11] To reduce back pressure and reopen space in the filter to capture PM, the combustible PM is oxidized at elevated temperatures of 150 – 650⁰C
depending on the chemistry and presence of catalysts. This oxidation, called filter regeneration, either happens periodically or continuously depending on the operating conditions and method of regeneration. Typically, regeneration requires fuel to create the additional heat which is another fuel penalty for the DPF.
Due to the short life span and relative uniformity of the soot within the filter compared with the ash particles, the properties and effects of soot accumulation are fairly well understood. Over a wide range of engine operating conditions, the soot layer porosity remains around 90% with a permeability around 2 x 10-14 m2. [12] The lubricant derived ash, made of a variety of
chemistries and remaining in the filter until physically cleaned, have varied properties and effects on the filter which will be discussed further.
2.2.
Lubricant Derived Ash
While lubricant derived ash only accounts for 1% of the engine out PM, its continued existence after regeneration cycles means that it can have an increasing effect on filter performance relative to soot. As early as 30,000 miles or the equivalent engine run hours, 50% of the filter PM can consist of ash particles. [13] The ash portion of filter PM over the life of the filter is shown below in Figure 2.2: Portion of Filter PM Consisting of Ash Over Filter LifeFigure 2.2.
24
Figure 2.2: Portion of Filter PM Consisting of Ash Over Filter Life
As ash is deposited in the filter, it builds as both a cake layer on top of the channel walls and as a plug at the end of the channel. This is seen below in Figure 2.3. As soot is continually
regenerated, the ash cake layer becomes the new filtration medium and the soot layer builds on top of the ash. The following sections will discuss the sources of this ash and the different types of chemistries. It will also discuss the performance effect of the ash on the DPF over the life of the filter and as a result of ash chemistry.
25
2.2.1. Ash Sources and Chemistries
As stated, the deposition of ash particles within the filter can be detrimental to both the filter performance as well as the operating life of the filter. Over time, the presence of ash requires a cleaning of the filter to remove the volume of ash and reduce pressure drop. A filter can only be successfully cleaned a small number of times before the DPF must be replaced. This process is both time consuming and expensive for the filter owners motivating methods for decreased ash impact on the filters. The accumulated ash is derived from a number of sources including engine wear particles and metals found in the fuel. The primary source of ash comes from the engine oil. During operation, a small amount of engine oil lining the cylinder walls is combusted with the fuel air mixture. The organic components are oxidized either in the cylinder or further
downstream but the metallic compounds from the additives are left as ash particles. A typical diesel engine oil consists of 75-83% organic base oil, 5-8% viscosity modifier, and 12-18% lubricant additives from which the ash is derived. The inorganic portion that generates the ash constitutes 1% of the oil. [14] The base oil acts as the primary lubricating ingredient due to its beneficial lubrication qualities such as viscosity, viscosity index, pour point, and oxidation resistance. [15] The oil is also the carrier for the lubricant additives which are used improve the performance and lifetime of the oil. These additives are also the primary source of metallic ash particles in the DPF. The main types of additives used are detergents, dispersants, and Zinc Dialkyldithiophosphates (ZDDP).
Detergents are used as lubricant additives to work as a corrosion inhibitor. Detergents contain metal salts and an organic component, typically calcium and magnesium, combined with a base, usually carbonate. The basic components of the detergents act to neutralize the acidic
components of combustion/oxidation byproducts. After neutralization, the organic portion of the detergent suspends the byproducts within the lubricant. These two acts of neutralizing acidic components and suspension of byproducts help to reduce engine rust and corrosion as well as particle buildup. The metal components are the primary constituents of ash PM in both sulfate and oxide form after combustion. There is a tradeoff between limited use of detergents to decrease ash generation while requiring them to limit engine corrosion. [15]
26
The second set of additives in diesel lubrication is the dispersants. These act in a similar manner as the secondary effect of detergents in that they are added to suspend insoluble wear and corrosion particles within the lubricant to prevent particle buildup. While the detergents have some small dispersant properties, dedicated dispersants are required to adequately keep the engine components clean. Another important difference between the two is that the dispersants do not contain any metal elements which means that they do not contribute to the ash formation of concern.
The final additive group is ZDDP which has been used in many types of lubricants primarily as a low cost anti-wear agent. When small surface imperfections on lubricated sliding surfaces
penetrate the lubrication film creating higher temperature metal-to-metal contact, the ZDDP acts to reduce the contact to prevent wear or surface welding. ZDDP is composed of sulfur,
phosphorous, and zinc which are all undesirable emissions components. The presence of zinc also contributes to the formation of ash particles within the DPF. While magnesium and calcium compounds make up the large majority of ash constituents, the presence of even a small amount of zinc can have important impacts on ash properties due to its different morphology and lower melting temperature. [16]
2.3.
Ash Effects on DPF Performance
There has been a large effort to understand the effect of lubricant ash on DPF performance and flow restriction. While the general effects are fairly well understood, the many mechanisms and variables by which this deposition and restriction occur are yet to be characterized accurately.
Figure 2.4 shows an example of a typical pressure drop curve of a cordierite DPF across the lifetime of the filter before being cleaned. There are three main regimes of ash deposition that are apparent in the pressure drop curve shown with corresponding renderings to demonstrate the location of ash in each regime. The first critical regime is the deep bed filtration regime. This occurs within the first ~5 g/L of ash where early ash particles are deposited within the pores of the filter. These ash particles begin to block critical flow pathways and cause a sharp increase in pressure drop. This is a particularly important regime because only a few percent of the ash that
27
will accumulate in the filter over time can account for up to 50% of the total ash loaded pressure drop. The deposition of these first ash particles set the baseline by which the rest of the pressure drop builds off of. This means that there is an opportunity to reduce the pressure drop over the life of the filter through potential control of the deposition in the earliest portion of the filter life.
After the surface pores have been mostly filled in the deep bed filtration regime, the transition regime begins. This is when the initial steep slope starts to round off and flatten out as new particles are no longer being deposited into the filter but instead start to stack onto previously deposited ash particles. Under continued loading, the filter transitions to the final stage which is the ash cake layer regime. In this regime, new particles never reach the filter material and only stack up in a cake layer of increasing thickness. The ash cake layer effectively becomes the new filtration material. The pressure drop increases slowly as a result of the increased thickness of the ash cake layer which provides new flow restriction. Ash in this regime also gets pushed to the end of the inlet channels and starts to build up as an ash plug. As this plug increases in length towards the front of the filter, there is a decrease in available filter area for exhaust gasses to pass through. This decrease in filter area in conjunction with the building cake layer leads to the increased slope halfway through the cake layer regime. [4]
28
While Figure 2.4 demonstrates just the ash effect on filter performance, the existence of ash has an important effect on filter response to soot loading. As shown in Figure 2.5, with no ash in the filter, the response to soot loading follows a similar trend to the filter response to ash loading. There is a clear steep increase under a small amount of soot load followed by a longer linear increase in pressure drop. The two main differences are that the transition point happens at a very low amount of soot load of under 0.5 g/L and that the magnitude of pressure drop increase is up to six times higher for the same loaded mass of PM. This is due to the smaller particle size of ash that allows for better penetration into the pores of the filter as well as the lower permeability of soot cake layer compared to ash cake layer. [17]
Figure 2.5: Effect of Ash Loading on Soot Loaded Pressure Drop Increase in [17] Once an ash cake layer has built up in the filter, the net pressure drop increase due to the 12.5 g/L of ash and the soot related pressure drop is actually lower than with the soot by itself. This is a result of the small, more permeable ash cake layer acts as the filter substrate for the soot
particles preventing the deep bed regime of soot loading from occurring. Instead, the effect of the deep bed regime of the ash is much lower than that of the soot which makes the net effect more beneficial. This only lasts to an extent as can be seen by the 33 g/L ash loading which has a higher pressure drop than all instances of the no-ash soot loading cycle. In this case, the total effect of the deep bed regime and thick cake layer of the ash is larger than the effect of the deep
29
bed filtration of the soot that is prevented. This demonstrates another instance in which the deep bed filtration regime is an important section of the filter life to control to decrease the effect of soot loading on pressure drop. The high ash loaded cases also show a similar increase in the slope of pressure drop with additional loading due to the reduction in filter flow area from the increase in plug length.
2.3.1. Lubricant Additive Chemistry Effects
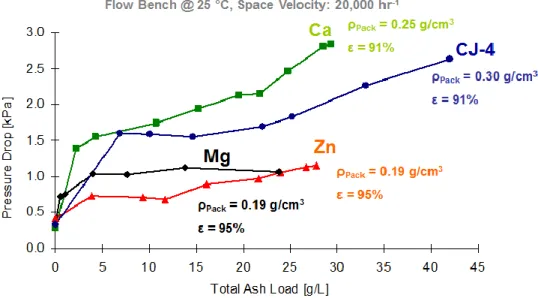
Several additional ash loading experiments were done in [4] using a number of single additive lubricant formulations to determine the effect of ash chemistry on filter performance. The results of this study are shown below in Figure 2.6. Each type of ash exhibits pressure drop trends following the same types of regimes as talked about previously. The different additive types show a range of effects in each regime. In the initial deep bed filtration regime, the calcium and magnesium ash loaded filters have the highest initial pressure drop rise. The magnesium filter changes to the transition regime much earlier for an initial cake layer regime with almost half of the pressure drop. From there, the magnesium loaded filter has an extremely flat pressure drop trend implying a very high permeability cake layer. The calcium loaded filter, on the other hand has the highest cake layer slope of any of the filters. The zinc loaded filter has the smallest difference between the deep bed and cake layer regimes. The CJ-4 ash loaded filter, which contains components of each individual type of ash, is in the middle of the spectrum for both regimes. This also seems to show the additive effects of each of the different types of ash chemistries.
At the end of the ash loading process, several ash layer properties were measured including packing density and porosity. Each ash type had an extremely high porosity around 90%
showing how loosely packed and porous the ash particles are. The packing density variation was slightly higher between 0.19 – 0.30 g/cm3. The presence of calcium ash appears to drive up the packing density of the ash. One limitation of this type of analysis is that the ash properties can only be measured in a post mortem analysis after the final loading point. This removes the possibility of additional loading and only provides one data point for ash properties as a function of ash load and run time.
30
Figure 2.6: Pressure Drop Trends of Several DPFs Loaded with Single Additive Ash Chemistries
During the post mortem analysis, many other properties of the ash particles can be determined through the use of advanced diagnostics. Using a transmission electron microscope (TEM), the morphology of the ash can be found providing insights into the variation of measured pressure drop.
31
As can be seen in Figure 2.7, there are distinct differences in the morphology for each type of ash. The calcium ash consists of small spherical particles around 100 nm in diameter. These particles appear tightly bound together which is consistent with the higher packing density and higher pressure drop. Tightly bound particles are less likely to be moved by the exhaust gasses and only provide small openings for flow which could drive up the pressure drop as seen above. The magnesium ash consists of large, loosely bound spherical particles. The large particles allow for much larger, more permeable flow pathways which are consistent with the lower cake layer pressure drop and a faster deep bed regime. The zinc particles are the most distinct looking particles of the group with a defined, branch-like structure. The lower melting temperature and greater surface area of the particles make the zinc ash more susceptible to partial melting and sintering during local high temperature events from soot oxidation. The CJ-4 ash particles appear to have some combined features of each of the other types of ash which is also consistent with its relative pressure drop trends. Large spherical magnesium components and smaller more
branched zinc components are also apparent.
In addition to the other ash properties such as packing density and porosity, it is important to understand the permeability or flow restriction of ash as well as the effect of lubricant additive type and morphology on it. Due to the relative difficulty of measuring permeability from a small ash sample compared to density or porosity, efforts were made by Yujun Wang in [19] to
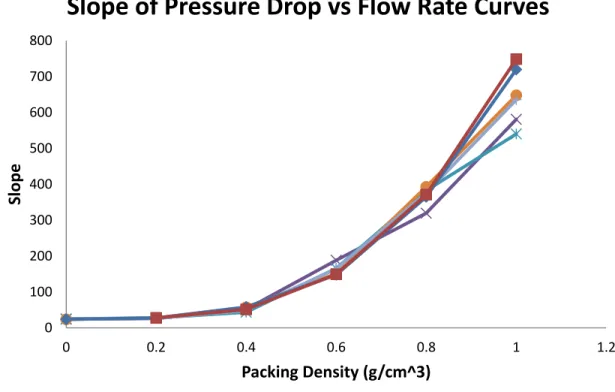
estimate both the ash cake layer permeability and composite wall and deep bed ash permeability from the pressure drop trends above. This is done by separating the pressure drop curve into two component slopes with the slope of the deep bed filtration regime representing the composite wall permeability and the cake layer slope representing the ash permeability. The components of pressure drop not directly from flow through a porous medium is calculated and removed. What is left is used in the Darcy equation to calculate permeability. The results are shown below in Table 2.1.
32
Table 2.1: Results of Permeability Estimations in [19]
Ash Permeability Wall Permeability
Lubricant (m2) (m2) Ca 1.67 x 10⁻¹⁴ 4.56 x 10⁻¹⁴ Zn 8.56 x 10⁻¹⁴ 10.5 x 10⁻¹⁴ Mg 57.4 x 10⁻¹⁴ 5.82 x 10⁻¹⁴ Ca + Zn 4.46 x 10⁻¹⁴ 3.75 x 10⁻¹⁴ MG + Zn 4.80 x 10⁻¹⁴ 9.35 x 10⁻¹⁴ CJ-4 11.1 x 10⁻¹⁴ 4.98 x 10⁻¹⁴
The values of ash permeability shown above span over an order of magnitude and are within a similar range of other previous permeability measurements. There are significant limitations with this method due to the low resolution of pressure drop data with respect to ash loading and the need to remove multiple components of pressure drop contribution to be left with the pressure drop due to the permeable material. The properties of the ash used in the calculation only represent one moment across the life of the filter. A large focus of this work is to develop
additional, more accurate methods to measure and calculate permeability in order to use this key parameter as a method to determine the effectiveness of other ash parameters in reducing
33
34
3.
EXPERIMENTAL SETUP AND APPROACH
As a result of the detrimental impact on DPF performance of the lubricant derived ash particles, there is significant value in understanding both the deposition mechanisms of the ash into the filter as well as the corresponding flow properties. In order to better understand these effects and properties, a number of experiments are designed.
3.1.
Compressed Ash Permeability Experiment
Previous experiments have shown the large scale DPF performance decrease as a result of ash accumulation but there is difficulty in separating properties such as ash packing density, lubricant additive type, and DPF geometry and understanding how each contributes to system pressure drop. Additionally, the many drivers of the pressure drop make it difficult to measure individual permeability of the materials present. The goal of this experiment is to remove both the ash and filter material from the large honeycomb structure of the DPF and set up a 1D flow regime so that the permeability can be measured accurately.
An accurate permeability measurement over a range of ash chemistries and packing density allows for significant improvements in modelling accuracy and justifications for new additive formulations to reduce pressure drop.
3.1.1. Experiment Design
As mentioned in Section 2.3, there are two main regimes where the addition of ash and soot particles to the filter can increase pressure drop. In the deep bed filtration regime, the ash particles are embedded within the porous flow network of the DPF and block critical flow pathways. This results in the sharp pressure drop increase with a relatively low amount of ash that is seen repeatedly. The second regime is the ash cake layer regime where the ash builds up in a somewhat uniform cake layer that replaces the porous ceramic as the primary filter substrate for the soot particles. The additional pressure drop increase is due to the permeability of the ash cake layer and the geometry of the cake layer as it grows. While the cake layer growth is well
35
understood, there is significant interest in measuring the permeability with high accuracy so as to improve modeling and see what variables impact cake layer permeability.
For a DPF in field use, there are several major components that result in the total system pressure drop. They are shown in Table 3.1.
Table 3.1: Contributions to DPF Pressure Drop
Pressure Drop Term % Contribution
Contraction Losses (Inlet) <3%
Frictional Losses Along Inlet Channel Walls 5-30%
Frictional Losses Through Wall, Ash, and Soot 50-90%
Frictional Losses Along Outer Channel Walls ~5%
Expansion Losses (Outlet) <3%
As much as half of the total pressure drop can be a result of the geometry of the exhaust ducting and filter geometry. In order to calculate an accurate permeability for the ash cake layer, the pressure drop contributions due to contraction losses, expansion losses, and frictional losses along the channel walls need to be removed by the system design and is achieved through the use of a cordierite wafer.
As mentioned in Section 2.3.1, the permeability calculations from the full DPF pressure drop data attempt to account for each of these pressure drop contributions. However, the density of the ash cake layer is taken to be constant and is only measured at the final loading level. This
assumption does not take into consideration the variation of ash cake layer density over time due to changes in temperature, flow rate, or high temperature events. It also does not consider the local variation of packing density within the filter. To overcome this, the ash tested in this experiment is packed across a range of typical packing densities found within a DPF.
3.1.2. System Design
Based on the goals and requirements listed above, a flow bench system is designed to measure the pressure drop across the porous medium so that permeability can be accurately calculated. The flow bench schematic is shown in Figure 3.1.
36
Figure 3.1: Schematic of Flow Bench
This simple system allows for accurate air flow control and pressure measurement in a sealed system while requiring a special holder for the wafer and ash. The system is designed to be mounted in a vertical orientation so loose ash is not disturbed by gravity or falls to one side of the flow. The density is then controlled by measuring a precise mass of ash and compressing it to a constant volume using a specially designed packing tool and using the known diameter of the tube. This idea is demonstrated in Figure 3.2.
37
This process of controlling the packing density through a controlled volume allows for a density accuracy of ±0.005 g/cm3.
To accurately represent the flow conditions in a DPF in field use, the wall velocity through the wafer must be equal to the average wall velocity through the channel walls of the DPF. Space velocity (SV) is a term used to describe the normalized volume flow rate through a given volume of filter. The equation is described below.
𝑆𝑝𝑎𝑐𝑒 𝑉𝑒𝑙𝑜𝑐𝑖𝑡𝑦 =𝑉𝑜𝑙𝑢𝑚𝑒 𝐹𝑙𝑜𝑤 𝑅𝑎𝑡𝑒 𝐹𝑖𝑙𝑡𝑒𝑟 𝑉𝑜𝑙𝑢𝑚𝑒
A typical range of space velocities in field use is from 0 – 100,000 1/hr. This encompasses conditions varying from idle to wide open throttle. Since a wafer is only defined by its wall velocity and not a space velocity, the space velocity must be converted. For the typical range of space velocities in a filter, the range of line velocities through the channel walls is calculated. The manufacturer’s specifications for a cylindrical DPF provide the diameter (D), length (l), wall thickness (t), and cells per unit area on the front face (CPA). The number of cells is typically provided in cells per square inch (CPSI).They also provide the length of the plug section on the inlet and outlet channels (lp). Using these specifications, the equation for number of channels is
shown below (Nc).
𝑁𝑐 = 𝜋𝐷2
4 ∗ 𝐶𝑃𝑆𝐼
For a typical 5.66” x 6”, 300 CPSI filter, this equates to about 5030 total channels including both inlet and outlet channels. To avoid double counting walls, only the inlet channels or half of all channels contribute to flow surface. Next, the surface area for each channel (Ac) needs to be
found. This is shown below.
𝐴𝑐 = 2 ∗ (
1
38
Multiplying by the number of channels, the total flow area of a typical filter is about 4.5 m2. Using the outer dimensions of the filter, a typical filter volume is 2.47 L. With the space velocity, filter volume (V), and total wall area (A), the wall velocity (Vw) can be found. This is
shown in the equation below.
𝑉𝑤 =
𝑆𝑉 ∗ 𝑉 𝐴
Using this conversion from space velocity to wall velocity, an approximate wall velocity range is from 0 to 3.5 cm/s. This is the critical value to match between filter sizes when choosing a volume flow rate for the wafer sample. Next, the diameter of the tube for the flow bench needs to be chosen. There is a relatively small amount of each type of ash available from the previously loaded lab filters. In order to ensure enough ash is available to provide an adequately thick cake layer, a tube diameter of 0.62” is chosen. Using this diameter, a test range of volume flow rate from 0 to 400 standard cubic centimeters per minute (SCCM) is found. An Omega mass flow controller, FMA-2620A, is chosen to accurately control the flow rate through the system.
A specialized wafer holder is designed in order to hold the brittle ceramic wafer without breaking. It is also required to prevent air from escaping the system for accurate pressure measurements and to retain the ash cake layer. The design for the holder is shown in Figure 3.3.
39
The wafer holder as shown uses a wafer cut from a full, 200 CPSI, uncoated DPF with a wall thickness of 450 μm. A two channel, three wall thickness was chosen for its additional structural support to avoid fracture of the cordierite. The two flanges are bolted together with a gasket to prevent leaks. The wafer is held between two compliant O-rings in the flange to direct all flow through the wafer material instead of around. To prevent the air from flowing out the channels on the sides and to provide more structural support where the wafer will be stressed from the O-rings, the channel openings are covered with an epoxy. A prepared wafer sample and one with the ash cake layer are shown below in Figure 3.4.
Figure 3.4: The Stages of Wafer Sample Preparation and Loading
As seen above, a small wafer section is cut roughly from a section of DPF and sanded to the correct size. Using increasingly fine grit sandpaper, the wafer section is brought to 0.75” diameter and the perpendicular channel walls are ground flat for a smooth flow surface. The epoxy is then applied to the outer channel openings and is allowed to dry. After drying, the epoxy is then also sanded to the correct diameter to fit within the wafer holder. With the wafer assembled in the wafer holder and the flow bench assembled, the pressure drop experiments can be run.
3.1.3. Test Matrix and Procedure
As mentioned, the test setup is used to measure the pressure drop over an ash cake layer that is held up by a cordierite wafer. The two main variables being tested are the lubricant additive chemistry or the chemical makeup of the ash and the controlled packing density of the ash cake layer. The test matrix is shown in Table 3.2.
40
Table 3.2: Test Matrix for Ash Cake Layer Permeability Experiment
Ash Sample Type Volume Flow Rate (SCCM)
Equivalent Space Velocities (1/hr)
Packing Density (g/cm3)
Field Ash Active 0 - 400 0 - 100,000 0.15 - 0.75
Field Ash w/ Soot 0 - 400 0 - 100,000 0.15 - 0.75
CJ4 Active 0 - 400 0 - 100,000 0.15 - 0.75 CJ4 Passive 0 - 400 0 - 100,000 0.15 - 0.75 Base + Ca 0 - 400 0 - 100,000 0.15 - 0.75 Base + Zn/Mg 0 - 400 0 - 100,000 0.15 - 0.75 Base + Mg 0 - 400 0 - 100,000 0.15 - 0.75 Base + Zn 0 - 400 0 - 100,000 0.15 - 0.75
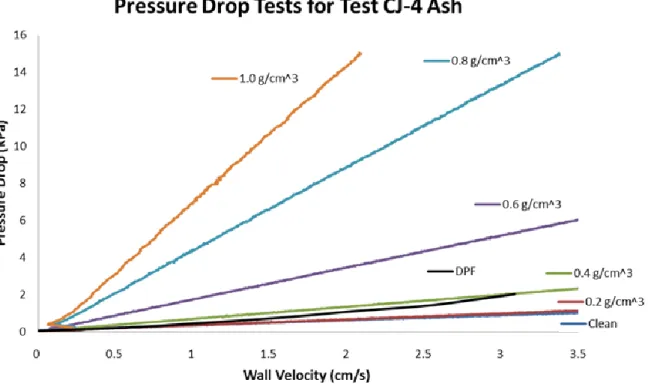
Typical packing densities of ash cake layers found in lab and field samples are in the range of values of 0.25 to 0.6 g/cm3 with it going as high as 1 g/cm3 for highly sintered agglomerates. This experiment is primarily concerned with ash particles packed into a cake rather than a fully sintered region. For that reason, a range of packing densities of 0.15 - 0.75 g/cm3 is chosen to understand the full range of typical values and to see the trends near the extremes of typical packing densities.
The ash samples used in this experiment are derived from both lab and field generated samples. The field ash samples are from CJ4 oils in highway use that contain 1% ash by mass. The field ash came with a small amount of soot which is oxidized to create the pure ash field sample. The lab generated samples are all derived from the loading experiments described in [5]. The additive contents of the oils used in lab filter loading are described below.
Table 3.3: Lubricant Elemental Composition Used in the Experiments Described in [5]
Lubricant B (ppm) Ca (ppm) Fe (ppm) Mg (ppm) P (ppm) Zn (ppm) S (ppm) Mo (ppm) CJ-4 586 1388 2 355 985 1226 3200 77 Base Oil + Ca 3 2928 1 5 2 <1 609 <1 Base Oil + ZDDP 1 <1 <1 <1 2530 2612 6901 <1
41
Experimental Procedure
Once the clean wafer is mounted into the holder and assembled in the flow bench, the flow rate is swept from 0 to 400 SSCM at a rate of 100 SCCM/min while the pressure is measured. This allows for the calculation of the wafer permeability as well as the normalization to find the pressure drop increase strictly due to the addition of the ash cake layer. Next, the sample section is removed and a precise mass of ash is added to the wafer giving an expected packing density of 0.15 g/cm3. The ash is then moved around until it is approximately evenly distributed to avoid regions of varying density but overall nominal packing density. A specially made piston with a slip fit with the tube is used to compact the ash to the correct volume. The piston has a seat matching with the top of the tube to prevent additional, unwanted travel. With the ash loaded, the holder is reattached to the flow bench where the flow sweep and pressure measurement
procedures are repeated.
For all additional ash loading steps, the preceding ash cake layer is loosened and disturbed before adding the new ash to prevent stratification of the cake layer of different properties and to also to prevent localized density variation. The new mass of ash is then added to increase the packing density to the next step. The ash is then mixed until approximately evenly distributed and packed again. This procedure is repeated for each value of packing density and the full test matrix.
3.2.
Initial Pore Build-up and Lubricant Chemistry Experiment
As seen in Section 2.3, the general long term effect of ash buildup on a DPF is fairly well understood. While the previous experiment described the need for a better understanding of ash cake layer properties in the later regime of ash loading, there is also much interest in
understanding the initial deep bed filtration regime. Both regimes account for roughly half of the total pressure drop of the DPF and as such are both critical pieces. The deep bed filtration regime also takes place within the first 5 g/L of loading which means that a very small amount of ash has a significant impact on pressure drop.
Previous experiments only capture a very low resolution and small portion of the deep bed filtration regime with one to two pressure drop points. This prevents an accurate measurement of
42
the slope and shape of the pressure drop trend at low ash loading. The tolerance for ash loading measurement is also as high as 2 g/L which means that previous data does not fully represent this important phenomenon or the specific trends. One of the goals for this experiment is to develop the methods to measure with much higher accuracy the amount of ash loading within the filter even at low levels. This allows for a much higher resolution of pressure drop with respect to ash loading. Additionally, the chemistry of the lubricant additives has shown to have a significant impact on both the morphology of the ash being deposited as well as its ultimate pressure drop. This experiment will also investigate the differences in initial ash buildup from different lubricant additive types.
3.2.1. System Design and Setup
As mentioned, the goal for this experiment is to understand the effects of lubricant additive chemistry on overall DPF pressure drop with high resolution in the deep bed filtration regime. To gather this type of data in a field setting or in a lab with an engine used for the ash loading of the filter, this would take approximately 600 hours or 20,000 miles of equivalent highway usage per filter. Additional time would also be required for regeneration, pressure drop testing, and other analysis. Because this is a significant amount of time, especially for any loading past the deep bed filtration regime, an accelerated ash loading system is used to generate ash particles in conjunction with a Yanmar diesel engine to provide soot. This system has been used repeatedly for the rapid aging of DPFs and has been shown to repeatably generate and deposit ash and soot particles in the DPF.
The system used at MIT is a very versatile system since the primary exhaust gases are generated by a diesel burner rather than an engine. This allows for much greater control over fuel injection rates and flow rates since it is not RPM limited. In addition, the large downstream counterflow heat exchanger allows for wide temperature control from 200 ⁰C through regeneration
temperatures as high as 700 ⁰C. The ash producing oil is atomized and injected into the combustion chamber where it is burned and enters the exhaust stream. This independent oil injection system is the key component in accelerated ash loading because the injection rate is independently controlled. This method of injecting oil also generates more representative ash
43
compared to doping the fuel with additional oil because it allows for a burn in an air rich region and because the atomized oil has less of a tendency to bind together in an incombustible mass of metallic compounds. A schematic of the accelerated ash loading system is shown below in Figure 3.5.
Figure 3.5: MIT Accelerated Ash Loading System Schematic
As see in the above schematic, air is drawn through the system from a large centrifugal vacuum pump at the end of the system. The flow rate is measured at the inlet to the system before passing through the burner where it is mixed with diesel fuel and combusted to create the exhaust gases. The oil is then atomized and injected with a small amount of air to facilitate combustion and ash particulate generation. The system temperature is then regulated through the heat exchanger and gate valve before passing through the DPF. Inlet and outlet temperature and pressure are
measured across the DPF to ensure the correct operating conditions and measure filter performance as a function of loading. Before the pump, a secondary inlet valve allows for ambient air to be pulled in to the system to reduce the exhaust temperature to below the
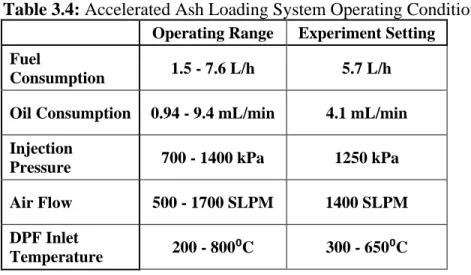
acceptable level for the pump. The exhaust gases are then passed into an exhaust trench where it is removed. The burner operating conditions are shown in Table 3.4.
44
Table 3.4: Accelerated Ash Loading System Operating Conditions
Operating Range Experiment Setting
Fuel
Consumption 1.5 - 7.6 L/h 5.7 L/h
Oil Consumption 0.94 - 9.4 mL/min 4.1 mL/min Injection
Pressure 700 - 1400 kPa 1250 kPa
Air Flow 500 - 1700 SLPM 1400 SLPM
DPF Inlet
Temperature 200 - 800⁰C 300 - 650⁰C
In addition to the diesel burner and oil injector, a small diesel generator is connected just downstream of the heat exchanger. Because the diesel burner uses a constant flow fuel nozzle and constant speed internal pump, the fuel burns at a fairly constant AFR with only a small amount of soot. The diesel generator is used to generate much larger amounts of soot in a
controlled manner. The inlet from the burner is closed off and the diesel engine is run to generate a large amount of soot for when soot loading is necessary. Soot loading is typically used on new filters to characterize initial filter performance or to look at the effects of high soot loading on a filter with an ash layer already generated from the accelerated aging system. The specs of the diesel engine are shown in Table 3.5.
Table 3.5: Specifications of Diesel Engine for Soot Loading
Model Yanmar L100V Displacement 0.435 L Output 5000 W @ 3600 RPM Soot Generation Rate 2.5 g/hr Air Flow 1050 SLPM DPF Inlet Temperature 260⁰C
45
One of the major necessary changes from the previous system for this experiment is the method of holding and weighing the DPF for accurate measurement of mass and ash loading. Prior experiments encased the DPF in an insulated stainless steel clamshell can with expanding and reducing cones on the ends to connect to the three inch diameter pipe system. This was used for creating a tight seal, providing significant insulation of the DPF from the ambient air, and to allow for clamped connections to the larger system. However, this system weighs about 10 kg which requires the use of a larger scale with 0.2 g resolution. The filter itself only weighs 1.2 kg which can fit on a lower mass, higher resolution scale. While the filter can technically be
removed, it would require significant disassembly and reassembly time as well as a repetition of the expansion process for the insulation.
A new filter holder is designed to allow for the easy removal of the DPF for mass measurement on a 0.01 g resolution scale with a maximum allowable mass of 2 kg. The new filter must also prevent air leakage and provide insulation to keep temperature variation within the filter to below 50⁰C. The proposed design consists of clamping the inlet and outlet faces of the DPF between inlet and outlet connecting cones with threaded rods. The cones have a sealing surface with a gasket in contact with the outer ring of the DPF to prevent leakage. The design is presented in Figure 3.6.
46
The sets of threaded rods are tightened to provide the seal between the DPF faces, gaskets, and flange surfaces. Two sets of gaskets are used for different portions of the experimental process. For all high temperature conditions, stiff high temperature graphite gaskets are used to prevent melting or degradation. During room temperature flow and pressure drop tests, a more compliant rubber gasket is used to provide a better seal during the critical pressure measurements.
As currently shown, the filter does not have adequate insulation and can have radial temperature variation of up to 100⁰C. A flexible casing with high temperature insulation is placed over the outside of the holder with a quick clamp for easy removal. With the additional casing, the radial temperature variation remains below 50⁰C.
Under the new design, the filter is rigidly mounted to the rest of the system and is susceptible to damage from vibrations in the system, particularly from the engine. As a result, additional vibration isolation components including damping engine mounts and softer flexible pipe between the engine and larger system are added. These prevent the filter from seeing any significant vibrational loads and prevent the brittle cordierite from cracking.
3.2.2. Test Plan
Using the accelerated ash loading system and filter holder described in section 3.2.2, a test plan is developed to repeatably measure the effects of deep bed filtration of ash on filter performance. As mentioned in section 2.3.1, there are significant differences in both the ash morphology and impact on system pressure drop as a result of various lubricant additive chemistries. The most notable is the stark contrast between the calcium and magnesium single additive lubricants. In order to understand the performance differences at higher resolution and the mechanisms by which they occur, this experiment looks at ash generated from two oils that meet the criteria of a CJ4 oil but are high in either calcium or magnesium content. These satisfy current regulatory requirements but aim to match the characteristics exhibited in the single additive formulations. The basic oil additive formulation is shown in Table 3.6.
47
Table 3.6: Lubricant Additive Formulation for Experimental CJ4 Oils
Lubricant Type Ca [ppm] Mg [ppm] P [ppm]
High Ca 2480 <1 800
High Mg <1 2050 800
Due to the significant time investment required to ash load a filter and measure performance, there is very little data on the repeatability of pressure drop response to ash load taken under identical conditions. Since this experiment focuses on only the early deep bed filtration regime, it is possible to measure the repeatability of the response under low ash load which still can
account for up to 50% of the total response. This is done through the loading of three filters under identical process for each oil formulation for a total of six filters. The specifications of the filters used are shown in Table 3.7.
Table 3.7: Filter Specifications for Ash Loading Experiment
Substrate Cordierite Catalyst Pt Dimensions D5.66” x 6” (D14.4 x 15.2 cm) Cell Density 200 cells/in
2 (31 cells/cm2) Wall Thickness 0.012" (0.03mm) Volume 2.47 L Mass 1.3 kg
The six filters are normalized by initially soot loading and measuring pressure drop to compare performance without loading ash. Each filter is loaded to 6 g/L of soot in 2 g/L increments and pressure drop is measured at each point. Pressure drop is measured by pulling room temperature air through the filter from 0 – 100 SCFM while inlet and outlet pressure are measured. After the clean and soot loaded pressure drops are measured for normalization, the soot is then regenerated so that clean filters are left.

![Figure 2.4: Stages of Ash Deposition in DPF and Effect on Pressure Drop in [4]](https://thumb-eu.123doks.com/thumbv2/123doknet/14265568.489791/27.918.149.765.680.1037/figure-stages-ash-deposition-dpf-effect-pressure-drop.webp)
![Figure 2.5: Effect of Ash Loading on Soot Loaded Pressure Drop Increase in [17]](https://thumb-eu.123doks.com/thumbv2/123doknet/14265568.489791/28.918.190.732.469.738/figure-effect-loading-soot-loaded-pressure-drop-increase.webp)
![Table 3.3: Lubricant Elemental Composition Used in the Experiments Described in [5]](https://thumb-eu.123doks.com/thumbv2/123doknet/14265568.489791/40.918.129.803.119.372/table-lubricant-elemental-composition-used-experiments-described.webp)