Publisher’s version / Version de l'éditeur:
Canadian Journal of Civil Engineering, 19, 1, pp. 59-67, 1992-02
READ THESE TERMS AND CONDITIONS CAREFULLY BEFORE USING THIS WEBSITE. https://nrc-publications.canada.ca/eng/copyright
Vous avez des questions? Nous pouvons vous aider. Pour communiquer directement avec un auteur, consultez la première page de la revue dans laquelle son article a été publié afin de trouver ses coordonnées. Si vous n’arrivez pas à les repérer, communiquez avec nous à [email protected].
Questions? Contact the NRC Publications Archive team at
[email protected]. If you wish to email the authors directly, please see the first page of the publication for their contact information.
NRC Publications Archive
Archives des publications du CNRC
This publication could be one of several versions: author’s original, accepted manuscript or the publisher’s version. / La version de cette publication peut être l’une des suivantes : la version prépublication de l’auteur, la version acceptée du manuscrit ou la version de l’éditeur.
For the publisher’s version, please access the DOI link below./ Pour consulter la version de l’éditeur, utilisez le lien DOI ci-dessous.
https://doi.org/10.1139/l92-006
Access and use of this website and the material on it are subject to the Terms and Conditions set forth at
Snow on two-level flat roofs - measured vs. 1990 NBC loads
Taylor, D. A.
https://publications-cnrc.canada.ca/fra/droits
L’accès à ce site Web et l’utilisation de son contenu sont assujettis aux conditions présentées dans le site LISEZ CES CONDITIONS ATTENTIVEMENT AVANT D’UTILISER CE SITE WEB.
NRC Publications Record / Notice d'Archives des publications de CNRC:
https://nrc-publications.canada.ca/eng/view/object/?id=c029a8a5-0549-4073-9766-a8f0be63897a https://publications-cnrc.canada.ca/fra/voir/objet/?id=c029a8a5-0549-4073-9766-a8f0be63897aSnow on two-level flat roofs -
measured vs. 1990 NBC loads
Taylor, D.A.
NRCC-34022
A version of this document is published in :
Canadian Journal of Civil Engineering, 19, (1), pp. 59-67, February-92, DOI:
10.1139/l92-006
The material in this document is covered by the provisions of the Copyright Act, by Canadian laws, policies, regulations and international agreements. Such provisions serve to identify the information source and, in specific instances, to prohibit reproduction of materials without written permission. For more information visit http://laws.justice.gc.ca/en/showtdm/cs/C-42
Les renseignements dans ce document sont protégés par la Loi sur le droit d’auteur, par les lois, les politiques et les règlements du Canada et des accords internationaux. Ces dispositions permettent d’identifier la source de l’information et, dans certains cas, d’interdire la copie de documents sans permission écrite. Pour obtenir de plus amples renseignements : http://lois.justice.gc.ca/fr/showtdm/cs/C-42
Snow on two-level flat roofs -
measured vs. 1990 NBC loads
DONALD A. TAYLOR
Institute for Research in Construction, National Research Council of Canada, Ottawa, Ont., Canada KJA OR6 Received December 20, 1990
Revised manuscript accepted June 25, 1991
Between 1967 and 1982, depths and specific gravities of snow were recorded on 44 single- and multi-level flat-roofed buildings between Halifax and Edmonton. The average density of snow in the drifts where the roofs change elevation was about 3.0 kN/m', the value used consequently in the 1990 National Building Code of Canada (NBC). This is some 25% higher than the value used in the 1985 NBC. Data on drift geometry and maximum loads in the drifts are presented
and compared with provisions in the 1990 NBC. As well, the paper presents measured values of average and maximum
イッッヲセエッMァイッオョ、@ load ratios for upper level roofs and for lower roofs away from the drifts. These compare favourably
with those recommended in the 1985 and 1990 NBC. The statistical variabilities of snow loads and densities are given,
since these are required to establish load factors used for limit states design in the NBC. Further research needs are
identified.
Key words: snow loads, snow drifts, uniform snow, flat roofs, snow density, snow load variability, snow load survey.
Entre 1967 et 1982, on a mesure Ia hauteur et Ia densite de Ia neige sur 44 biitiments
a
toiture-terrase d'un ou plusieursetages repartis de Halifax
a
Edmonton. La densite morenne de Ia neige dans les accumulations correspondant auxdifferences de hauteur des toits etait d'environ 3.0 kN/m , soit Ia valeur que I' on a utilisee en consequence dans le Code
national du batiment du Canada (CNB) 1990. Cette valeur est de 25'1o superieure
a
celle utilisee dans le CNB 1985.L'auteur presente des donnees concernant Ia geometric des accumulations et les charges maximales qu'on y trouve, les compare avec les dispositions du CNB 1990 et identifie les besoins de recherches plus poussees. 11 prt!sente aussi Jes rapports de charge toit-sol moyens et maximums pour les toits superieurs et inffrieurs en dehors des zones
d'accu-mulation par le vent. Ces valeurs se comparent favorablement
a
celles qui sont recommandees dans les CNB 1985 et1990. La variabilite statistique des charges de neige et des densites y est donnee, car i1 est necessaire de Ia conna:i'tre pour determiner les coefficients de charge utilises dans le CNB pour le calcul des etats limites.
Mots cles : surcharge de neige, rafales de neige, neige uniforme, toitures-terrasses, densite de Ia neige, variabilite des surcharges de neige, etude des surcharges de neige.
Can. J. Civ. Eng. 19, 59-67 (1992)
Introduction
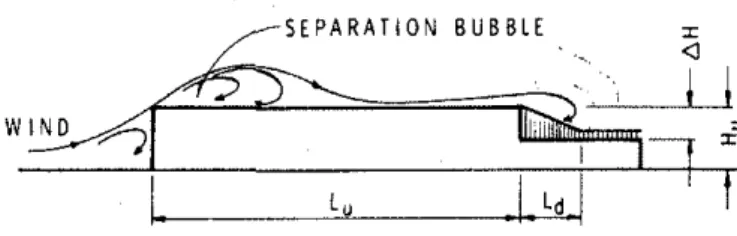
In most parts of Canada, drifting snow results in the deposition of "triangular" snow drifts on two-level flat roofs as shown in Fig. l. These drifts must be properly accounted for in structural design.
セat@ ION
キセセ@
セMMMMMMMMセャセGMMMMMMMMMKセャセ、セ@
59
Building codes and standards such as the National Build-ing Code of Canada (NBC 1990a) and its commentary on snow loads (NBC 1990c), the American Society of Civil Engineers Standard ASCE 7-88 (formerly ANSI A58.1) (ASCE 1988), and the International Standards Organiza-tion's IS0-4355 (ISO 1981) have all had special requirements for such drifts for some time. These code provisions were originally based more on the engineering judgement of members of the code committees than on measurements on roofs. In the last two decades, however, research has been conducted to verify that code provisions are appropriate or, if not, to provide a basis for required changes.
FIG. 1. Wind flow patterns over roof showing separation
bubble.
The 1Oth edition of the National Building Code, the 1990 NBC, contains some important changes to snow load design procedures. The results from a long-term survey are described in this paper and are compared with design pro-visions in the new code and its commentary on snow loads. The new provisions are described first.
The 1990 National Building Code (NBC)
For the Climate Supplement to the 1990 edition of the Code, the Atmospheric Environment Service has recalculated the 30-year return ground snow loads for all
of Canada (Newark 1984; Newark eta/. 1989). Many more
years of measured snow depths at more locations, and also
Primed in Canada 1 lmprimt au Canada
many measured ground snow densities, have been included since the last full reanalysis in 1977. For the first time, the variation of snow density across the country is taken into account directly. Since measured densities include the weight of rain retained in the snow, only the transient rain that drains from the snowpack is not accounted for in the mea-surements. The new ground snow loads are reported, therefore, in two parts: first, the snow component, S,, of
the total load; and second, the rain component, S,
corre-sponding to the 30-year return snow load, S0 • Thus,
[1) S0 = S,
+
S,As before, the maximum load in a drift is equal to the snow density times the depth. For the 1990 NBC, it was proposed that the recommended drift load limit be
[2) 3S,
+
S,rather than
[3) 3(S,
+
S,)=
3S0as was recommended in the 1985 and previous versions of the NBC's commentary on snow loads. Thus, design drift
)
II
!I
60
rセ@
WIND
FIG. 2. Snow drift on roof. In exceptional circumstances a drift which acts as a ramp for ground snow to gain access to the roof
may form on the windward side of the building.
N E
z
OTTAWA SUFFERANCE J Kr\
X ,I \
I\
r \
!I/
I ___\,,
0Qセセ@
Oセ|@
1
1
t\
/
|セ@
'- I /
--o' ol / \!
I ' 0I /
\\
J\
\
\ , , l
||セO@
\
\ I
"\
I\
\j
1 ,'-pwc I\ j.i|セ@
I BETCHERMAN 'b---o---/v
4 0:I
,y Jl 1 I 1 \ / I J I / I " 1---CASHWAY J 1 t I rf I / I rf I I \ I \ / I (I I I I 1 I 'I I 1 I I I I 11 I I I 1 1 1 1\ I 1 I I I I I I I 1 I I / 1 I I I 1 1fl1 I \ I 1 1 I / \ I \ II II 1 : \ / , , , , 0 セᄋ|@ I I I I I I\//
¥'
\j
/:::-\\I
o - - / " ' - l l lj"
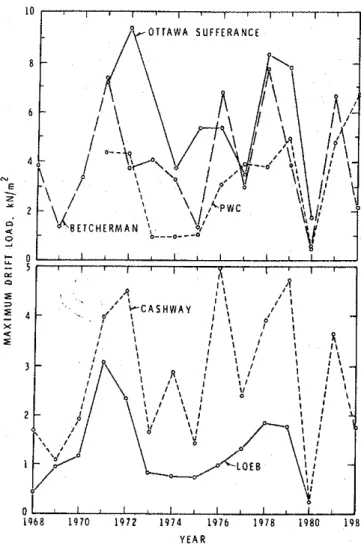
YEARFIG. 3. Variation of the annual maximum drift load on five two-level flat roofs in Ottawa.
loads less than the limiting value of 3S,
+
S, increasecom-pared to the 1985 values because the snow density recom-mended in the 1990 Commentary has increased by 250Jo (as
explained later). For S0 values that remained unchanged
from 1985 to 1990, the limit on maximum drift load
decreased. It remains to be emphasized that Code loads are
minimum design loads; local experience may dictate
increases.
Formation of drifts
When wind encounters a sharp-edged building, a separa-tion bubble forms at the upstream or windward edge of the roof, as shown in Fig. I. Snow that lands in the bubble area, or that was deposited there before the wind started, tends to be carried upstream initially and injected into the flow over the bubble. The flow over the bubble attaches itself
TABLE 1. 1990 NBC ground snow
loads (kPa)
s,
s,
So=Ss+Sr Halifax 1.7 0.5 2.2 Arvida 2.6 0.4 3.0 Ottawa 2.2 0.4 2.6 Saskatoon 1.6 0.1 1.7 Edmonton 1.6 0.1 1.7to the roof surface further downstream (if the roof is long enough) at the "reattachment" zone and snow landing in the region of reattached flow is carried downstream by turbulent diffusion (lsyumov 1971). The snow is finally deposited in the region of the low speed wake, below the upper roof. If, however, the upper roof is short, the separa-tion bubble will be too large for reattachment of the flow, the snow will be dispersed and little will be deposited in a drift on the lower roof. Wind blowing over the low roof towards the high roof may, however, form a drift at the same location on the lower roof. Drifts that form on roofs are shaped and reshaped by winds blowing from many direc· tions during and after storms, although eventually sun, wind, rain, and high temperatures will "set" the surface of the snow, largely preventing further erosion.
Except in unusual circumstances, ground snow does not blow onto a roof in significant quantities. However, if the wind is of sufficient speed and duration to cause a ramp-like drift (Fig. 2) at the upstream wall, snow may travel up the ramp to the roof (Taylor 1979; Templin and Schriever 1982).
Survey of single- and multi-level flat roofs In I 967 the Institute for Research in Construction (formerly Division of Building Research) started a survey of single- and multi-level flat-roofed buildings (industrial, commercial, and school). Buildings at eight locations across Canada were observed, three for only 2 or 3 years; at five locations, observations were conducted for longer periods: Halifax, 13 winters; Arvida (Chicoutimi), 12; Ottawa, 15; Saskatoon, 13; and Edmonton, 11.
Measurements of depths and densities
When the survey started in 1967, snow density was mea· sured by digging a trench down to the roof surface and sampling horizontally in the face of the trench with an 86 mm long tubular sampler of 250 mL volume. After 1977, a vertical tube sampler, MSC type 1, 1 m in length and 70 mm in diameter was used. A trench was still required to allow insertion of a plate at the roof surface to protect the membrane from the sharp teeth of the sampler. Then the sampler was carefully screwed vertically down through the snow and ice layers until it reached the protective plate. The sample was weighed in the tube and discarded. The sample was rejected unless the height of the snow core inside the sampler was almost the same as the snow depth. Adjustments were made for the water and the slush often · found under the snow at the roof surface and which could not be picked up in the sampler, and an effective densitY• corresponding to the computed load and the measured depth, was also recorded. In deeper snow there was less con· tribution to increased density from slush, ice, and water.
TAYLOR 61 0
"'
o = HAUFAX M 0 E ori -:!; >-o..
•
c =EDMONTON• •
• =OTTAWA•
• = SASKATOON•
A= ARVIDA 0•
•
••
•
A A·-
• • A ••
セ@
<J} 'oo• l!o セセッセ@ cc 1:.1 .. 1 IJI:J.IJ. I o A A••
•
A 41loj>A I:.A•
z.•
•
w 0 0"
セ@
.
\'..
セN@ • ¥ • 00 ; - .t
A ヲANGNaMijMセセセMaL@•
)
--n-y-.JT-
·'-.:'
-;,-d
ᄋセZNM@ Vセ@ 1/(J..•
<J} w 0g
ol w u. u. w 0..
A • ••
•
•o oti1 0/' • AA• • • • A •
•
Hセ^ᆱ^@ セNGヲGャゥ@ Do • A • • • :A
•
A•
• Fセᄋ@ c ••
A • y. 2.71 + 0.19 (LOAD·s,
)I 55••
¥1
•
ッLOTセᄋLZ@.-
"'
• • 000 0 0-r
o\. (UNIFORM LOAD セᄋᄋ@•
•
DRIFTSil
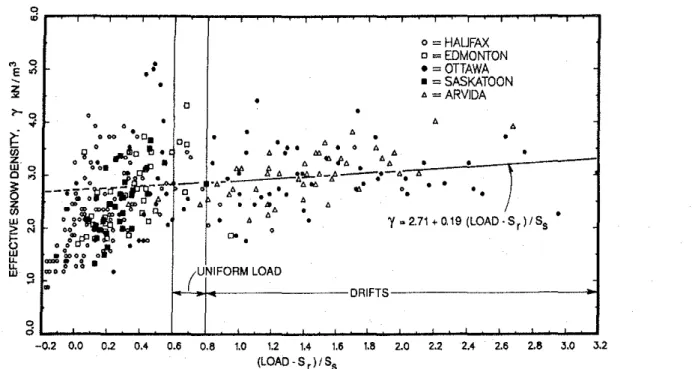
_L セ@ M セ@ M M 06 W U U U U U U U U U セ@ セ@ (LOAD·S,)iS5FIG. 4. Effective roof snow density versus the snow load at the same point. The load and effective density both include the weight due to ice and slush and water.
>.. ;;:· 0 z
"'
セ@ 0 0"'
セ@ 0 >-セ@"'
z セ@"
5.5 r---,----,---,---,---, 5. 0 4. 5 4.0 3.5 3.0 2.5 2.0 1.5 1.0 AVERAGE STANDARD ' DEVIATION· 0. 80. :
MZセZOセェ@
. .
_/...
Y.
..:..·.
.
...:
....
• •/
/.:·:
..
••
...
:.
.
•• • • 0.5 セMMMMlMMMセMMMMセセMMMjセMMセ@ 0 30 60 90 120 150DAYS FROM DECEMBER I INO. OF POINTS 881 LEAST SQUARES EQUATION
r•
0. 0133 • DAYS t 2.01CORRELATION COEFFICIENT • 0.488
STANDARD DEVIATION OF "1 • Q80 SG MEAN • 2.89
FIG. 5. Density, 'Y, of roof snow on two-level flat roofs in
Ottawa versus the number of days from December 1.
Because snow is a good insulator, and all the buildings were heated, the 0°C isocline moved up from the insulation in the roof to the roof-snow interface, causing melting. Some flat roofs had drains that were not at the lowest points of the deflected spans and were not effective in carrying
>..
,.·
0 z"'
"
z => 0"'
"'
"'
z w"
5. 0 4. 5 4.0 3. 5 3.0 2. 5 2. 0 1.5 1.0 • • AVERAGE STANDARD DEVIATION • 0.64··. ·:-:-]J
·:./
• • • 7 • • -=Y. . • • • • • .!-"'". • • セ@.·
. /...
. .
....
.
- · / 1 • "'.;>. •
I I •. . .
/ /"• /"/.'
• PNUセMMセセMMセセMMセセMMセセMMセ@ 0 30 60 90 120 150DAYS FROM DECEMBER INO. OF POINTS 991 LEAST SQUARES EQUATION y • 0. 0138 • DAYS+ I. 57 CORRELATION COEFFICIENT • Q 690
STANDARD DEVIATION OF "1 • 0. 64 SG MEAN· 2.52
FIG. 6. Density, 'Y, of ground snow in Ottawa versus number
of days from December 1.
away the meltwater; other roofs, though dry near the drains, had water some distance away. On some roofs the warm drains had evidently melted the insulating snow cover. Ice built up in rings around but some distance away from the drains, effectively damming up the water under the snow.
62 CAN. J. CIV. ENG. VOL. 19, 1992 70 60 50 40 30 20
..
10t
z 0 UJ 70@
60 a: u. 50 40 30 20 10 0 -0.2 tHAO% 0 0.2MAXIMUM AVERAGE LOAD
(20 x 20 m Area) MAXIMUM LOAD (6 x 6 m Area) 0.6 (LOAD·S1)iS8 0.8 1.0
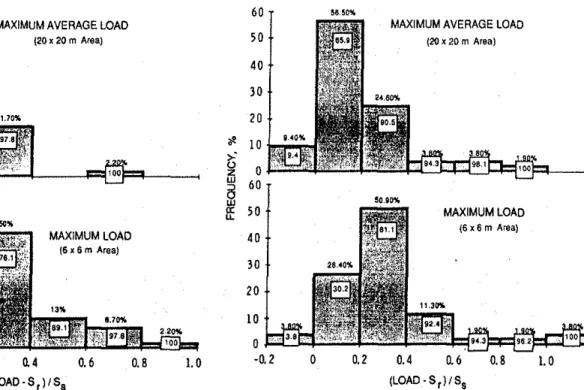
FIG. 7. Histograms of maximum average loads and maximum loads on upper roofs. Figures within bars are cumulative frequen·
cies, i.e., 89.)0Jo of upper roofs had maximum loads less than
0.685 + Sn Figures on tops of bars are frequencies. The number
of data pointS' was 46.
Depth measurements were made with metre sticks. Sampling of depths and densities was done after major snowstorms or at monthly intervals if at least 15 em of snow were present on the roof. Similar measurements were made of ground snow on the same day. Although sampling of depths was relatively easy, even when there was ice at the roof surface, density measurements were often difficult and time consuming. Consequently, survey data include many more depth than density measurements. At points where only depths were measured, loads were computed using densities estimated from those measured nearby.
Duration of surveys
Depths and densities have to be measured for a number of years to gain confidence that the heaviest drifts observed are near enough to the maxima to give the degree of safety required in structural design. For the roofs observed in Ottawa, for example, Fig. 3 illustrates that at least 5 years of observations were required to ensure that relatively high loads would be measured. As a general rule, surveys should
be conducted for 5-10 years, preferably 10; this survey
continued at some locations, including Ottawa, for up to 15 years.
Results from the survey
Roof snow densities
It is important to use data, wherever possible, that corre-spond to heavy snow loads comparable to those used for structural design. Therefore each of the roof snow densities measured at Halifax, Arvida, Ottawa, Saskatoon, and Edmonton was plotted versus the corresponding roof load (Fig. 4). Each load was normalized by subtracting the rain
component, S" and dividing by the snow component, S,
of the calculated 30-year return ground load (80 ) for that
..
>""
z UJ§
a: u. 60 50 40 30 10 10 0 60 50 40 30 10 10 0 -0.2 0 0.2MAXIMUM AVERAGE LOAD
(20 x 20m Area) 0.4 MAXIMUM LOAD (6 x6 m Area) 0.6 0.8 (LOAD·S 1)1S5 1.0 1.1
FIG. 8. Histograms of maximum average loads and maximum
loads on lower roofs (away from drifts). Figures in bars are
cumulative frequencies, i.e., 94.30Jo of lower roofs had maximum
average loads less than 0.6Ss + Sr. Figures on tops of bars are
frequencies. The number of data points was 53.
city at the location and elevation of the buildings surveyed.
The 1990 NBC values of S, and S, at the building sites are
shown in Table I.
It is apparent from Fig. 4 that for measured loads between
0.6S,
+
S, and 0.8S,+
S, (i.e., design loads for non-driftareas), the average roof snow density for the five cities was
about 3.0 kN/m3• This is also about the measured value
indicated for snow in drifts, even drifts up to 3.28,
+
S,.The 1990 NBC commentary on snow loads now recommends
a value of 3.0 kN/m3, about 25% higher than that
recom-mended in 1985. If local experience indicates that a higher figure is appropriate, it should be used!
Examples of roof and ground snow densities for Ottawa, where snow accumulates throughout the winter, are shown in Figs. 5 and 6, respectively. The scatter is large (coefficient
of variation
=
0.25 (ground) and 0.28 (roof), but there isa useful correlation (0.69 ground and 0.49 roofs) between increased density and the date. The date relates to the time for deposition and compaction and to the influence of solar radiation. Although the correlation is significant, it does not provide any precise way of estimating densities. It is noteworthy that the average density measured on these roofs
in Ottawa is 2.9 kN/m3, about 15"7o greater on average
than for ground snow (2.5 kN!m\ These average values as shown in Figs. 5 and 6 are reached by about the end of the first week in February. They exceed the 1985 NBC value
for roof snow (2.4 kN/m3) by about 20%, and for ground
snow in Ottawa (2.23 kN/m3 or 1.96 kN/m 3 plus the effect
of added rain) by about 13%. They are less than the pro· posed 1990 NBC value by 3.6% for roof snow and greater by 6% for ground snow. As noted earlier, the differences between roof and ground occur, in part, because of heat loss through the roofs and because of ice layers, and because slush and water at the roof surface is unable to drain away.
TAYLOR 63
0. 8 SUBURBAN セcold@ STORAGE BUILDING
o HALIFAX A ARVIOA TERRAIN '---\ |Hセrgeroof@ 0. 7 0. 6 • OTTAWA • SASKATOON o EDMONTON
''):
0Nセサ^@
"'
- 0.5 A 0. 4 X rn E 0. 3 セ@ 0. 2 0. I OPEN COUNTRY terrainセBG@.t
•
4 6 A··--·-•••
• • 0•
2.2H:5-
0.182 0])
C0.67H;" 19
-0.182•
0-ll--0
"
0 • FROM MONTE CARLO COMPUTER SIMULATION FOR OTTAWA, ONTARIO (ISYUMOV, 1971)
0
- 0. I
0 2 4 6 8 10 12 14 16 18 20 22 24
Hu
FIG. 9. Variation of maximum load, Lmax• on the upper roof during period of survey with height of the upper roof, Hu, above grade,
with superimposed results from computer simulation for Ottawa (lsyumov 1971).
This denser ュ。エ・イゥセャ@ increases the average density of the
overall snow cove_r, although the deeper the snow, the less important a relatively thin, heavy layer becomes. It is inter-esting to note that the density correlates poorly with snow depth, so schemes to relate snow density to depth appear to be ill advised.
Loads on upper roofs and on lower roofs away from the drifts
Two kinds of loads are discussed - maximum loads and maximum average loads. The maximum loads are the heaviest loads measured on an area on the roof about
6 m X 6 m. This area is large enough to be the tributary
or design area for roof decking, purlins, and (depending on their spans) even beams and joists. The maximum average loads are the heaviest average loads measured over the whole upper or lower roof (away from the drift) or over substan-tial areas greater than about 20 m x 20 m on large roofs. These loads affect the design of main girders and major trusses.
The largest values for each of these two kinds of loads for the total years of observation were extracted from the data set for the upper and lower roofs (away from the drifts). !he histograms in Figs. 7 and 8, which appear to be approx-Imately lognormal in shape, were plotted using these values, n?rmalized by subtracting S, and dividing by S,. These histograms indicate that the basic design loads in the 1990 NBC are not out of line with the data collected in this survey. The values marked in each bar of the histogram are the cumulative percentage of roofs having loads below the maximum class limit for each interval. For example, 89.1 o/o of the upper roofs (Fig. 7) had maximum loads less than
0.6S,
+
S, (the value probably used for their design).Further, 97.8% had maximum average loads less than
0:6S,
+
S, (indeed less than 0.4S,+
S,). In comparison,Fig. 8 shows that 92.4% of lower roofs sustained maximum
loads less than 0.6S,
+
S, and 94.3% carried maximumaverage loads less than 0.6S,
+
S,.Wind tunnel modelling of the deposition of snow on buildings at NRC's Institute for Research in Construction
between 1983 and 1985 indicated that the height, H0 , of the
upper roof above grade was an important parameter (da Matha Sant'Anna and Taylor 1990). As well, O'Rourke and Wood's (1986) parametric study of roof loads by regres-sion analysis indicates a correlation of maximum drift load
with H0 • Mikitiuk and Isyumov (1989), in discussing
Taylor's data (1987) shown in Fig. 9, argue that because
drifting at roof level is critically dependent on the wind speed, factors affecting wind speed at roof level are impor-tant; these must include, therefore, the terrain roughness
and the height of the roof, H0, above the ground. The
higher, the windier, although the rate of increase with eleva-tion slows down rapidly. The roofs in Ottawa to which Mikitiuk and Isyumov's Monte Carlo simulation curve applies are located in an industrial area at the edge of open country terrain. They should not include the two most
heavily loaded roofs in Ottawa (at Hu = 6. 7 m) because
the most heavily loaded is a cold storage building and the other is three times larger in area than the next largest roof. The exposures for all roofs in the survey fall between
exposure categories A and B (NBC 1990b). Some roofs are,
however, more exposed than others. The solid curves in
Fig. 9 indicate that above a limiting H0 of about 5-7 m,
loads on the upper roofs decrease as the buildings get taller. This is not surprising; to get any drifting along the snow surface, the wind speed must be above a threshold. At speeds much above the threshold, however, the drifting snow is whipped up by the turbulence and carried past the roof. For roof levels more than 13 m above grade, the magnitudes of the measured loads on the upper roof stop decreasing. On the other hand, the load on the lower roof (not shown) does
64 40 39.30% <f. 30
セ@
z w 20 ::> 0 w LOAD FACTOR •. --'-""--! a: u.. 10 7.20% 0 0 0. 2 0.4 0. 6 0.8 1.0 1.4 1.5MAXIMUM DRIFT LOAD I 1990 NBC DRIFT LOAD
FIG. 10. Histogram of ratio of maximum measured drift load to that calculated using the 1990 National Building Code of Canada
(density
=
3.0 kN/m3) Figures within bars are cumulative frequencies, i.e., 94.6% of maximum drifts were less than the 1990 NBCdrift load. Figures on tops of bars are frequencies. There were 56 data points. about 6 and 13 m and stabilizes at Hu of approximately
13m.
Loads in drifts
In this survey there were 56 drift locations on the 44 roofs observed. Most drifts were of approximately triangular shape in doss-section, like those assumed in building codes (Fig. 1). How do the maximum measured loads (at the apex of the triangle) compare with those calculated using the proposed 1990 NBC Commentary? A histogram showing the comparison is plotted in Fig. 10, with the cumulative distribution indicated as in Figs. 6 and 7. 94.6o/o of the mea-sured maxima were less than the recommended values. The remaining 5.4% represents three roofs in Ottawa for which the excess of maximum load over the 1990 NBC load was only 7.4% and 9.3% in two cases but 38% in the third. In any case these higher loads are covered by the NBC load factor of 1.5 applied to specified live loads for limit states design. In two cases the maximum loads at the apex of the
triangle were greater than the limiting value of 3.0S,
+
S,.These were the 9.3% and 38% cases just noted, and the loads
were 3.3S,
+
S, in the first and 4.2S,+
S, in the second.Snow in the former drift had a density of 3.1 kN/ml, and in the latter, 3.4 kN/m 3. These "overloads" in the Ottawa area give cause for caution, but are not large enough or sufficiently numerous to call for increase in limiting loads for drifts.
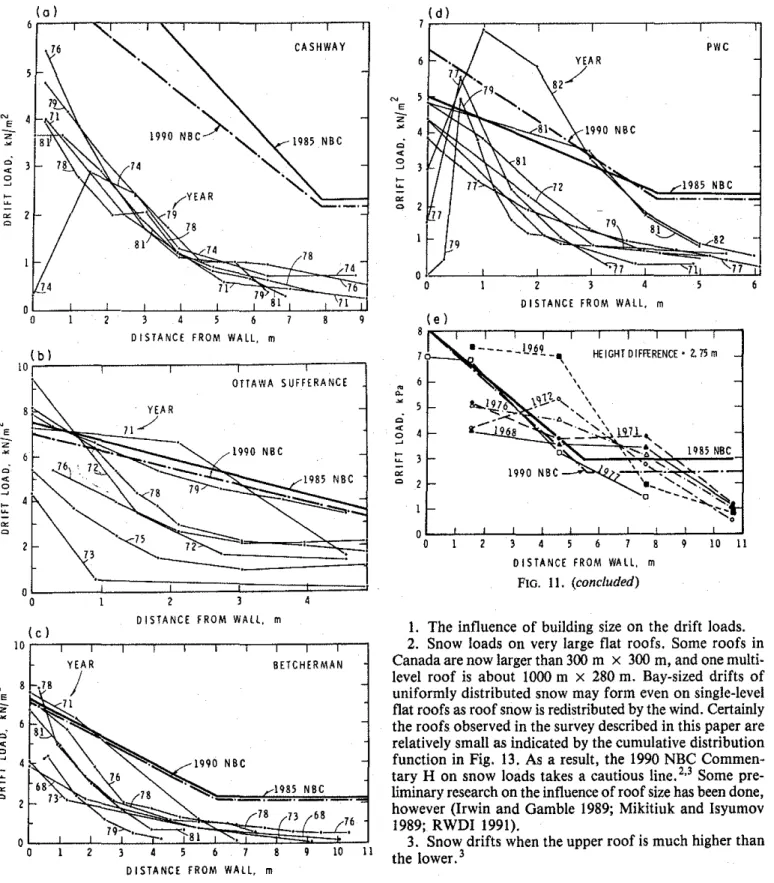
Load profiles
Load profiles for the 5 or 6 years with the highest
mea-sured loads are shown in Figs. lla-lle for four roofs in
Ottawa and one at Arvida (Taylor 1984, 1987). On each of these the design loads in the 1985 and 1990 National Build-ing Code are also indicated. Measured loads significantly higher than those in the 1990 Commentary occurred in 1972 on Ottawa Sufferance (by 26%) (Fig. lib), in 1982 on the
PWC building, Ottawa (Fig. lid), and in 1969 and 1972
on a roof in Arvida (Fig. lie). Although they are not given here, the depths measured on the PWC roof in 1982 (Fig. 12) are only about 9% greater than those obtained by using the 1990 NBC loads and assuming a density of 3.0 kN/m3. Hence, the snow causing the increase in load must have had a density greater than the "design" value of 3 .0. It did
indeed- 3.5 kN/m 3. The overload, as high as 35%, 2m out from the wall is significant and serves as a warning, since it occurred once during 12 years of observations. It is inter-esting that this load was measured on the roof that had the
lowest change in elevation (AH
=
2.13 m). Anotherbuild-ing with a small AH, not included in the survey, suffered
a structural failure caused by a large overload from an excessively long drift. The lesson is that small drift volumes could be quickly filled, even overfilled, especially in areas where heavy single snowfalls and drifting occur.
As shown in Fig. lie, drifts on one roof at Arvida
signif-icantly exceeded the 1990 NBC triangular volume in a num-ber of years, although their maxima, at the apex, were less than the NBC values. At Arvida the "problem" roof had a difference in elevation of 2.75 m, and for the amount of
snow that falls there (S0 = 2.6
+
0.4 kPa), this drift couldalso be quickly overfilled for the critical wind direction. Such cases emphasize the need not only for more field data but also for fundamental research on drifting, perhaps using wind tunnels or water flumes.
Variability of snow loads and density
Roof snow loads tend to be highly variable from one year to the next. The average coefficient of variation of maximum
annual loads on upper and lower roofs is about 50%, 1 and
of the maximum drift loads, approximately 55%. The greatest variability is found in Halifax and the least in Edmonton. Arvida, the heaviest snow area in this survey, had the least variability of drift loads at 40%.
For the years surveyed, the coefficient of variation of the snow density in the yearly maximum drifts is about 25"io in Ottawa and 40% in Halifax, and the coefficient of
varia-tion of the densities for loads above 0.580 in Fig. 4 is
approximately 20%.
1A detailed look at variabilities is found in a contract report
prepared for the Canadian Wood Council, "Variation and duration
of snow loads on roofs in Canada," by D.A. Taylor and D.E.
Allen, Institute for Research in Construction, National Research
Council of Canada, November 1987. A paper derived from this report is being prepared for submission to the Canadian Journal of Civil Engineering.
TAYLOR 65 (a) (d) 6 セセセセMMMMMNMMMMLMMMMMLMMMMMLMMMセ@ N E
z
セ@ セ@z
0 CASHWAY 3 4DISTANCE FROM WALL, m
HL「NセIMMMLMMMMMLMMMMMLMMMMMLMMML@
lOr N E N 0 < 0 セ@ E-
z セ@ c;"'
0 セ@ セ@ セ@ セ@ 0 0 0 (c) 10 8 .78 0 0 OTTAWA SUFFERANCE 1DISTANCE FROM WALL, m
8ETCHERMAN
. 1 .
z
6 8 10 IIDISTANCE FROM WAll, m
FIG. 11. Drift load profiles on lower roofs of four two-level flat roofs in Ottawa and one in Arvida. (The abscissa is the full length of the lower roof.) See Fig. 12 for orientation and size of the Ottawa roofs. The Arvida roof is oriented such that a wind from the WSW would blow over the 31 m long upper roof towards
the 18 m long lower roof. The prevailing winter winds at Arvida
are from the northwest. (a)-(d) Ottawa; (e) Arvida.
Research needs
. In spite of the research already completed, relatively little
IS known about the following:
N E
z
セ@ Q < '3 セ@ セ@ セ@ 0 • セ@ セ@ Q < 0 セ@ :;: ;;; 0 4 3z
77:t
79 0 (e) 8 6 4 0 0 PWCz
3 4 0 l STANCE FROM WALL. mHEIGHT DIFFERENCE • 2. 75 m
3 4 6
OlSTANCE FROM WALL, m
FIG. 11. (concluded)
9 10 11
I. The influence of building size on the drift loads.
2. Snow loads on very large flat roofs. Some roofs in Canada are now larger than 300 m x 300 m, and one multi-level roof is about 1000 m x 280 m. Bay-sized drifts of uniformly distributed snow may form even on single-level flat roofs as roof snow is redistributed by the wind. Certainly the roofs observed in the survey described in this paper are relatively small as indicated by the cumulative distribution function in Fig. 13. As a result, the 1990 NBC
Commen-tary H on snow loads takes a cautious line. 2•3 Some
pre-liminary research on the influence of roof size has been done, however (Irwin and Gamble 1989; Mikitiuk and lsyumov 1989; RWDI 1991) .
3. Snow drifts when the upper roof is much higher than the lower. 3
'Commentary H: Paragraph 11, page 188- "Therefore for roofs fully exposed to the wind (though not for very large roofs where it may be inappropriate) the wind exposure factor, Cw, may
be taken as 0.75 rather than 1.0 ... "
'Commentary H: Paragraph 34, page 194 - "The accumula-tion factor in Figure H-4 is based on observaaccumula-tions taken on roofs with a difference in elevation of about 1 storey (2 to 5 m) and where the upper roofs were usually less than 75 m long measured parallel to the wind direction. Drifts produced by snow blown from large roofs may exceed the suggested limits in Figure H-4, but not enough data exist about such roofs to make definite recommendations."
4. 9 Area 572m2 OTTAWA SUFFERANCE H .. 6.71 m 1,5 34.7 42.7
....
2993 m2 BETCHERMAN H =6,7! m"·'[.,
MセGᄋG@ 6H"3,05m 19,5 ll.O 15.2 9.1 53.0 6. I Area 1712 m2 セ@ PWC "" 32,3 • H=7.01m'
セ@ 35,4 Area 2050 m2 CASHWAY 57.9 H"'8.23 m b.H =3.96 mFIG. 12. Plan view of four of the buildings in Ottawa showing
sizes and orientations. All dimensions are in metres. Exposures are
between open and suburban (A and B), and prevailing winter winds for December to February (inclusive) are from the WNW, and for March from the east.
1000 2000 3000 4000 5000 13000 14000
AREA OF UPPER ROOFS (OR SINGLE LEVEL ROOFS), m2
FIG. 13. Cumulative distribution function of roof sizes in the survey. Only the areas of single-level roofs or of the upper level
of two-level roofs are included. For example, 92'7o of single-level or upper-level roofs had areas less than 2800 m 2
•
Conclusions
Analysis of the data from a 15-year survey of snow on simple and multi-level flat roofs from Halifax to Edmon-ton leads to the following conclusions:
I. Maximum annual snow loads on roofs, as measured
in this survey, are quite variable, with coefficients of varia-tion of about 50'7o. The coefficient of variavaria-tion of snow density is about 20%.
- 2. The density of snow on flat roofs, including snow in
the drifts, is about 3.0 kN/m3, some 25% higher than was
recommended in the 1985 National Building Code's com-mentary on snow loads.
3. The loads on upper roofs are very sensitive to wind velocities and decrease as roof elevations increase from about 6 to 13m.
4. No more than 5.4% of roofs had maximum drift loads above those recommended in the 1990 NBC commentary on snow loads.
5. The maximum and average loads measured on lower flat roofs away from the drifts, and on upper roofs, indicate
that the design value of 0. 6S,
+
S, recommended for the1990 National Building Code of Canada is a good estimate for exposed roofs,
Acknowledgements
The author would like to thank those who took observa-tions over the years and in particular P.J. Daly in Ottawa, J.D. Atkins in Halifax, J. Makohon in Saskatoon, A. Lorenson of ALCAN in Arvida, and Prof. J. Longworth, University of Alberta, who arranged the obser-vations in Edmonton. The universities of Laval and Waterloo, as well as the Meteorological Station in Gander, also participated. D.A. Lutes of National Research Coun-cil of Canada, Ottawa, organized the overall survey in 1967 and conducted it untill972. The author also appreciates the dedication of Adrien Comeau who did preliminary analysis of the data.
ASCE. 1988. Minimum design loads for buildings and other struc-tures. ASCE 7-88, American Society of Civil Engineers, 345 East 47th Street, New York, NY 10017-2398.
Da Matha Sant'Anna, F., and Taylor, D.A. 1990. Snow drifts on
flat roofs: wind tunnel tests and field measurements. Journal
of Wind Engineering and Industrial Aerodynamics, 34: 223-250. Irwin, P.A., and Gamble, S.L. 1989. Predicting snow loading on the Toronto Skydome. Proceedings, First International
Con-ference on Snow Engineering, June 10-15, 1988, Santa Barbara,
Calif., pp. 118-127. Appeared as CRREL Special Report 89-6.
Edited byE. Wright and W. Tobiasson. Cold Regions Research
Engineering Laboratories, Hanover, N.H.
ISO. 1981. Bases for design of structures- determination of snow loads on roofs. ISO 4355-198l(E), International Organization for Standardization, Standards Council of Canada, Ottawa, Ont. lsyumov, N. 1971. An approach to the prediction of snow loads. Ph.D. thesis (Research Report BLWT-9-71), University of
Western Ontario, London, Ont.
Mikitiuk, M., and Isyumov, N. 1989. Variability of snow loads
on large-area flat roofs. Proceedings, First International Con-ference on Snow Engineering, June 10-15, 1988, Santa Barbara,
Calif., pp. 142-157. Appeared as CRREL Special Report 89-6.
Edited by B. Wright and W. Tobiasson. Cold Regions Research
Engineering Laboratories, Hanover, N.H.
NBC. l985a. National Building Code of Canada 1985. National Research Council of Canada, Ottawa, Ont., NRCC 23174, pp. 162-163.
NBC. 1985b. Commentary H, Snow loads. Supplement to the National Building Code of Canada 1985. National Research Council of Canada, Ottawa, Ont., NRCC 23178, pp. 203-218. NBC. l990a. National Building Code of Canada 1990. National Research Council of Canada, Ottawa, Ont., NRCC 30619, pp. 147-148.
NBC. l990b. Commentary B, Wind loads. Supplement to the National Building Code of Canada 1990. National Research Council of Canada, Ottawa, Ont., NRCC 30629, p. 142. NBC. 1990c. Commentary H, Snow loads. Supplement to the
National Building Code of Canada 1990. National Research Council of Canada, Ottawa, Ont., NRCC 30629, pp. 187-199. Newark, M.J. 1984. A new look at ground snow loads in Canada. Proceedings, Eastern Snow Conference, Vol. 29, 41st Annual meeting, Washington, D.C., pp. 37-48.
Newark, M.J., Welsh, L.E., Morris, R.J., and Dnes, W.V. 1989. Ground snow loads for the 1990 National Building Code of Canada. Canadian Journal of Civil Engineering, 16(3): 267-278. O'Rourke, M.J., and Wood, E. 1986. Improved relationship for drift loads on buildings. Canadian Journal of Civil Engineer· ing, 13(6): 647-652.
RWDI. 1991. Snow loads on large roofs. Report 91-190F-4, for
TAYLOR 67
Council of Canada by Rowan, Williams, Dawes and Irwin Inc.,
Guelph, Ont.
Taylor, D.A. 1979. A survey of snow loads on roofs of arena-type
buildings in Canada. Canadian Journal of Civil Engineering,
7(1): 1-18.
Taylor, D.A. 1984. Snow loads on two-level flat roofs. Pro-ceedings, Eastern Snow Conference, Vol. 29, 41st Annual Meeting, Washington, D.C., pp. 3-13.
Taylor, D.A. 1987. Snow loads on multi-level flat roofs in Canada.
Proceedings, 55th Western Snow Conference, Vancouver, B.C.,
pp. 133-141.
Templin, J.T., and Schriever, W.R. 1982. Loads due to drifted snow. ASCE Journal of the Structural Division, 108(ST8): 1916-1925.