HAL Id: hal-02102990
https://hal.archives-ouvertes.fr/hal-02102990
Submitted on 17 Apr 2019HAL is a multi-disciplinary open access archive for the deposit and dissemination of sci-entific research documents, whether they are pub-lished or not. The documents may come from teaching and research institutions in France or abroad, or from public or private research centers.
L’archive ouverte pluridisciplinaire HAL, est destinée au dépôt et à la diffusion de documents scientifiques de niveau recherche, publiés ou non, émanant des établissements d’enseignement et de recherche français ou étrangers, des laboratoires publics ou privés.
Influence of a bioadmixture on standardized parameters
of cementitious materials
Nicolas Serres, Huan He, Thierry Meylheuc, Francoise Feugeas
To cite this version:
Nicolas Serres, Huan He, Thierry Meylheuc, Francoise Feugeas. Influence of a bioadmixture on stan-dardized parameters of cementitious materials. EUROCORR 2016, Sep 2016, Montpellier, France. �hal-02102990�
Influence of a bioadmixture on standardized parameters of cementitious
materials
Nicolas Serres1, Huan He2, Thierry Meylheuc3, Françoise Feugeas4
1ICube, INSA de Strasbourg, CNRS, 24 Boulevard de la Victoire, 67084 Strasbourg Cedex,
France, nicolas.serres@insa-strasbourg.fr
2ICube, INSA de Strasbourg, CNRS, 24 Boulevard de la Victoire, 67084 Strasbourg Cedex,
France, huan.he@insa-strasbourg.fr
3INRA - B2HM, 25 Avenue de la République, 91300 Massy, France,
thierry.meylheuc@jouy.inra.fr
4ICube, INSA de Strasbourg, CNRS, 24 Boulevard de la Victoire, 67084 Strasbourg Cedex,
France, francoise.feugeas@insa-strasbourg.fr
Abstract
A lipopeptide bioadmixture was used to modify the surface bio-contamination of concrete and their durability. Experimental investigations were intended to establish the influence of this bioproduct regarding different properties of mortar and/or cement paste samples. Standardized tests, such as slump test, flexural and compressive strength measurements as well as porosity determination, aim to confirm the ability of this bioproduct to be used as an admixture in cementitious materials. The bioadmixture introduced an effect on the workability of fresh samples with a plasticizing action. The bioproduct can improve the mechanical strength of Portand cement mortars depending on its content in samples and allows to reach resistances consistent with the standard strength class of samples. If the bioadmixture does not influence the total porosity available to water of the cement pastes, the mercury injection porosimetry has revealed the existence of a threshold from which the porous network of samples changes. The evolution of the surface roughness is also impacted by the bioadmixture, due to both curing time and interactions of the surface with water. The bioadmixture inhibits the development and the formation of crystals on the sample surfaces and modifies hydric transfers within the porous network of the samples.
Introduction
This work is motivated by environmental considerations in purpose to develop environmentally friendly admixtures, which aim to replace products subjected to REACH authorization, in order to develop eco-friendlier concrete. Some bacterial species secrete extra-cellular substances, in the aim of protection especially when their environment becomes aggressive and to increase their adhesion on material surface by constituting biofilms [1]. Many bacteria are able to produce amphipathic substances i.e. ‘biosurfactants’, which are potentially interesting compounds for many fields of study, due to having both hydrophilic and hydrophobic moieties in the same molecule [2]. Nature and properties of biosurfactants produced by microorganisms depend on the type of microorganism, tested strain, available nutrients and culture conditions. Several studies have demonstrated antimicrobial activity for some of them, such as lipopeptides (surfactin, iturin, etc.) produced by Bacillus and Pseudomonas [3] or amphisin compounds which possess strong antifungal activity [4]. In natural ecosystems, these biomolecules are often involved in the biological control of many plant pathogens [5] acting as an antagonism mechanism for controlling plant pathogenic germs (zoospores) by creating ducts in cytoplasmic membrane of the infectious germ [6]. Biosurfactants also have the advantage of being the most efficient and stable (Bacillus subtilis [7]) in a wide range of environmental conditions (pH, temperature, salinity). Some are able to maintain their surface activity at temperatures up to 90°C [8] or salinity up to five times higher than those tolerated by chemical surfactants [9]. The emulsifying properties of surfactants synthesized by Serratia marcescens are also preserved in temperatures in the range of 10 – 120°C and pH values ranging from 2 to 12 [10]. In addition, unlike most chemical surfactants, biosurfactants exhibit better biodegradability and lower toxicity [11].
The biosurfactants are already used in many applications in different industrials fields, such as cosmetic, pharmaceutical, food, ink, paint or coating [12]. However, according to the authors’ best knowledge, there is no current application as admixture for cementitious materials, with an incorporation as mass product in the concrete formulation, using a biosurfactant. A lipopeptide biosurfactant (viscosinamide) derived from Pseudomonas fluorescens was used in this work. The active principle of this bioproduct consists of bacterial exo-products, i.e. extracellular substances. This product has already improved antibacterial properties and inhibition of the adhesion of pathogenic Listeria monocytogenes in case of stainless steel [13]. In this study, the use of such product will allow to control the surface biocontamination of concrete and their durability, by increasing their resistance to natural environments, characterized by external agents. In a biodeterioration process, these external agents can be biological elements, such as microorganisms, or chemical compounds secreted by microorganisms. In the case of a biological attack, i.e. a localized attack, the chemicals are secreted inside a biofilm covering the material and/or inside the porous network. Thus, the decrease of the pore sizes seems an interesting target regarding the improvement of the characteristics of a bioadmixtured concrete in relation to this risk.
This paper aims to evaluate the efficiency of the bioproduct as admixture for concrete using cement pastes (CEM I) and mortar samples thanks to implementing standardized tests, such as slump test, flexural and compressive strength measurements as well as porosity determination. Some characterizations have been carried out to analyze the efficiency of the new admixture on the porosity and surface roughness of the material. Capillary imbibition tests were also implemented to show the influence of such admixture on the hydric transfers inside the material bulk.
Material and methods Sample preparation
Cement pastes were produced according to the EN 196-1 standard. These samples were made with a water–cement (W/C) ratio of 0.4 allowing the complete hydration of the cement and a suitable rheology for handling the fresh material. These samples were manufactured – with an ordinary Portland cement CEM I 52.5 R CE CP2 NF (98.5% clinker and 1.5% secondary constituents) – as blocks of 5×5×5 cm3, removed from the mould after 24h and stored in a conservation room (28 and 120 days) at 23 ± 2°C with a relative humidity (RH) higher than 90%. The bioadmixture content in the samples was ranging from 0.25 to 5% of the cement mass and the adopted formulations are presented below (Table 1).
Table 1 – Cement pastes formulation.
Cement (kg/m3) Water (kg/m3) Bioadmixture (kg/m3)
180 ± 1 72 – 63 0 – 9
W/C = 0.4 BA/C = 0 – 5 (%)
Mortars were produced according to the NF EN 196-1 standard. The amount of sand was constant (1350 g), for 450 g of cement. The amount of water (+ bioadmixture) was adjusted to reach W/C = 0.5 to obtain completely hydrated samples. The bioadmixture content in the samples was ranging from 0.25 to 2.5% of the cement mass and the quantity of the constituents is detailed below (Table 2). Mortar samples were manufactured – with the same Portland cement CEM I 52.5 R CE CP2 NF – as blocks of 4×4×16 cm3, removed from the mould after 24h and stored in a conservation room (28, 120 and 180 days) at 23 ± 2°C with RH > 90%.
Table 2 – Mix design of mortar samples.
Cement (g) Sand (g) Water (g) Bioadmixture (g) 450 ± 1 1350 ± 5 225 – 213.8 0 – 11.2
W/C = 0.5 BA/C = 0 – 2.5 (%)
The bioadmixture was produced according to a technique based on cultivation of bacteria [13]. This product was considered as a liquid phase made of water plus surfactant and the amount of supplementary water added was deducted, as for all admixtures, in order to comply with the W/C ratio. This bioadmixture is a lipopeptide biosurfactant derived from Pseudomonas
fluorescens. Its active principle consists of bacterial exo-products (extracellular substance). The
bioadmixture was incorporated as mass product in the sample formulations. Slump test
Slump values of the fresh mortar samples were obtained using a mini-cone with a top diameter of 50 mm, bottom diameter of 100 mm and height of 150 mm. The slump was measured at the room temperature, i.e. 21 ± 2℃. The slump was determined as the difference between the initial and the final heights of mortar after removing the mini-cone. After the first (initial) slump was measured, slump heights (slump values) were regularly measured at intervals of 15 minutes. The whole test period was 150 min.
Mechanical tests
Both compressive strength and flexural strength were performed using an Instron 3384 floor model universal testing system. A load cell with a capacity of 150 kN was used. The load
measurement accuracy of machine is ±0.5% of reading values. A test speed of 2 mm/min and 1 mm/min for compressive strength and flexural strength were used, respectively, with an accuracy of ±0.2%. For flexural strength experiment, three mortar samples from each mixture group were tested according to the NF EN 196-1 standard. Then, the compressive strength tests were conducted using six broken pieces of mortar from flexural strength test.
The flexural strength of mortars, σf (MPa), was calculated according to (Equation 1):
𝜎#= %.' × *+ × ,
- × ./ (Eq. 1)
with Ff (N) the load at the fracture point, L (mm) the length of the support span, b (mm) the
width and d (mm) the thickness.
The compressive strength of mortars, σc (MPa), was calculated according to (Equation 2):
𝜎0 = *1
2 (Eq. 2)
with Fc (N) the applied load and A (mm²) the area of the clamping plates (40 mm²).
Evaluation of the porosity
Available water porosity measurements have been carried out according to the NF EN 18-459 standard. This technique allows estimating the total porosity of the material, i.e. the ratio between the total volume of voids on the volume of the tested sample. Cement pastes and mortars were weighed under water and in the saturated surface-dry (SSD) conditions. Each sample was dried in an oven at 50℃ until constancy of weight. The porosity was calculated in accordance with the difference in weight between the water-saturated state and oven-dry conditions (Equation 3).
𝑝 = 4556746
4556748 ×100 (Eq. 3)
with p (%) the porosity, Ww (g) the weight of the sample in water-saturated, Wssd (g) the sample
weight in the saturated surface-dry condition and Wd (g) the dry sample weight after the oven
treatment.
Capillary imbibition tests were also carried out on cement pastes to evaluate the influence of the bioadmixture on their porous network. The capillary absorption method consists in observing the natural penetration of the wetting liquid (distilled water) into the porous network of the dry sample. The tests were adapted from the NF EN 480-5 standard. The sample was placed on a draining geotextile, which allows the contact between the wetting fluid and the bottom of the sample. The capillary absorption coefficients were evaluated by considering the absorption phase as a linear function of the square root time (Equation 4).
∆<
= = 𝐴 𝑡 (Eq. 4)
with ∆W/S (g.cm–²) the absorbed water, t (s) the time and A (g.s–1/2.cm–2) the capillary absorption coefficient.
The mercury injection porosimetry (MIP) allows obtaining much information about the porous network (pore size, volume, distribution, etc.) of the cement pastes and its architecture (geometry) by the pores access radius. It consists in injecting a non-wetting liquid (mercury) in a porous material under controlled pressure. The first mercury injection was followed by a desorption and a second injection allows the evaluation of the total, free and trapped porosity. The pressure applied allows having access to porosities with a range of access diameters from
300 µm up to 3.6 nm. The porosity error margin is about 4% whatever the measured value. The radius of the pore class where the mercury was injected (rp) was determined from the Washburn
formula (Equation 5). 𝑟A = −C × DEF× GHI θ
JEF (Eq. 5)
with σHg the surface tension of the mercury (0.480 < σHg (N/m) < 0.485), θ the contact angle
between mercury and the surface of the sample (130 < θ (°) < 141.3) and PHg the mercury
pressure.
Surface roughness
In order to observe the evolution of cement paste surfaces with the increasing of curing age (28 and 120 days), their roughness was measured with a non-contact 3D measurement system (STIL® Micromesure station) equipped with an optical pen (axial resolution of 10 nm and lateral resolution of 2 µm). A 20×20 mm² area, selected in the centre of the sample was scanned. Cement pastes were first polished through 1200-grit using abrasive paper to ensure the reproducibility of the surface roughness (regarding porosity). The polished samples were next scanned with the 3D measurement device and then put into water until a curing age of 120 days in the conservation room (T = 23 ± 2°C) before another scan of the surface. Samples were not polished again before this second measurement. The curing conditions were identical for all samples (temperature, quantity/quality of the water) (Table 3).
Table 3 – Quality of curing water and sample surfaces.
28 days 120 days Curing water pH = 8.5 pH = 9.4 Surface of the sample pH = 12.7 pH = 12.0 Microscopic observations
The surfaces of the samples have been observed (without specific preparation) with a scanning electron microscope Philips XL30 ESEM coupled with EDS analysis. The samples have been analyzed under 0.9 Torr (120 Pa) water vapour partial pressure using at least 15kV electron accelerating voltage, to provide enough energy to the electron of the beam to excite the elements during EDS analysis.
Results and discussion
Workability of the fresh mortars
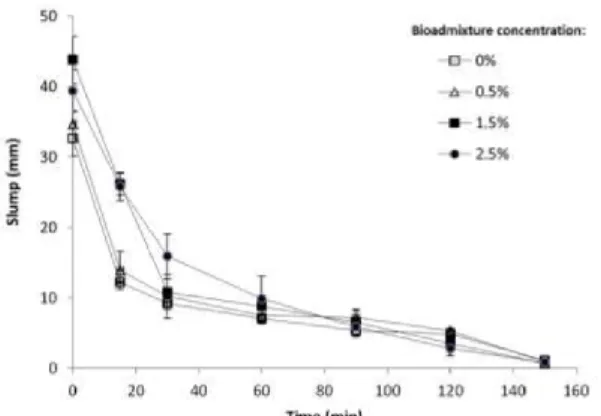
Slump tests have been carried out to evaluate the influence of the bioadmixture regarding the workability of Portland cement mortars at fresh state (Figure 1). The slump loss values of the mortars follow a similar trend, i.e. the values decrease with the elapsed time, which is normal because the setting of the cement ‘stiffens’ the mixture after one hour. Whatever the bioadmixture content inside the samples, the values converge, i.e. the slump of mortars strongly decreases in the early 30 minutes, and then slows down moderately later on. The admixture rate seems to have an effect on the workability of mortars, because only samples containing 1.5 and 2.5% of bioadmixture show a significantly higher slump in comparison with the unadmixtured mortar. A dosage of 1.5% of bioadmixture allows to reach a maximum threshold of initial slump bigger than 43 mm. This result suggests that the bioadmixture incorporation improves the workability of the fresh mortar and its optimal concentration could be 1.5%.
Figure 1 – Evolution of slump of CEM I based mortars according to the time.
The slump loss evaluation over a period of 150 minutes reveals that the bioadmixture does not trouble the slump loss rate of fresh mortars (Table 4). Indeed, mortars show a stable value during 30 to 60 minutes, whatever the admixture content, even if for 30 minutes, mortars containing 2.5% of bioadmixture have a lower slump loss rate.
Table 4 – Slump loss rate evolution of CEM I based mortars with time.
Bioadmixture concentration (% by weight of cement) 0 – 30 min. 0 – 60 min.
0 71% 77%
0.5 70% 78%
1.5 75% 79%
2.5 59% 74%
Some admixtures (water reducers and superplasticizers) are used to modify the workability of the fresh material (its rheology). The experimental results allow to see that the bioadmixture acts as a plasticizer on mortars because it increases their workability for a constant given water-cement ratio. This effect seems variable according to the amount added.
The adding 1.5% of bioadmixture induced a reduction by at least 5% of the water input in order to reach the same slump than the control sample (without bioadmixture) (Table 5). This water supply decrease of 7.5 % allows to qualify the bioadmixture as a plasticizer thanks to the recommendations of the NF EN 934-2 standard. The chemical composition of the Portland cement (C3A, C4AF, C3S and C2S) is responsible of the rate of slump loss observed in presence
of admixture during the first 30 minutes of mixing: C3A and C4AF would absorb the large
amount of admixture, decreasing the zeta potential of cement particles, which is why a type of admixture like a lipopeptide biosurfactant could also increase the rate of slump loss [14].
Table 5 – Water supply decrease, at constant slump, of Portland cement mortars.
Water (g) Water supply decrease (%) Control sample (CEM I) 225 -
Mortar (CEM I) containing 1.5% of bioadmixture
(by weight of cement) 208 7.5 ± 2.0
The hydration of tricalcium silicate (C3S: 60 – 65% in the clinker chemical composition) allows
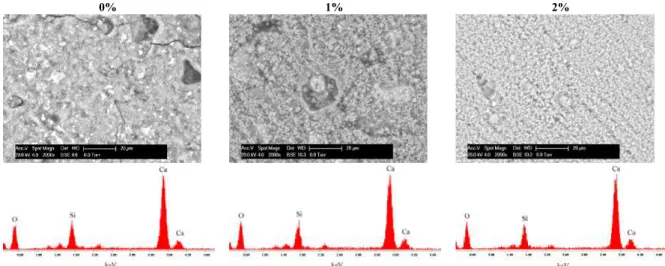
to form calcium silicate hydrates (C-S-H), that are the main hydration products of Portland cement, with calcium hydroxide (CH) that control the mechanical strength in the material. It is possible that the chemical composition of the bioproduct alters the kinetics of cement hydration. In order to compare the hydration state of cement samples, some SEM images were taken using backscattered electrons mode (Figure 2) in a low-vacuum mode. The cement grains are more or less hydrated: hydrates appear bright-white in colour due to their higher atomic masses, while
the unhydrated grains are grey (voids are black). The presence of the unhydrated particles decreases from 5.7 to 1.8% according to the bioadmixture content (Table 6).
Table 6 – Relationship between the bioadmixture content and unhydrated particles (SEM observations) on the surface of Portland cement mortars.
Bioadmixture concentration (%) Unhydrated particle area (µm2) Unhydrated particle rate (%)
0 62.7 5.7 0.5 60.3 5.4 1 56.8 4.2 1.5 48.0 2.2 2 52.6 2.1 2.5 54.7 1.8
The low-vacuum mode allows the analysis of samples without dehydration. Figure 2 provides information on the chemical composition and morphology of the particles. It seems worth to point of that the cement hydration products in mortars have a different grey-level resolution according to their backscattering coefficients. The accuracy of the results depends therefore both on image quality and operator choice regarding the grey-level threshold selection. Thus, results of 2.2, 2.1 or 1.8% of unhydrated particles cannot be considered as showing differences of grains hydration in the whole sample. However, it appears clearly that from a 1.5% concentration of bioadmixture, the unhydrated particle rate decreases according to the bioproduct content (Table 6), because the values change from 5 to 2%.
0% 1% 2%
Figure 2 – Morphology and EDS analysis of C-S-H according to the bioadmixture content, after 28 days of curing.
The morphology of the C-S-H gel changes with the bioadmixture content, as its density increases (Figure 2). Regarding the EDS spectra, the peaks of the calcium, silicon and oxygen are clearly distinguished this confirms that C-S-H are observed. However, it is not possible to see any difference according to the bioadmixture rate using EDS with the low vacuum mode in the chamber of the microscope for this measurement. Both this semi-quantitative analysis and the low-vacuum mode induce uncertainties preventing a precise evaluation of the quantities of the chemical elements according to the peak height.
Compressive and flexural strengths
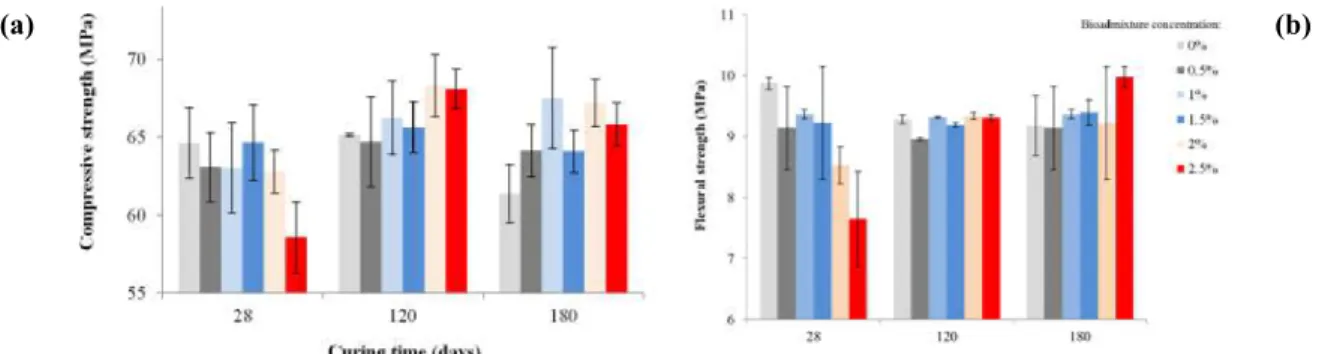
An essential feature regarding a hardened cementitious material is the mechanical strength at a given age. The compressive strength (Figure 3a) of the Portland cement mortars is in the range
of 58.6 – 64.6 MPa at 28 days; 64.7 – 68.3 MPa at 120 days and 61.4 – 67.2 MPa at 180 days. In other words, these results are very close, taking into account standard deviations, although an influence of the curing time seems to appear. Furthermore, the results are still consistent with the strength class of the samples (standard strength class 52.5).
(a) (b)
Figure 3 – Effect of the bioadmixture content on compressive (a) and flexural (b) strengths of mortars (CEM I) according to the curing time.
The bioadmixture content has no effect on the compressive strength of the mortars after 28 days of curing, even if the strength decreases to 58.6 MPa for a concentration of 2.5%, reflecting an influence (negative) of the bioproduct on the mechanical strength of mortars when its content is high. After 120 days of curing, for bioadmixture concentrations ranging from 0.5 to 1.5%, the compressive strength values are equivalent to those of the mortar without bioadmixture (Figure 3a), with an average value of 65.3 ± 1.0 MPa. In contrast, at concentrations of 2 and 2.5%, the compressive strength increases to 68.3 and 68.1 MPa, respectively. Unlike the previous case, these high bioadmixture concentrations lead to an increase in the compressive strength of mortars. After 180 days of curing, the results are more heterogeneous insofar as high bioadmixture concentrations (2 and 2.5%) also lead to an increase in the compressive strength (versus control sample) – as the concentration of 1% – whereas for concentrations of 0.5 and 1.5%, the results are equivalent to the control sample (without bioadmixture) (Figure 3a). The bioadmixture concentration does not therefore lead to the same effect according to the curing time. High bioadmixture content allows to increase the mechanical strength of mortars after 120 and 180 days of curing time, whereas after 28 days, the compressive strength decreases with high bioadmixture concentration. However, whatever the curing time, a bioadmixture concentration of 1.5% seems sufficient to achieve resistances of the same order of magnitude (slightly higher after 180 days) than the sample without bioadmixture.
The flexural strength (Figure 3b) of the unadmixtured mortars slightly decreases according to the curing time between 28 and 120 days. Between 120 and 180 days, the flexural strength values are close. For the samples containing bioadmixture at concentrations ranging from 0.5 to 2.5%, the values are in the range of 7.5 – 9.2 MPa at 28 days; 8.9 – 9.3 MPa at 120 days and 9.0 – 9.9 MPa at 180 days. A decrease in flexural strength for high bioadmixture concentrations (2 and 2.5%) after 28 days of curing is observed. However, the strengths are similar whatever the bioadmixture content at 120 days and an increase is even observed with a concentration of 2.5% at 180 days. Thus, the flexural strength seems to depend on the curing time.
These results suggest an influence of the bioadmixture regarding the flexural strength of the mortars. Again, high bioadmixture concentrations in samples are not always favourable to improve the flexural strength, especially at 28 days. However, bioadmixture concentrations
ranging from 0.5 to 1.5% provide equivalent results to those obtained for the sample without bioadmixture, whatever the curing time.
The modification of compressive strength of mortars may be due primarily to the formation and structure of C-S-H (the principal hydration product). The silicate chain could produce bond forces and electrostatic forces which are the main factors increasing mechanical strength of these materials. Thus, the biosurfactant could affect the mechanical strength through modifying the hydration kinetics of cement. In addition, it appears that the bioadmixture delays the hydration of the cement grains when it is incorporated at more than 1.5% at 28 days (Table 6). The differences observed (for the compressive strength, with a slight increase) at 120 and 180 days can be explained by a hardening of the cement related to the slower hydration of the cement particles when the bioadmixture rate exceeds 1.5%.
Porosity measurements
The total porosity available to water of the mortars is ranging from 13 to 15% (Table 7). These values are lower than those usually measured (16 to 24%) [15]. However, they remain in accordance with some results of the literature, where the porosity of such samples is ranging from 12 to 22% [16] or 14 to 22% [17]. The standard deviation between experimental values is very low, which validates the comparative procedure and allows to highlight the effect of the bioadmixture on this parameter. No influence of the curing time or the concentration of bioadmixture is noticed.
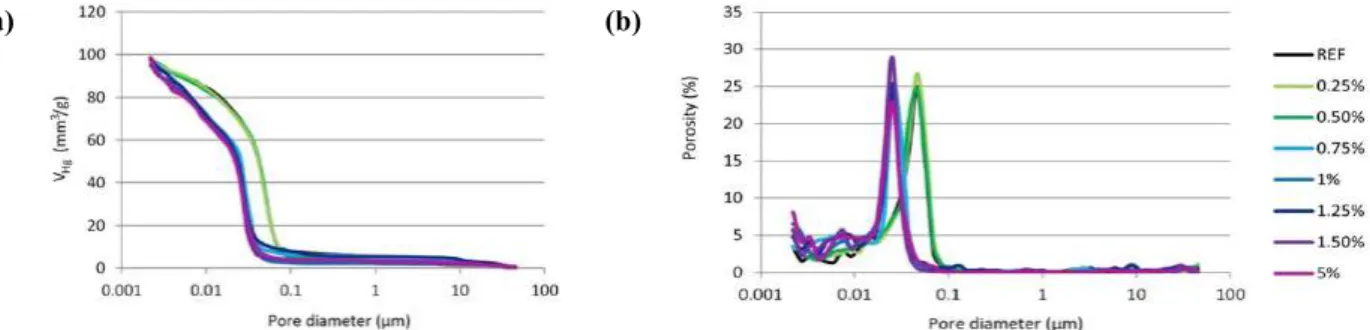
The total porosity available to water of the cement pastes is ranging from 33 to 37% (Table 7), which is in accordance with the current literature, where the porosity of such samples is generally ranging from 20 to 40% [18]. Again, no influence of the curing time or the concentration of bioadmixture is noticed. Thus, it is necessary to evaluate if the porosity available by another liquid (mercury) is influenced by the addition of the bioadmixture. The porosimetry with water or mercury does not provide the same values of available porosity because of the different characteristics of the fluids. A non-wetting liquid provides more information about the architecture of the porous network. The mercury injection porosimetry (MIP) allows to measure the dimensions of the orifices, i.e. the access thresholds, through which the fluid must pass to penetrate the material. The volume of mercury which has penetrated into the samples (the mercury access threshold) and the porosity (the ratio between the total volume of the explored pores on the volume of the sample) of the cement pastes (CEM I), according to the diameter of the porosity, are presented below (Figure 4).
Table 7 – Available water porosity (%) of Portland cement mortars and cement pastes (CEM I) according to the curing time.
Bioadmixture concentration (%)
Mortar Cement paste
Curing time (days)
28 120 180 28 120 0 14.2 ± 0.1 14.1 ± 0.1 14.0 ± 0.3 36.2 ± 0.1 34.8 ± 0.2 0.5 14.2 ± 0.3 14.2 ± 0.2 13.9 ± 0.1 36.3 ± 0.1 36.2 ± 0.1 1 14.3 ± 0.2 14.1 ± 0.1 13.9 ± 0.2 36.2 ± 0.1 36.0 ± 0.1 1.5 14.5 ± 0.1 14.1 ± 0.2 14.1 ± 0.3 36.3 ± 0.2 33.9 ± 0.3 2 14.4 ± 0.2 13.9 ± 0.1 13.9 ± 0.3 2.5 14.3 ± 0.1 14.1 ± 0.2 13.9 ± 0.1
For the volume of mercury per unit of mass of cement pastes (Figure 4a) and the distribution of the porosity (Figure 4b), the pattern of the curves remains similar, regardless of the
bioadmixture content. However, it is possible to identify two groups of samples. For low concentrations (0.25 and 0.5%), the distribution of the porosity according to the pore diameter are undistinguishable to the reference (without bioadmixture), and present a peak for a critical pore size (percolation threshold) of 0.045 µm (Figure 4b). In such concentrations, the bioadmixture does not seem to change the geometry of the porosity of the cement pastes. This result corresponds to capillary pores (0.01 < Ø (µm) < 1). A substantial part of the porosity, accessible via pore diameters lower than 3 nm is not filled by the mercury (Figure 4a).
(a) (b)
Figure 4 – Volume of mercury per unit of mass (a) and distribution of the porosity (b) of cement pastes (CEM I) according to the pore diameter.
For concentrations higher than 0.75%, the distribution of the porosity as a function of pore diameter remains identical, but the percolation threshold is equal to 0.025 µm (Figure 4b). The curves which represent the volume of mercury per unit of mass of cement pastes (Figure 4a) are offset from the first set of values, while following the same progression. At these concentrations, there is also small peaks, near 0.0075 µm (Figure 4b), representing gel pores (Ø < 0.01 µm), which may reflect an effect of the bioproduct on the capillary pores from a concentration of 0.75%. There are less capillary pores (0.01 < Ø (µm) < 1) and more gel pores inside samples containing higher concentrations of bioadmixture.
The capillary imbibition test provides additional information to evaluate the hydric transfer properties in cement pastes. The capillary absorption kinetic of the CEM I cement pastes is represented by the variation of the amount of water absorbed versus time, according to the curing time (Figure 5). The water absorption in samples is influenced by the bioadmixture because of a slow-down of the water absorption. Whatever the curing time, the bioadmixture incorporated inside cement pastes reduces the kinetic absorption. From the first 200 minutes, a linear relationship is established between the amount of the absorbed water and the time.
Figure 5 – Mass increase normalized by the imbibition area versus square root of time for the cement pastes after 28 (a) and 120 (b) days of curing time.
The weight change per imbibition area unit (∆W/S in g.cm–²) is divided into two sections as a function of time. From 0 to 200 minutes, there is saturation of the open porosity and the capillary absorption velocity is higher. After 200 minutes, the slope of the curves decreases, indicating
that the capillary pores are finer, i.e. the capillary absorption velocity is lower. This illustrates the filling of capillary pores with thinner diameters, until full saturation. Moreover, whatever the bioadmixture content and the curing time, the mass increase normalized by the imbibition area are constant after 1600 minutes.
For a bioadmixture content of 1.5%, the absorption coefficients decrease by about 50% after 28 or 120 days of curing time (Table 8). The bioadmixture modifies the geometry of the porosity so as to limit the capillary imbibition. Although the total porosity available to water is not changed by the bioadmixture, it appears that the decrease of the amount of capillary pores (0.01 < Ø (µm) < 1) influences the hydric penetration behaviour.
Table 8 – Absorption coefficients of the cement pastes (CEM I).
Curing time (days) Bioadmixture concentration (%) Absorption coefficient (g.cm–2.min–0,5) Curing time (days) Bioadmixture concentration (%) Absorption coefficient (g.cm–2.min–0,5) 28 0 0.152 ± 0.002 120 0 0.134 ± 0.006 0.25 0.132 ± 0.001 0.25 0.132 ± 0.002 0.5 0.105 ± 0.003 0.5 0.125 ± 0.002 1 0.108 ± 0.002 1 0.127 ± 0.003 1.5 0.071 ± 0.001 1.5 0.076 ± 0.001 The porosity measurements have shown that it is only at the nanoscale that a modification of the cement paste has been carried out with the bioadmixture from an incorporation of 0.75% of the cement mass. The macropores (1 – 40 µm) are not modified by the addition of the bioadmixture, but the gel pores (Ø < 0.01 µm) present two different behaviours depending on whether the cement pastes are formulated with low or high bioadmixture content, i.e. they are fewer at low concentrations. The nature of the physicochemical interactions between the bioadmixture and the hydrates differ according to the admixture content in the cement paste. This bioproduct is a surfactant, i.e. an amphipathic molecule having both a hydrophilic part and a hydrophobic part. In a polar medium such as water, the concentration of the surfactant could lead to micelles formation. The bioadmixture can self-aggregate in the bulk solution. In other words, adding a high bioadmixture content could lead to a saturation of the capillary pores (0.01 < Ø (µm) < 1) by micelles that are intruded inside pores. As a consequence, the number of gel pores increase. The formation of such aggregates depends on the properties and composition of the host liquid. The mode of action of the bioadmixture in pore fluid could be different that its mode of action in pure water, like before its incorporation as mass product in the cement paste formulation [19].
Capillary imbibition tests have shown that the bioadmixture decreases the imbibition velocity of the cement pastes whatever the curing time (Table 8). Thus, the bioadmixture could modify the porous network of the samples, because the diameters of the capillary pores are decreased, which influence the hydric behaviour of the cement pastes. The volume of the capillary pores will tend to decrease because of its filling by C-S-H gels and other hydrates. Thus, the connectivity between the capillaries is reduced and the progression of the water inside the porous network of the cement pastes is blocked.
Influence of the bioadmixture on the surface roughness of the cement pastes
The cement paste is an aggregate of particles having different composition and hydrated states with voids between the grains. As a consequence, the surface of the cement paste presents
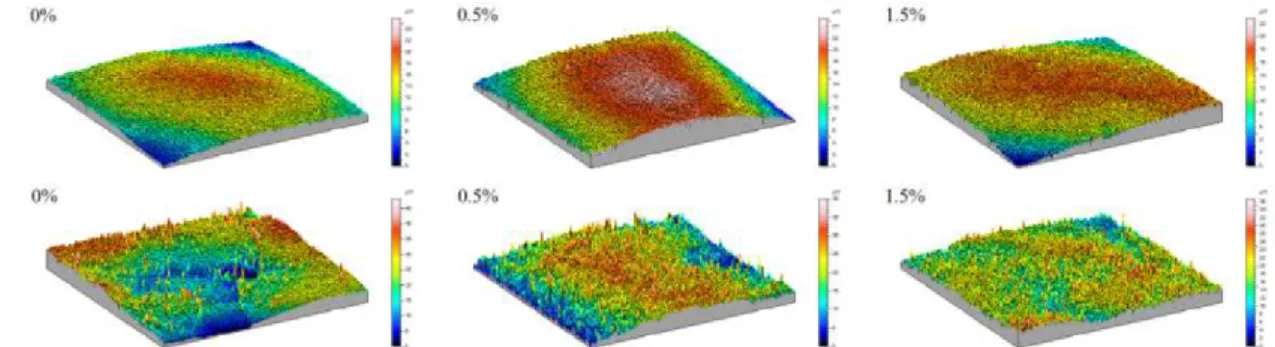
asperities and cavities, which constitute its roughness The topography of the samples is shown below (Figure 6). After 28 days of curing time, the topography of the surfaces is mainly influenced by the polishing operation, whereas at 120 days, all surfaces are much more heterogeneous. At 28 days, the surface topography is identical (Table 9), which is consistent with results regarding porosity: the macropores (1 – 40 µm) are not modified by the addition of the bioadmixture. This micron scale corresponds to that is accessible by the 3D measurement device (Ra ≃ 0.8 µm). There is no influence of the bioadmixture concentration on the surface topography at 28 days.
28 days
120 days
Figure 6 – Topography of the CEM I cement pastes according to the curing time.
After 120 days of curing, a decrease of the mean roughness is observed according to the bioadmixture content (Table 9). In spite of mean roughness standard deviations, due to the heterogeneity of the surfaces, the average Ra values change from 2 to about 1 µm.
Table 9 – Mean roughness values of the cement pastes (CEM I).
Curing time (days) Bioadmixture concentration (%) Ra (µm) Curing time (days) Bioadmixture concentration (%) Ra (µm) 28 0 0.90 ±0.25 120 0 1.72 ±0.36 0.25 0.80 ±0.05 0.25 1.38 ±0.17 0.5 0.80 ±0.09 0.5 1.35 ±0.15 1.5 0.80 ±0.04 1.5 1.14 ±0.06
Both curing time and interaction of the cement surface with water explain the observed differences at 28 and 120 days. The curing operation induces surface heterogeneity, associated with a development of crystals on the cement surface (Figure 7) coming from the hydration of the cement particles or from a calcium carbonate layer formed in water. The bioadmixture appears to inhibit the development and the formation of crystals on the surface of cement pastes, as the Ra values decrease for a given curing time, according to its concentration (Table 9).
Figure 7 – Observation of growing crystals on the surface of a cement paste (CEM I), after 120 days of curing in a conservation room (T = 23 ± 2°C, RH > 90%).
The roughness parameter is important but not sufficient to predict the biocolonization behaviour or the inhibition of the development of biofilms. Many surface parameters, such as surface energy, are also affected by the polishing operation endured by the samples after 28 days of curing, which amends the crystal surfaces (abrasion, splitting, etc.). Depending on the nature of the microorganisms present in the environment and their size, there is a synergy between this size and the roughness dimension, which control the bioreceptivity. That is why mastering the roughness parameter is a requirement for evaluating a potential biocolonization.
The bioadmixture seems inhibit the growth and the formation of crystals on the sample surfaces. Both this characteristic combine with the inhibition action of bacterial growth already demonstrated on stainless steel [20] with the same bioproduct, can potentially induce a limitation of the development of biofilms on admixtured surfaces. Another parameter impacting the biocolonization of cement surfaces is linked to its porosity, the cement paste acting as a water tank keeping favourable conditions for the development of microorganisms even in dry environment. The microbial colonization and the development of biofilms on cementitious surfaces can lead to the formation of stains (bioalteration) and/or to the failure of the structure (biodeterioration). The hostility of a biofilm depends both on the metabolic activity of the microorganisms that compose it and the penetration of biological compounds inside the porous network. Although Portland cement (CEM I) is only composed of mineral phases, the mixing water and the bioadmixture used to manufacture the cement pastes can contain organic matter that may furnish nutrients for the microorganisms. Furthermore, different bacteria secrete acid compounds that react with the cement matrix and induce the formation of expansive and/or soluble deterioration products [21]. The porosity of the cement pastes influences the colonization and the resistance of samples to biological colonization, so, decreasing the porosity like it was shown (Figure 4b) by increasing the bioadmixture content inside samples leads to a better resistance of the cement paste to this type of colonization. The studied lipopeptide biosurfactant derived from Pseudomonas fluorescens contains, among other, extracellular substances such as colloidal carbohydrates and proteins [22]. The exopolymers can clog the porous network and then limit the exchange with the outside. It is possible to limit the porosity of cementitious material or to limit the material biodeterioration by adding polymers in the fresh cement paste [23], [24]. The presence of polymers allows clogging the porosities and filling the cement matrix microcracks. These polymers do not protect concrete against acid attack of biological origin, but they improve the material cohesion and can delay erosion. The clogging of the porous network can also delay the penetration of aggressive compounds [25].
Conclusions
The bioproduct introduced an effect on the workability of fresh mortar samples with a plasticizing action, allowing to reduce by at least 5% the water supply, at constant slump, at a dosage level of 1.5% of bioadmixture. Furthermore, the bioadmixture can act positively to improve the mechanical strength of Portland cement mortars (beyond 120 days): an increase of the compressive strength was observed for the mortars containing 2 and 2.5% of bioadmixture (by weight of cement), in comparison with the unadmixtured samples. Whatever the curing time, a 1.5% bioadmixture content seems sufficient to reach similar resistances than samples without bioadmixture and consistent with the strength class (52.5) of the samples. Under the same curing conditions, no significant difference was observed for the flexural strength of mortars. Whatever its dosage level, the bioadmixture does not influence the porosity accessible to water of the mortars, according to the curing time.
Whatever its content, the bioadmixture does not influence the total porosity available to water of the cement pastes. In contrast, the mercury injection porosimetry (MIP) has revealed the existence of a threshold (between 0.5 and 0.75% of bioadmixture) from which the porous network of the cement pastes is changed. For the low admixtured samples, the pore radii are bigger, for a same volume of mercury by cement paste mass unit. For the upper concentrations than 0.75% of bioadmixture, the percolation threshold decreases to a radius of 0.025 µm. The structure of the porous network of the cement pastes, allowing the penetration of external agents (aggressive or not), is modified by the bioadmixture. Moreover, the open porosity is included in the surface roughness: the evolution of the surface roughness is also impacted by the bioadmixture. The study of the surface roughness of cement pastes has allowed to characterize the evolution of their surface states after different curing time. After 28 days of curing time, the surfaces exhibit a topography mainly influenced by the polishing operation carried out on abrasive paper. After 120 days, the surfaces are more heterogeneous. Both curing time and interactions of the cement surface with water explain these differences. The arithmetic average of the roughness profile (Ra) of the cement paste (CEM I) surfaces decreased. The curing procedure induces surface heterogeneity, with the development of crystals on surface originate from the hydration of the cement particles or a carbonate calcium layer from water. The bioadmixture appears to inhibit the development and the formation of the crystals on surfaces, because the Ra values decrease for a given curing time, according to its content. Capillary imbibition tests also reveal that the bioproduct influences hydric transfers within the porous network of the cement pastes, modifying the capillary pores as shown with the MIP results indicating that the diameter of the critical pore size decreases from 0.75% of bioadmixture content.
Acknowledgments
This work was financially supported by the French National Research Agency (ANR) under the framework of the SEPOLBE project.
References
1. H.-C. Flemming and J. Wingender, Nature Reviews Microbiology, 8 (2010) 623.
2. V. Shubina, L. Gaillet, S. Ababou-Girard, V. Gaudefroy, T. Chaussadent, F. Farças, T. Meylheuc, C. Dagbert, and J. Creus, Applied Surface Science, 351 (2015) 1174.
3. S. Lang, Current Opinion in Colloid & Interface Science, 7 (2002) 12.
4. T. H. Nielsen, D. Sørensen, C. Tobiasen, J. B. Andersen, C. Christophersen, M. Givskov, and J. Sørensen, Applied and Environmental Microbiology, 68 (2002) 3416.
5. J. Debode, K. D. Maeyer, M. Perneel, J. Pannecoucque, G. D. Backer, and M. Höfte, Journal of Applied Microbiology, 103 (2007) 1184.
6. J. M. Raaijmakers, I. de Bruijn, and M. J. D. de Kock, Molecular Plant-Microbe Interactions, 19 (2006) 699.
7. S. Joshi, C. Bharucha, and A. J. Desai, Bioresource Technology, 99 (2008) 4603.
8. A. Kretschmer, H. Bock, and F. Wagner, Applied and Environmental Microbiology, 44 (1982) 864.
9. E. C. Donaldson and H. L. Staub, SPE Annual Technical Conference and Exhibition, 4-7 October, San Antonio, Texas (1981).
10. V. Pruthi and S. S. Cameotra, Biotechnology Techniques, 11 (1997) 671.
11. M. Nitschke and S. G. V. A. O. Costa, Trends in Food Science & Technology, 18 (2007) 252.
13. T. Meylheuc, C. J. van Oss, and M. N. Bellon-Fontaine, Journal of Applied Microbiology, 91 (2001) 822.
14. S. Chandra and J. Björnström, Cement and Concrete Research, 32 (2002) 1613. 15. X. Chen, S. Wu, and J. Zhou, Construction and Building Materials, 40 (2013) 869.
16. Q. Zeng, K. Li, T. Fen-Chong, and P. Dangla, Construction and Building Materials, 28 (2012) 468.
17. S. Maria, Construction and Building Materials, 24 (2010) 2572.
18. P. Mehta and P. J. M. Monteiro, "Concrete: Microstructure, Properties, and Materials", 3rd ed., McGraw-Hill Education (2005).
19. F. Rajabipour, G. Sant, and J. Weiss, Cement and Concrete Research, 38 (2008) 606. 20. T. Meylheuc, C. Methivier, M. Renault, J.-M. Herry, C.-M. Pradier, and M. N. Bellon-Fontaine, Colloids and Surfaces B: Biointerfaces, 52 (2006) 128.
21. V. Zivica and A. Bajza, Construction and Building Materials, 15 (2001) 331.
22. S. U. Gerbersdorf, B. Westrich, and D. M. Paterson, Microbial Ecology, 58 (2009) 334. 23. J. Monteny, N. De Belie, E. Vincke, W. Verstraete, and L. Taerwe, Cement and Concrete Research, 31 (2001) 1359.
24. E. Vincke, E. V. Wanseele, J. Monteny, A. Beeldens, N. D. Belie, L. Taerwe, D. V. Gemert, and W. Verstraete, International Biodeterioration & Biodegradation, 49 (2002) 283.
25. B. Huang, H. Wu, X. Shu, and E. G. Burdette, Construction and Building Materials, 24 (2010) 818.