Does preschool boost the development of minority children?
The case of Roma children
Christina Felfe* and Martin Huber**
*University of St. Gallen, Dept. of Economics **University of Fribourg, Dept. of Economics
April 2016
Abstract:
Does universal preschool constitute an effective policy tool to promote the development and integration of children from minority groups? We address this question for the children of the Roma – the largest and most disadvantaged minority group in Europe. To tackle the issue of non-random selection into preschool, we exploit variation in the individual distance to the nearest preschool facility. Non-parametric instrumental variable estimations reveal significant short-term gains in terms of children’s literacy. Preschool attendance also increases the prevalence of vaccinations, but has no effect on other observed health outcomes. Overall, preschool also does not seem to enhance integration measured by children’s language proficiency or social-emotional development, at least not in the short-term.Key words: universal child care, child development, non-parametric instrumental variable estimation. JEL classification: C14, C21, C26, I10, I21, J13.
We have benefited from comments by Michael Lechner, seminar participants in Bludenz and three anonymous referees. We would like thank Sanja Janketic, Mladica Kotevska, Violeta Mija, Mirza Uzunovic and Suncica Vujc for providing us with their expert knowledge on the institutional background of the countries under study. Addresses for correspondence: Christina Felfe, University of St. Gallen, Varnb¨uelstrasse 14, 9000 St. Gallen, Switzerland, [email protected]; Martin Huber, University of Fribourg, Bd. de P´erolles 90, 1700 Fribourg, Switzerland, [email protected].
1
Introduction
Social, economic, and political exclusion remains an everyday challenge ethnic minorities face in modern societies. A key reason for the ‘vicious cycle of exclusion and poverty’ is the gap in educational achieve-ments caused by disadvantaged family backgrounds and residential segregation (Kahanec 2014). As a con-sequence, numerous policy experts suggest providing minorities with unlimited access to the education sys-tem of the host country, in particular to the early education syssys-tem. This paper uses recent cross-country data and a non-parametric instrumental variable approach to investigate whether or not participation in universal preschool helps to boost the development and the integration of children belonging to one of the largest and most disadvantaged minorities – the Roma (O’Higgins 2012).
The focus on early education is motivated by the findings of recent research demonstrating strong beneficial effects of preschool interventions targeted at children with special needs, such as those from disadvantaged backgrounds or minority groups.1 But whether a widely accessible or universal child care
program is appropriate for improving the development and integration of children from minority groups is an open question. Evidence from the growing body of research discussing the effects of universal preschool on children of the majority population may be misleading as the needs and reactions of children from minority groups may differ from those of children from the majority population.2 The evidence on the
impact of large-scale programs on children from minority groups, however, is rather scarce and limited to a few regional cases. In particular, there are a couple of studies that focus on the effects of Oklahoma’s universal pre-kindergarten program (targeting 4-year-old children). Using a regression-discontinuity design based on the fact that only children born before a specific cut-off date are entitled to the program, these studies find positive effects on the cognitive development of children from different ethnic groups (Gormley, Gayer, Phillips, and Dawson 2005, Gormley and Gayer 2008). Drange and Telle (2015) analyze the introduction of free preschool targeting 5-year-old children in Oslo (Norway) on later school performance of immigrant children. Employing a difference-in-difference strategy, they find beneficial effects for girls, but not for boys. Dustmann, Raute, and Schoenberg (2013) analyze the consequences of an expansion in preschool facilities in one administrative district (Weser-Ems Kreis) in Germany. Relying on regional variation in the expansion of preschool facilities and employing a linear instrumental variable strategy they find that public child care attendance reduces language and motor skill problems and improves overall school readiness for immigrant children.
Our paper focuses on Roma children across several European countries. The estimated number of the
1
See for instance the literature on Head Start – Currie and Thomas (1995) or Currie, Garces, and Thomas (2002) – or the Perry Preschool Program – Belfield, Nores, Barnett, and Schweinhart (2006) or Heckman, Moon, Pinto, Savelyev, and Yavitz (2009).
2See Apps, Mendolia, and Walker (2013); Baker, Gruber, and Milligan (2008); Berlinski, Galiani, and Gertler
(2009); Bernal and Keane (2009); Cascio (2009); Drange, Havnes, and Sandsor (2014); Felfe, Nollenberger, and Rodriguez-Planas (2012); Fitzpatrick (2008); ? and Magnuson, Ruhm, and Waldfogel (2007).
Roma population in Europe lies somewhere between ten and twelve million people (Br¨uggemann 2012). Integrating this minority group represents a serious challenge: about 90 % of Roma households live below national poverty lines, less than one third of people has paid employment, only 15 % of young Roma adults complete upper-secondary schooling and, even more worrisome, up to 37 % of Roma lack primary education and thus the basic skills in reading and mathematics (Br¨uggemann 2012).
Research and the design of appropriate integration policies are hampered by a severe lack of reliable data. To overcome this barrier the United Nations Development Programme (UNDP), the World Bank (WB), and the European Commission (EC) have joined forces to conduct the first cross-country survey on Roma – the so-called UNDP/WB/EC Regional Roma Survey. The survey contains basic socio-economic data on households as well as individual household members in twelve countries of central and southeast Europe. A specific module on early childhood provides information on children’s health, cognitive and non-cognitive development and participation in preschool. Hence, for the first time one can assess the effects of preschool attendance on the development and integration of Roma children.
Identification of the causal effects of preschool attendance on child outcomes is challenging. The decision to send a child to preschool is likely to be confounded with parental efforts to enhance their child’s development. In addition, preschools may select children based on information that is not readily observed by the econometrician. We tackle these issues as follows: The UNDP/WB/EC Regional Roma Survey contains detailed information on the neighborhood in which the household is located including the distance to the nearest preschool. The neighborhood is obviously an important determinant of children’s development and thus variation in preschool availability is unlikely to be exogenous. Variation conditional on neighborhood and household characteristics, however, is a more promising source of exogenous variation. Indeed, basically all correlations between preschool availability and family background turn insignificant and economically meaningless once we control for the full set of control variables. Our identification strategy therefore relies on the individual distance to the nearest preschool as an instrument for preschool attendance while controlling for features of the child, the household and the neighborhood as well as regional fixed effects. We implement this strategy using a fully non-parametric instrumental variable (IV) estimator, the inverse probability weighting (IPW) approach discussed in Fr¨olich (2007).
Our results reveal considerable returns to preschool attendance in terms of children’s literacy: when attending preschool, Roma children are 31.0 percentage points (ppts) more likely to know ten letters of the alphabet, 20.6 ppts more likely to write their own name and 42.4 ppts more likely to recognize the symbols for the numbers 1 to 10. They are also 20.7 ppt more likely to be vaccinated. There are, however, no short term gains in any other observed health outcomes. Evidence for improvements in integration measures, such as language proficiency and peer relations, is not robust.
This paper advances our understanding about the impact of universal preschool on minority children
in several dimensions. First, it focuses on a so-far understudied, but sizeable minority group – the Roma. Second, it investigates the effects of preschool not only on children’s cognitive development, but also on health and important integration measures. Such a broad focus is crucial if we want to understand whether universal preschool is indeed an effective integration policy. Third, our paper does not focus on a limited geographical region but rather on all of southeast Europe, the main region of residence of the Roma. While a cross-country analysis has to deal with a lot more heterogeneity in population and institutions, it allows for a more widely valid statement about the effectiveness of the policy under study. Finally, this research is the first study on the effectiveness of universal preschool that applies a non-parametric estimation method. In contrast to parametric methods, a non-parametric method can cope with non-linearities and effect heterogeneity. These issues are likely to be severe in the analysis of the effectiveness of universal preschool, not at the least because the treatment – preschool – and the counterfactual treatment – the alternative care mode – are likely to vary strongly in quality.
The remainder of the paper is structured as follows. The next section provides an overview of the preschool system in the countries under study. Section 3 introduces the data. Section 4 discusses the empirical framework with a focus on the underlying identification strategy. Section 5 presents our results and several robustness checks. Section 6 finally concludes and discusses the policy implications.
2
Background
This section provides an overview of the early child care systems in the countries under study as well as a discussion about the existing integration efforts involving the Roma population.3 The aim is to clarify what our treatment – preschool attendance – means and to what extent it is comparable across the countries under study.
Early child care covers children who are between 0 and 6 or 7 years old, the age when primary school becomes mandatory. It is usually provided in care centers run by either a public or a private entity. Such centers mostly operate separately for younger and older children – the age break is usually at 3; the care centers for younger children are called nurseries, those for older ones kindergarten or preschool. In what follows, we only refer to preschool. Due to data reasons we do not consider children younger than 3 in our analysis. Table 1 provides an overview of the preschool system in the countries under study.4
3All details about the early child care system are taken from Commission, EACEA, Eurydice, and Eurostat
(2009) and Commission, EACEA, Eurydice, and Eurostat (2014). In addition we draw on the knowledge from local experts, in particular experts working at the statistical offices of the countries under study, the Roma Education Fund and the Institute of Romani Culture in Albania.
4
Table 1 and the discussion in this section provide national averages. Despite regulation on the national level, there is obviously a lot of heterogeneity within countries. Most heterogeneity, however, arises upon implementation at the preschool level. As a result, heterogeneity is strongest between preschools in rural and urban areas.
Nowadays preschool is not only a place where children receive care, but it is an institution where children are taught the skills needed for primary school and life in society. For this reason, central governments issue official educational guidelines to help preschools meet this goal.5. Official objectives are to support children to develop personal, emotional, and social skills as well as language and communication skills. Moreover, preschools engage in physical and health education. In the year prior to primary school, preschools focus on fostering children’s literacy and numerical and logical reasoning, as well as adapting children to school life.
On average, preschools provide children with care for 30 or more hours a week allowing parents to work at least on a part-time basis. Most countries provide regulations regarding the group sizes and child-staff ratio: groups should comprise between 20 and 25 children, the exceptions are Croatia and Macedonia were groups contain between 14 and 23 children and 15 and 20 children, respectively; the child-staff ratio should range between 11 and 18 children per staff member. In practice, however, few child care centers comply with these guidelines.
To comply with the goals of European Union’s presidency in 2002 – ‘to provide child care by 2010 to at least 90% of children between 3 years old and the mandatory school age and at least 33 % of children under 3 years of age’ – many European countries have committed themselves to providing a preschool slot to all children. In particular, they either established a legal entitlement to a place in preschool or made attendance compulsory for some years prior to primary school entrance. By 2010/11, in Bosnia and Herzegovina, Hungary and Moldova children were legally entitled to a slot in preschool from age 3 onwards (in the case of Moldova from age 2 onwards). In the Czech Republic and Romania, there is a legal claim from age 5 onwards. In Bulgaria, Croatia, Hungary, Moldova and Serbia attendance is compulsory in the last year prior to primary school entrance; in Montenegro attendance is compulsory from age 3 onwards. Unfortunately, we lack information on expansion efforts in the countries under study, yet what we observe is that despite the legal commitments attendance rates are still low. In fact, Hungary is the only country reaching the target set by the EU presidency: in 2010/11 95 % of all 3- to 5-year-old children were attending preschool. Bulgaria, Czech Republic, Moldova and Romania are getting close: in all four countries more than 80 % of all 3- to 5-year-old children are attending preschool. In Bosnia and Herzegovina, Montenegro and Serbia attendance rates are still rather low – below 50 % – despite political efforts to stimulate attendance. In Macedonia only 1 in 5 children are attending preschool.
5Examples for the educational guidelines are the National Strategy for Preschool Education in Bosnia and
Herzegovina which was established in 2005 and postulates that preschools have the task to ensure optimal and equal conditions so that every child, from their birth to the start of schooling, develops and achieves all the intellectual and physical capabilities as well as competencies necessary for primary school and life in society (UNESCO 2006). Another example is the Preschool Education Act in Croatia which was established in 1997 and requires preschools to create conditions for the comprehensive and harmonious development of children’s personalities (UNESCO 2010). Similarly, Slovakia possesses a state educational program for pre-primary education which has the aim to attain the optimal perceptual, motor, cognitive and socio-emotional development as the basis for readiness for school education and life in society (UNESCO 2010)
Table 1: Institutional Background
Legal Compulsory Attendance Attendance Hours Group Child-Staff Entitlement Attendance Average Roma* Per Week Size Ratio
Albania - - 64% 34 % 30 22 1:18
BH Age 3 - 50% 12 % 30 20-23 1:14
Bulgaria - Age 5 87% 49 % 40 22
-Croatia - Age 5 71% 23 % 33 14-23
-Czech Republic Age 5 - 88% 38 % 30 24
-Hungary Age 3 Age 5 95% 78 % 35 25
-Macedonia - - 21% 26 % 40 15-20 1:11
Moldova Age 2 Age 5 80% 23 % 30 22.5 1:11
Montenegro - Age 3 40% 12 % 40 25 1:15
Romania Age 5 - 82% 41 % 25 20 1:17
Serbia - Age 5 48% 20 % 30 21.5 1:14
Slovakia - - 77% 31 % 34 20-22 1:21
Source: Commission, EACEA, Eurydice, and Eurostat (2009), Commission, EACEA, Eurydice, and Eurostat (2014) and Br¨uggemann (2012). In addition we draw on the knowledge from local experts, in particular experts working at the statistical offices of the countries under study, the Roma Education Fund and the Institute of Romani Culture in Albania.
*Numbers on the attendance rate of Roma children are based on the data used for this study (see Section 3 for details)
The integration of Roma children in the education system is a highly debated topic not only at the national level but also at the international level. In fact, there are several EU initiatives focusing on the education of Roma children in different countries. For example, there is the Roma Good Start Initiative (RGSI), a joint EU-UNICEF project whose objective is to promote early childhood development as an entry point for fostering the sustained social inclusion of Roma children in the Czech Republic, Hungary, Macedonia, Romania, Serbia and Spain. Another major initiative is the Roma Education Fund (REF), an organization operating in central and southeast Europe. The particular goal of the REF is to expand Roma children’s access to preschool education through such efforts as information campaigns, assisting with the registration process and conversations with parents. To reach this goal the REF supports national initiatives. One example for such a national initiative is the project Inclusion of Roma Children in Public Preschools in Macedonia. This project does not only aim to support the integration of Roma children by increasing the number of Roma children in preschools, it also seeks to improve the attitude of the Roma parents towards the local education system, improve the use of the Macedonian language and to increase the competence of educators to help overcome prejudices and stereotypes about the Roma in public preschools.
Despite these efforts integration of Roma children in the preschool system is far from being accom-plished. With the exception of Hungary and Bulgaria, where 77 % and 49 % of all 3- to 5-year-old Roma
children are attending preschool, respectively, attendance rates of Roma children lie well below 50 %. In Bosnia and Herzegovina and Montenegro only 1 out of 8 Roma children is attending preschool. Thus, while preschool is broadly understood as a policy tool to integrate Roma children into the education sys-tem and society, to reach full integration of Roma children into preschools, major efforts are still needed. Moreover, whether participation in preschool is indeed an effective policy tool to foster the development and the integration of Roma children is still an open question.
3
Data
The data underlying this study is the 2011 United Nations Development Programme, the World Bank, and the European Commission cross-country survey of the Roma - the so-called UNDP/WB/EC 2011 Regional Roma survey. It is the result of an important effort to produce a socio-economic profile of large Roma populations throughout Europe and is based on samples of Roma living in Roma settlements or areas of compact Roma populations (areas where the share of Roma people is at least as large as the share of Roma in the national census). The samples represent about 85 % of the Roma population in the following twelve central and southeast European countries: Albania, Bosnia and Herzegovina, Bulgaria, Croatia, Czech Republic, Hungary, Macedonia, Montenegro, Republic of Moldova, Romania, Serbia, and Slovakia.
The survey was conducted in a three-stage random representative sampling process: first, in each country 110 random clusters of approximately 30 households from areas of compact Roma populations were selected; second, in each cluster, 7 households were randomly chosen and the respective head of the household answered questions about the household; third, one random household member older than 15 years was selected to answer a battery of questions on status and attitudes. In addition, the primary caregiver of all children below school age answered questions of a special module on early childhood education and care (ECEC). In each country, the survey interviewed about 750 Roma households as well as 350 non-Roma households in close proximity to the Roma households.
We restrict our sample to the Roma population only: to children at preschool age (3-6 years old) and to households which have not moved during the previous 5 years (which is the case for more than 95%). This restriction guarantees that the children under study have at least some time and chance to attend preschool in the location of residence. Furthermore, we drop all observations lacking information on the outcome variables provided by the ECEC module (a series of questions describing children’s literacy, language proficiency, self-confidence and peer relations). Given these restrictions, our baseline sample contains 3,334 Roma children at preschool age (4.5 years old on average). Information on children’s health is contained in the main survey and thus is provided by the household head who is likely to be less
informed about children’s development than the primary caregiver, who answers the questions contained in the ECEC module. As a results, our sample shrinks when analyzing health-related outcomes (2,478 observations).
For descriptive comparisons we also draw upon 569 non-Roma children who live in close vicinity to the Roma households under study. These non-Roma children are exposed to similar regional conditions. As such, any differences between the Roma children and the non-Roma children included in this sample should not result from the fact that Roma often live in regions that are most affected by poverty and unemployment.6 Table 2 provides descriptive statistics of the key variables for non-Roma and Roma
children, as well as for Roma children with and without preschool exposure.
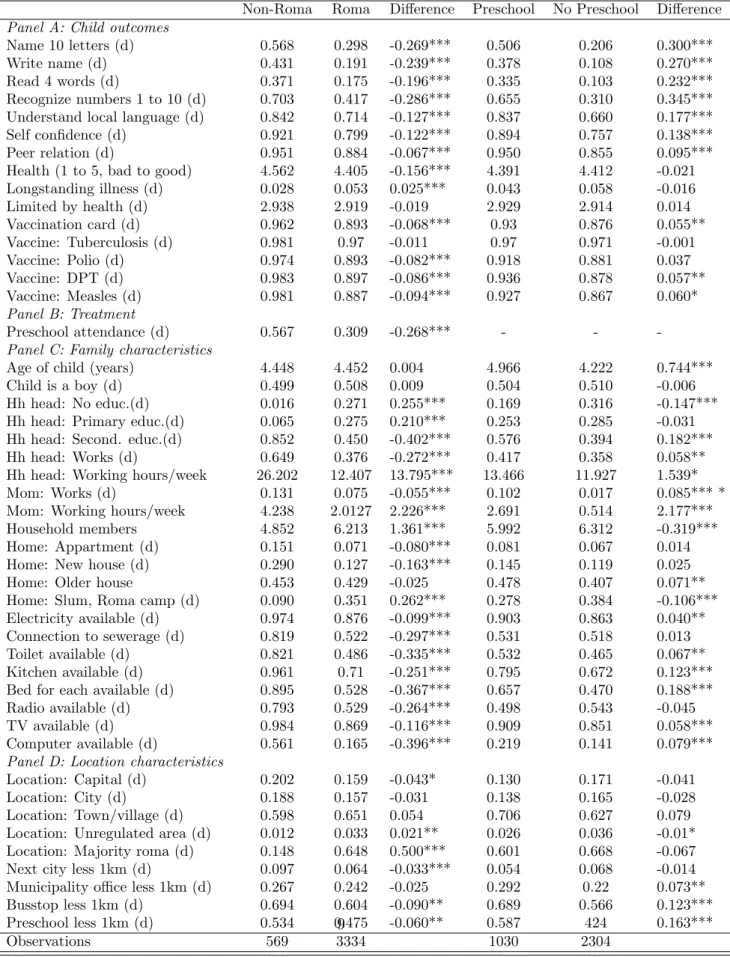
There are significant (at least at the 5 % significance level) differences between Roma and non-Roma children in terms of literacy, proficiency in the local language, social-emotional development and health (see Table 2, Panel A). It is important to point out that these differences exist despite controlling for any difference that may arise due to the fact that Roma children are likely to live in a disadvantaged area. Roma children are less likely to name 10 letters from the alphabet (29.8 % versus 56.8 %), to write their own name (19.1 % versus 43.1 %), to read 4 popular words (17.5 % versus 37.1 %) or to recognize numbers between 1 and 10 (41.7 % versus 70.3 %). Roma children also lag behind in terms of their knowledge of the regional language (71.4 % versus 84.2 %). Furthermore, Roma children have less self-confidence (79.9 % versus 92.1 %) and are less integrated among their peers (88.4 % versus 95.1 %). Finally, Roma children are in slightly worse health, suffer more often from longstanding illnesses (5.3 % versus 2.8 %), and are less likely to be vaccinated (89.3 % versus 96.2 %).
Yet, there are also significant differences in terms of family background between Roma children and non-Roma children living in the same area (see Table 2, Panel C). For instance, the household head of the Roma households, who is most likely the father, possesses less education than the household head of a non-Roma household: 45.0 % of all Roma fathers have secondary education while 85.2 % of all non-Roma fathers do so. In a similar vein, there are differences in terms of labor force participation: while 64.9 % (13.1 %) of all fathers (mothers) of Non-Roma households are working, only 37.6 % (7.5 %) of all fathers (mothers) of Roma households are working.
Roma households are also larger than non-Roma ones: Roma households consist on average of 6.2 members, while non-Roma households consist only of 4.9 members. Roma children live on average in worse conditions than non-Roma children: a considerable share of non-Roma children live in either apartments (15.1 %) or newer houses (29.0 %), while many Roma children live in ghettos or slums (35.1 %). Moreover, Roma households are on average worse equipped than non-Roma households: Roma households have less
6
In fact, comparisons of key economic indicators, such as the employment rate, the unemployment rate or the high school dropout rate, reveal that both, the Roma and the non-Roma population included in the sample, fare much worse than the average population in the countries under study (Br¨uggemann 2012).
Table 2: Descriptive Statistics on Key Variables
Non-Roma Roma Difference Preschool No Preschool Difference Panel A: Child outcomes
Name 10 letters (d) 0.568 0.298 -0.269*** 0.506 0.206 0.300***
Write name (d) 0.431 0.191 -0.239*** 0.378 0.108 0.270***
Read 4 words (d) 0.371 0.175 -0.196*** 0.335 0.103 0.232***
Recognize numbers 1 to 10 (d) 0.703 0.417 -0.286*** 0.655 0.310 0.345*** Understand local language (d) 0.842 0.714 -0.127*** 0.837 0.660 0.177*** Self confidence (d) 0.921 0.799 -0.122*** 0.894 0.757 0.138***
Peer relation (d) 0.951 0.884 -0.067*** 0.950 0.855 0.095***
Health (1 to 5, bad to good) 4.562 4.405 -0.156*** 4.391 4.412 -0.021 Longstanding illness (d) 0.028 0.053 0.025*** 0.043 0.058 -0.016 Limited by health (d) 2.938 2.919 -0.019 2.929 2.914 0.014 Vaccination card (d) 0.962 0.893 -0.068*** 0.93 0.876 0.055** Vaccine: Tuberculosis (d) 0.981 0.97 -0.011 0.97 0.971 -0.001 Vaccine: Polio (d) 0.974 0.893 -0.082*** 0.918 0.881 0.037 Vaccine: DPT (d) 0.983 0.897 -0.086*** 0.936 0.878 0.057** Vaccine: Measles (d) 0.981 0.887 -0.094*** 0.927 0.867 0.060* Panel B: Treatment Preschool attendance (d) 0.567 0.309 -0.268*** - -
-Panel C: Family characteristics
Age of child (years) 4.448 4.452 0.004 4.966 4.222 0.744***
Child is a boy (d) 0.499 0.508 0.009 0.504 0.510 -0.006
Hh head: No educ.(d) 0.016 0.271 0.255*** 0.169 0.316 -0.147*** Hh head: Primary educ.(d) 0.065 0.275 0.210*** 0.253 0.285 -0.031 Hh head: Second. educ.(d) 0.852 0.450 -0.402*** 0.576 0.394 0.182***
Hh head: Works (d) 0.649 0.376 -0.272*** 0.417 0.358 0.058**
Hh head: Working hours/week 26.202 12.407 13.795*** 13.466 11.927 1.539*
Mom: Works (d) 0.131 0.075 -0.055*** 0.102 0.017 0.085*** *
Mom: Working hours/week 4.238 2.0127 2.226*** 2.691 0.514 2.177***
Household members 4.852 6.213 1.361*** 5.992 6.312 -0.319***
Home: Appartment (d) 0.151 0.071 -0.080*** 0.081 0.067 0.014
Home: New house (d) 0.290 0.127 -0.163*** 0.145 0.119 0.025
Home: Older house 0.453 0.429 -0.025 0.478 0.407 0.071**
Home: Slum, Roma camp (d) 0.090 0.351 0.262*** 0.278 0.384 -0.106*** Electricity available (d) 0.974 0.876 -0.099*** 0.903 0.863 0.040** Connection to sewerage (d) 0.819 0.522 -0.297*** 0.531 0.518 0.013 Toilet available (d) 0.821 0.486 -0.335*** 0.532 0.465 0.067** Kitchen available (d) 0.961 0.71 -0.251*** 0.795 0.672 0.123*** Bed for each available (d) 0.895 0.528 -0.367*** 0.657 0.470 0.188*** Radio available (d) 0.793 0.529 -0.264*** 0.498 0.543 -0.045
TV available (d) 0.984 0.869 -0.116*** 0.909 0.851 0.058***
Computer available (d) 0.561 0.165 -0.396*** 0.219 0.141 0.079*** Panel D: Location characteristics
Location: Capital (d) 0.202 0.159 -0.043* 0.130 0.171 -0.041
Location: City (d) 0.188 0.157 -0.031 0.138 0.165 -0.028
Location: Town/village (d) 0.598 0.651 0.054 0.706 0.627 0.079 Location: Unregulated area (d) 0.012 0.033 0.021** 0.026 0.036 -0.01* Location: Majority roma (d) 0.148 0.648 0.500*** 0.601 0.668 -0.067 Next city less 1km (d) 0.097 0.064 -0.033*** 0.054 0.068 -0.014 Municipality office less 1km (d) 0.267 0.242 -0.025 0.292 0.22 0.073** Busstop less 1km (d) 0.694 0.604 -0.090** 0.689 0.566 0.123*** Preschool less 1km (d) 0.534 0.475 -0.060** 0.587 424 0.163***
Observations 569 3334 1030 2304
Notes: ‘Non-Roma’ is the average for all non-Roma children, ‘Roma’ corresponds to the Roma sample average, ‘Preschool’ refers to all Roma children with preschool exposure, and ‘No Preschool’ refers to all Roma children with no preschool exposure. ‘Diff. Roma’ is the difference between ‘Roma’ and ‘Non-Roma’, ‘Diff. Preschool’ is the difference between ‘Preschool’ and ‘No Preschool’. Results of a hypothesis test of no difference between the respective means when clustering at the region level are indicated as follows: *** p > 0.01, ** p > 0.05, * p > 0.1. All variables which are dummy variables are indicated by (d). Source: UNDP/WB/EC Regional Roma Survey, own calculations.
access to electricity than non-Roma households (87.6 % versus 97.4 %), to sewerage (52.2 % versus 81.9 %), to a toilet (48.6 % versus 82.1 %), to a a kitchen (71.0 % versus 96.1 %), to a bed for each household member (52.8 % versus 89.5 %) to a radio (52.9 % versus 79.3 %), to a TV (86.9 % versus 98.4 %) or a computer (16.5 % versus 56.1 %). Finally, the descriptive statistics reveal that even within the areas selected for the survey (areas of high Roma concentration) there is residential segregation (see Panel D, Table 2): Roma children are more likely to live in a location characterized by a Roma majority (64.8 % versus 14.8 %), slightly further away from the next city center (6.4 % of the Roma households live less than 1 km away from the next city centers versus 9.7 % of the non-Roma households), slightly less connected to public transportation (60.4 % of the Roma live less than 1 km away from the next bus stop versus 69.4 % of the non-Roma) and finally slightly farther from a preschool (47.5 % of the Roma live less than 1 km away from the next preschool versus 53.4 % of the non-Roma). The difference in availability of a preschool in close vicinity translates also into preschool attendance: among the Roma children, only 30.9 % are attending preschool, while among the non-Roma children 56.7 % are attending preschools (see Panel B, Table 2).
Does preschool attendance correlate with better development outcomes? The development gap between Roma children with and without exposure to preschool is substantial: Roma children attending preschool outperform the Roma children not attending preschool in terms of their knowledge of the local language (83.7 % versus 66.0 %), further literacy skills (the gap amounts to 30.0 ppts when naming 10 letters, to 27.0 ppts when writing down a name, to 23.2 ppts when being able to read 4 words, and to 34.5 ppts when being able to identify the symbols for the numbers 1 to 10). Roma children attending preschool also possess more self-confidence (89.4 % versus 75.7 %) and get along better with their peers (95.0 % versus 85.5 %). Moreover, Roma children who attend preschool are also more likely to be vaccinated than those who do not (87.0 % versus 81.5 %). However, it would be premature to conclude that preschool helps to closes the gap between Roma and non-Roma children. Besides the described differences in children’s development, we also observe that attendance to preschool is correlated with families’ socio-economic background. In fact, Roma children who attend preschool resemble non-Roma children much more than Roma children who do not attend preschool. For instance, the household head is more likely to possess secondary education (57.6 % versus 39.4 %); they live in smaller families (6.0 versus 6.3 household members); their households are better equipped in terms of electricity, toilets, kitchen, beds, etc. (4.0 ppts, 6.7 ppts, 12.3 ppts and 18.8 ppts, respectively); they are more likely to live in an area which is well connected to public transportation (68.9 % versus 56.6 %) or to preschools (58.7 % versus 42.4%). In other words, the socio-economic family background and the neighborhood are on average more favorable for Roma children who attend preschool. Hence, a simple comparison between Roma children with and without exposure to preschool is likely to overestimate the impact of preschool attendance on children’s development. The next section therefore discusses how we tackle the issue of endogenous selection into preschool.
4
Empirical Framework
This section discusses the causal effect of preschool attendance on children’s development we aim for, the assumptions underlying our identification strategy, and the estimation method.
4.1
Main Effect and Potential Channels
The causal effect of preschool attendance – the treatment under study – on the development of a child is the (hypothetical) difference between the child’s development when attending and not attending preschool. The overview provided in Section 2 made clear that there is substantial heterogeneity in preschools across, but also within, the countries under study. In addition there is likely to be substantial heterogeneity in the counterfactual treatment, the type of care provided to children when not attending preschool. While it is impossible to provide an estimate for all possible combinations of treatment and counterfactual treatments, our study draws upon a non-parametric estimation method which allows for effect heterogeneity (see Section 4.3 for details).
There are different mechanisms at play which shape the final direction and magnitude of the effect of attending preschool on child outcomes. First, children attending preschool are exposed to a preschool teacher. There is a broad literature on the impact of teacher quality on children’s development which pos-tulates a positive influence of teachers on children’s development, at least when fulfilling certain quality standards (see for instance Hanushek (2011)). Roma children may be particularly likely to benefit from exposure to a teacher as that may help boost their host-country-specific human capital such as the knowl-edge of the local language and culture.
Second, children attending preschool are spending quite some time with their peers. Peers have a non-negligible impact on children’s development, in particular on children’s cognitive development (Neidell and Waldfogel 2010). Such peer effects may be particularly relevant in the case of Roma children as they are likely to benefit from contacts with non-Roma children, especially in terms of language skills.
Third, there may be also an indirect effect through the crowding out of the alternative care mode (see Datta-Gupta and Simonsen (2010); Felfe, Nollenberger, and Rodriguez-Planas (2012); or Felfe and Lalive (2014) for a discussion). The direction and the magnitude of the crowding-out effect depends on the quality of the alternative care. In our context the counterfactual care mode is mostly the mother or the extended family. While it is impossible to judge the relative quality of the care provided by the preschool in comparison to the care provided by the mother, in the case of Roma children it is likely that the preschool enhances children’s host-country-specific skills more than the mother (through contact with the staff and the peers). In terms of social-emotional development, developmental psychology, in particular
the so-called attachment theory (Bowlby 1969), stresses the importance of a clear psychological parent for the development of social-emotional skills. As such the reduction of the time spent with the mother may have a negative impact on children’s social-emotional skills.
Fourth, preschool may free mothers from their child care duties and thus allow them to engage in paid work (see Felfe (2015) for an overview of the impact of preschools on maternal employment). As such preschool may contribute to the household income which in turn is likely to have a positive impact on children’s development (see Dahl and Lochner (2012) or Gonzalez (2013) for the impact of income on children’s development).
Finally, parents may adjust their parenting style when being in contact with preschool teachers and other parents (Felfe and Lalive 2012, Hsin and Felfe 2014). This effect may go either way: on the one hand, contact to pedagogical staff or other parents may inspire parents in their parenting methods; on the other hand parents may outsource child care and thus invest less in their children.
In this paper, we focus on estimating the overall impact of preschool. We analyze a variety of different outcomes, which may hint towards potential underlying causal channels. Disentangling the mechanisms, however, lies beyond the scope of this paper.
4.2
Identification
Identification of the causal effects of preschool attendance on child outcomes is challenging. Sending a child to preschool is likely to be confounded with parents’ efforts to promote their child’s development. In the case of Roma families, the decision to register a child in preschool may furthermore reflect parents’ integration efforts as well as their knowledge and opinion about the country’s institutions. In addition, preschools may select children depending on their development and their family or ethnic background (even if officially, they are prohibited from doing so by law). The non-random selection into preschools is in fact reflected by the unconditional mean differences in important family background characteristics, such as the household head’s education or the households’ equipment and infrastructure (see Table 2).
One way to tackle the non-random selection is to estimate the differences in child development outcomes conditional on a set of determinants of children’s development and children’s preschool attendance. The literature on the production of children’s human capital has highlighted the importance of children’s family background, in particular the socio-economic standing of the family, and the social environment (Cunha, Heckman, Lochner, and Masterov 2006). Thus, controlling for variables such as parental education, household wealth, housing conditions, and neighborhood features is crucial in a selection-on-observables approach. Nevertheless, the criteria underlying both decision processes – the decision of parents and the decision of preschools – is unlikely to be all measurable or observable.
Hence, a comparison of children enrolled and children not enrolled in preschool even conditional on a comprehensive set of control variables may result in biased estimates of the impact of preschool attendance on child development.
We therefore compare the estimates based on a selection-on-observables approach with the estimates resulting from an instrumental variable (IV) approach. We use the distance from a child’s home to the closest preschool facility as an IV. To be more precise, we rely on the information provided by the interviewer on whether the nearest preschool facility is less than 1 kilometer away and thus walking distance from the respective household. Seminal studies introducing distance-based instruments are the studies assessing the returns to college, such as Card (1995) and Kane and Rouse (1995). Distance is a widely used instrument to analyze, for instance, the effect of informal child care on female labor supply, e.g. Compton and Pollak (2014) and Dimova and Wolff (2011), or the impact of online learning versus face-to-face courses on student performance, e.g. Bettinger, Fox, Loeb, and Taylor (2015) and Xu and Jaggars (2013).
An IV must satisfy particular relevance and validity conditions, at least conditional on a range of observed characteristics. A formal definition of the non-parametric IV assumptions our estimates rely on is given in Abadie (2003), while we subsequently focus on their intuition in the context of our application. IV relevance requires the first stage of the instrument to be non-zero. That is, there must be some ‘compliers’ among the Roma children in the sense that these children would attend preschool if living close by, but would not do so if living further away. In other words, the distance to preschool must shift the decision of at least some parents to register their children in preschool. Availability of a preschool may shape parental awareness of the possibility to enroll their child into preschool and thus increase the likelihood of doing so. In addition, living closer to a facility reduces the costs of attending preschool, at least in terms of transportation costs. In Section 5.1 we provide empirical evidence based on our sample that living closer to a preschool facility indeed (statistically significantly) raises the likelihood of enrolling a child in preschool.7
IV validity rules out a direct effect of the mere distance to preschool on child outcomes (other than through preschool attendance). It also implies that there is no correlation between the distance to preschool and any unobservable determinants of preschool attendance and/or child outcomes, at least not when including the set of control variables. While the absence of an association between the mere distance to preschool and child outcomes seems plausible, it is likely there is an association between the distance to
7At the same time, there should be no ‘defiers’, e.g. there should be no children who do not attend preschool if
living close by but who would do so if living further away. Note that parametric IV models impose a homogeneous (or constant) first stage coefficient on the instrument and thus implicitly rule out defiers. This assumption appears plausible in our application as it is hard to think of a reason that could induce parents who would send their child to a distant preschool facility to take him or her out of preschool altogether once a facility opened up in their vicinity.
preschool and some determinants of preschool attendance and/or child outcomes. We therefore devote the remainder of this section to a discussion of whether the distance to preschool may serve as a valid instrument once conditioning on an appropriate set of control variables. Notice that the choice of control variables is again motivated by the literature on the child development production function (Cunha, Heckman, Lochner, and Masterov 2006). As such we control for available proxies for the household’s socio-economic status, such as the education level of the household head, proxies for the household’s wealth (the type of the home, available infrastructure or appliances), as well as available proxies for the neighborhood, such as the share of Roma people, the distance to the next city, the municipality office or public transport. In addition, we control for regional fixed effects.8
What are the threats to validity of the distance to preschool as an instrument to preschool attendance? First, parents may choose their location of residence based on the availability of preschool facilities among other amenities offered by the neighborhood. Second, local citizens may actively lobby for the supply of preschools together with other social policies. Third, the availability of a preschool might be the result of an active policy of local politicians to attract workers. We address in turn each of these threats and provide some empirical evidence to show how our set of controls renders possible correlations between the availability of preschools and the determinants of children’s development not only insignificant, but also economically meaningless (see Table 3).
Regarding the first concern, the question is whether Roma families indeed (consciously) settle down in a place that is close to a preschool (or to other amenities that correlate with education). According to Vlase and Preoteasa (2012), the main driver behind migration of Roma people is employment opportunities; the attractiveness of the education system as a whole and thus of the preschool system in particular appears to play a negligible role. In addition, the Roma families included in our sample are (contrary to what the clich´e suggests) rather immobile: only 4.6 % of Roma families had moved into their residence at sampling date within the previous 5 years, while the vast majority had lived in the same area for at least 5 years. We exclude the few Roma families that moved during the previous 5 years to guarantee that the Roma children live for a sufficiently long time at the current location.9 Despite the recent immobility,
8
As described in Section 3, our sample is spread over twelve countries, between 3 and 4 regions per country (40 regions all together) and up to 113 local clusters per region. As described in Section 2, the preschool system is regulated on a centralized level. Most heterogeneity in how the regulations are actually implemented appears between urban, peripheral and rural areas. Controlling for regional fixed effects as well as the size or character of the location (i.e. capital, city, town, village or unregulated area) should thus capture most heterogeneity between existing preschools. The exact regions are displayed in Table A.1 in the appendix. On average, there are 156 children per region in our sample. An alternative unit upon which we could define the fixed effects are the local clusters. Notice, however, that the local clusters do not correspond to any administrative unit, but to a unit of 30 households out of which 7 are interviewed in our sample – the median number of children included in a local cluster in our sample is 5. As such, the local cluster is not only meaningless in terms of administrative power, but also too small in terms of geographical size and number of observations.
9Our set of control variables should help mitigate potential selection bias introduced by dropping the small
Table 3: Balancing Tests
Unconditional Conditional on Conditional on Regional Dummies Full Set of Controls Panel A: Family characteristics - Roma
Hh head: No education (d) -0.051*** (0.019) -0.014 (0.020) 0.124 (0.177) Hh head: Prim. Education (d) -0.032 (0.019) -0.018 (0.019) 0.102 (0.177) Hh head: Second. Education (d) 0.063*** (0.017) 0.029 (0.018) 0.111 (0.176) Hh members (d) -0.012*** (0.004) -0.004 (0.003) -0.004 (0.003) Home: Appartment (d) 0.130*** (0.034) 0.101*** (0.035) -0.004 (0.055) Home: New house (d) 0.016 (0.026) 0.039 (0.025) -0.017 (0.051) Home: Older house (d) 0.036** (0.018) 0.036** (0.017) -0.021 (0.048) Home: Slum, ghetto (d) -0.081*** (0.018) -0.077*** (0.018) -0.042 (0.049)
Electricity (d) 0.022 (0.025) 0.012 (0.024) -0.021 (0.022)
Sewerage (d) 0.076*** (0.018) 0.043** (0.019) 0.007 (0.017)
Toilet (d) 0.051*** (0.018) -0.010 (0.017) -0.009 (0.021)
Kitchen (d) 0.067*** (0.019) 0.053*** (0.019) 0.035 (0.028)
Bed for each (d) 0.093*** (0.017) 0.065*** (0.017) 0.028 (0.026)
Radio (d) -0.102*** (0.017) 0.008 (0.018) -0.005 (0.016)
TV (d) 0.078*** (0.025) 0.060** (0.026) 0.017 (0.023)
Computer (d) 0.105*** (0.023) 0.096*** (0.022) 0.038 (0.025)
Panel B: Location characteristics - Roma
Location: Capital (d) 0.132*** (0.038) -0.056** (0.024) 0.000 (0.016) Location: City (d) 0.111*** (0.024) 0.119*** (0.026) -0.037 (0.039) Location: Town/village (d) -0.113*** (0.021) 0.000 (0.018) -0.004 (0.042) Location: Unregulated area (d) -0.227*** (0.048) -0.084* (0.048) -0.050 (0.048) Distance to next city 0.301*** (0.035) 0.029 (0.035) 0.027 (0.033) Distance to municipality office (d) 0.484*** (0.018) 0.459*** (0.019) 0.304*** (0.019) Distance to bus stop (d) 0.515*** (0.015) 0.497*** (0.016) 0.408*** (0.016)
Roma majority -0.082*** (0.018) 0.010 (0.020) -0.002 (0.017)
Panel C: Integration & employment - Roma
Local language (d) 0.043** (0.019) -0.003 (0.023) -0.017 (0.019)
Hh head: Works (d) 0.021 (0.018) 0.018 (0.017) 0.002 (0.015)
Hh head: Work hours 0.000 (0.001) 0.000 (0.000) -0.000 (0.000)
Mom: Works (d) -0.002 (0.033) -0.003 (0.031) -0.002 (0.026)
Mom: Work hours (d) -0.001 (0.001) -0.001 (0.001) -0.001 (0.001) Panel D: Employment outcomes - Non-Roma
Hh head: Works (d) -0.014 (0.040) -0.024 (0.042) -0.013 (0.039) Hh head: Work hours -0.000 (0.001) -0.001 (0.001) -0.001 (0.001)
Mom: Works (d) 0.023 (0.062) 0.029 (0.063) -0.005 (0.056)
Mom: Work hours (d) -0.001 (0.002) -0.001 (0.002) -0.001 (0.001)
Notes: Column ‘Unconditional’ displays the unconditional correlation between the instrument – closest preschool is less than 1 km away – and the variables shown in the first column. Column ‘Conditional on Regional Dummies’ displays the respective correlation resultings from a linear regression when controlling for regional dummies. Column ‘Conditional on Full Set of Controls’ displays the respective correlation resulting from a linear regression when controlling for the full set of controls – shown in Table 2 except the respective variable. Standard errors are shown in parentheses. Significance of the correlations are indicated as follows: *** p > 0.01, ** p > 0.05, * p > 0.1. All variables which are dummy variables are indicated by (d). Source: UNDP/WB/EC Regional Roma Survey, own calculations.
one may nevertheless argue that migration/residence decisions that occurred more than 5 years ago could have been endogenous to preschool availability. As argued in Card (1995) (but in the context of college education), family background characteristics may play an important role. We argue that conditioning on our set of control variables tackles this issue. Balancing tests, shown in Table 3, support this claim. The unconditional correlations between the distance to the nearest preschool and a series of socio-economic characteristics of the family are substantial (see first column in Table 3, Panel A): in particular, we observe a significant correlation between the distance to the nearest preschool and the education of the household head, household size, the type of the home, the available infrastructure and a series of indicators of household wealth. Conditioning on the set of regional dummies reduces the correlations substantially and renders several of the correlations – in particular the correlation with the education of the household head – insignificant. Conditioning on the full set of control variables leads to a complete loss of magnitude and significance of the correlations between the distance to the nearest preschool and the family’s socio-economic background. Note that this is also true for a measure of the integration efforts of the family: the use of the local language in the family (see Table 3, Panel C). Importantly, the correlation between the distance to the nearest preschool and Roma parents’ labor supply is also insignificant and economically meaningless (see Table 3, Panel C). In fact, this is also true for the correlation between the distance to the nearest preschool and non-Roma parents’ labor supply (see Table 3, Panel D). This is important evidence that even if preschools may belong to a policy package to attract qualified workers (an issue we discuss more below), this policy does not seem to be really effective.10
Regarding the second concern, while it is unlikely that Roma families engage in lobbying activities, it may be the case that lobbying activities for certain social policies, such as policies targeting the integration of minorities and policies aiming at expanding the preschool system, do correlate. We argue that controlling for the set of regional dummies helps resolve this issue: even if attitudes or preferences for child care were selective, they are unlikely to change rapidly over time. Hence, controlling for regional fixed effects should capture such unmeasured preferences and local actions. As we can see in Table 3 Panel B, there are substantial correlations between the neighborhood conditions and the distance to the nearest preschool. As we can see in column two of Table 3 within regions most of the correlations are economically meaningless and insignificant. The exception is the distance to the municipality office and the busstop. Nevertheless, these correlations are basically a reflection of the location of preschools which are rather central and connected to public transport.
Regarding the third concern – whether preschools are a policy to attract workers and thus implicitly induce the settlement of Roma – the question is what are the type of workers local politicians want to attract. The Roma are by far less educated than the national average – in fact, only 15 % of Roma adults
10
Note, that there is also no effect on Roma parents’ labor supply when using our IV method. Results are available upon request.
complete upper-secondary schooling and 37 % of Roma lack primary education (Br¨uggemann 2012) – and exhibit much higher unemployment rates than the national average – less than one third works in paid employment. Therefore, it is unlikely that Roma people are the target of local policies to attract young workers. Empirical evidence confirms this claim: the correlations between the availability of preschools and labor force participation of members of the Roma households are all economically meaningless and insignificant. Importantly, the same is true for members of non-Roma households providing evidence that preschools do not act as an effective policy to attract qualified workers.11
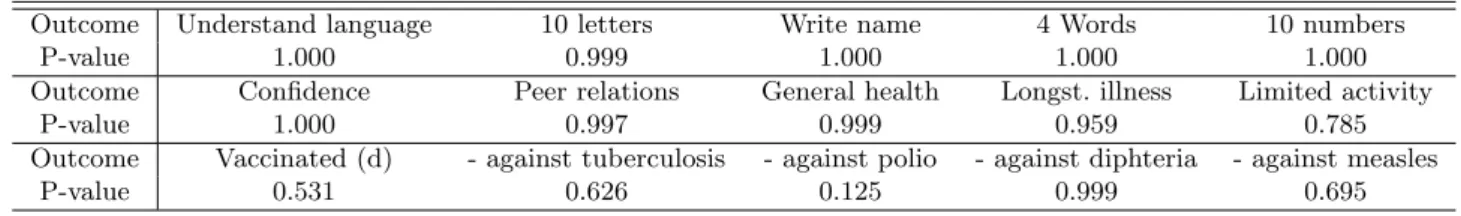
Taken together, our IV method essentially relies on variation in the distance to preschool across Roma children living in the same region and sharing similar family and neighborhood characteristics. Conditional on the mentioned set of control variables, we believe that individual distance to preschool is arguably exogenous – neither correlated with Roma families’ location choice, lobbyism/local preferences, nor local politicians activities to attract workers. To strengthen this argument, we provide the results of the test on exogeneity and monotonicity suggested by Huber and Mellace (2015) (for details please refer to Section 5.2).
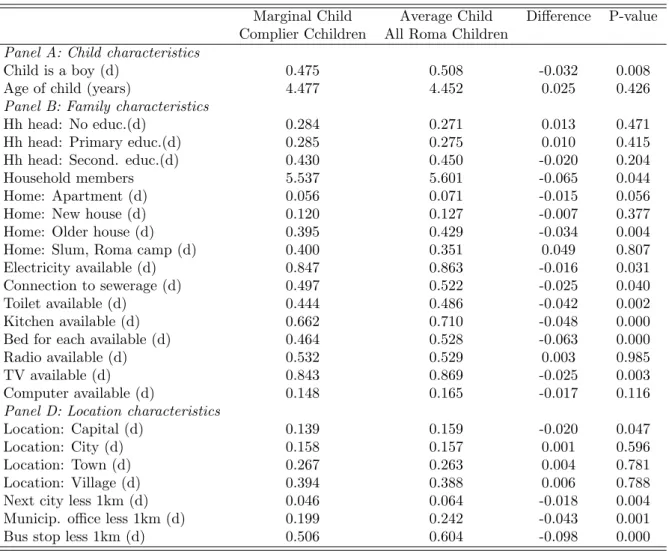
Under the previous conditions, our approach identifies the local average treatment effect (LATE) of preschool on child development in the subgroup of compliers. Hence, our estimates measure the effects of attending preschool on the development of the marginal child that only starts attending preschool if living close by. Only if we – as is the case in standard linear IV models – impose the strong assumption of effect homogeneity (that preschool attendance exerts the same effect on everyone), our estimated effect would apply to the entire population of Roma children. Who is the marginal child and how does he or she compare to the average Roma child? Table A.2 in the Appendix contrasts descriptive statistics of the complier population and the average population of Roma children in our sample. As we can see there are only some minor differences such as in the possession of some wealth items and the specific location of the family home. Regarding external validity it is important to bear in mind that the area under study covers 85 % of all Roma people in twelve countries of southeast Europe, the main location of residence of Roma people. Thus, our estimates provide a useful benchmark for the impact of expanding preschool availability on the development and integration of Roma children across a large swath of Europe.
4.3
Estimation
This section briefly sketches our estimation approaches based on inverse probability weighting (IPW), which are entirely non-parametric. As discussed in the previous subsection, we rely on two alternative
11This is in line with the results of several recent studies investigating the impact of preschools on maternal
labor supply, for instance, Cascio (2009); Fitzpatrick (2010); Goux and Maurin (2010); and Havnes and Mogstad (2011a).
identification strategies: our baseline estimates rely on an instrumental variable (IV) approach, while a selection-on-observables approach provides some benchmark estimates. In what follows we focus on the IPW estimator relying on an instrument variable approach (see also Fr¨olich (2007) for details). The IPW estimator relying on the selection-on-observables assumption is analogous to the IPW estimator relying on an IV approach and can be obtained by replacing the instrument by the treatment (please refer to Hirano, Imbens, and Ridder (2003) for details).12
The estimator underlying the IPW estimation relying on an IV is defined as follows: Let Di denote
the preschool attendance indicator (i.e., Di = 1 if attending and Di = 0 if not attending) of a particular
individual i in our sample of n observations. Zi represents the binary instrument, which takes the value
1 when individual i lives less than a kilometer away from preschool and 0 otherwise. Yi corresponds to
one of the child outcomes of interest, while Xi denotes the vector of observed covariates. Finally, let
p(Xi) ≡ Pr(Z = 1|X = Xi), which represents the conditional probability to live close to preschool given
the observed characteristics, also known as (instrument) propensity score.
Instrument assignment is as good as random once we condition on the covariates. Instead of conditioning on the covariates directly, we can also condition on the propensity score (see Rosenbaum and Rubin (1983)). In applications using semi- or non-parametric IV methods, controlling for the one-dimensional propensity score is often more feasible than controlling for a multidimensional vector of covariates. In other words, it may not be possible to find observations across instrument states that are comparable in terms of covariates for all combinations of covariate values in the data. Since distinct combinations of covariates may still yield similar propensity scores, finding comparable observations in terms of propensity scores is likely possible. Since the true propensity score is unknown, in practice any propensity score method relies on an estimate of this parameter, denoted by ˆp(Xi). We estimate
the latter non-parametrically by local constant kernel regression as discussed in Racine and Li (2004). This method allows for both continuous and discrete regressors and is implemented using the package by Hayfield and Racine (2008) for the statistical software R. We rely on Kullback-Leibler cross-validation (Hurvich, Simonoff, and Tsai (1998)) to choose the appropriate bandwidth, but test for sensitivity when cutting the bandwidth by half (see Section 5.2). Finally, we estimate the effect of preschool attendance by inverse probability weighting (IPW):13
12To be more precise, in the IPW estimator relying on a selection-on-observables approach Z
iis replaced by Di
everywhere in (1). This implies that the denominator reduces to 1 and that an estimate of the treatment propensity score Pr(D = 1|X = Xi) is used for weighting.
13
We use the normalized sample analogue of expression (11) in Fr¨olich (2007) where the normalization guarantees that the weights the observations obtain in the minuends and subtrahends of the numerator and denominator sum up to 1.
Estimated LATE = Pn i=1Yi· Zi/˜p(Xi) −P n i=1Yi· (1 − Zi)/¯p(Xi) Pn i=1Di· Zi/˜p(Xi) −P n i=1Di· (1 − Zi)/¯p(Xi) , (1) with ˜p(Xi) =Pn p(Xˆ i) i=1Zi/ ˆp(Xi)and ¯p(Xi) = 1− ˆp(Xi) Pn
i=1(1−Zi)/(1− ˆp(Xi)) being the normalized propensity scores.
14
The exact selection of control variables is as discussed in Section 4.2 based on the literature on children’s human capital production (Cunha, Heckman, Lochner, and Masterov 2006) and contains the following variables (see also Table 2, Panel B and C, for descriptive statistics): age (in years) and gender of the child, education of the household head (dummies for three categories), the type of the home (dummies for 4 categories), infrastructure of the house and the neighborhood (dummies for the availability of electricity, a sewage system, a toilet and a kitchen), wealth items (dummies for possessing a bed for each household member, a computer, radio or tv) and neighborhood characteristics, such as the location (dummies for 4 categories), distance to the next city, municipality office and bus stop (dummies indicating whether distance is less than 1 kilometre). In addition we control for a set of regional dummies (40 all together). Note that the set of control variables does not include parental employment or use of the local language as these variables are potentially endogenous to preschool attendance – so-called bad controls (Angrist and Pischke 2008) – and thus may bias our results.
It is worth noting that in contrast to the vast majority of IV applications, our empirical strategy is very flexible in terms of functional form assumptions. In particular, linearity in the first stage regression or the outcome model need not be imposed, as for instance in two stage least squares (TSLS). As both preschool attendance and all but one outcome are binary, TSLS appears particularly unattractive in our application because it is generally only consistent under linear probability models for both stages. Our approach is also more robust than semi-parametric estimators that rely on parametric models for the propensity score (like probit or logit), which may be prone to misspecification. In our case, the functional form of Pr(Z = 1|X = Xi) is not restricted at all.
Concerning inference, we estimate the standard error of the LATE estimator by (jointly) bootstrapping the estimation steps in the numerator and denominator of (1) 1999 times. We apply a cluster bootstrap, so that entire households rather than individuals are randomly drawn with replacement in each bootstrap sample. Clustering allows for dependencies between unobserved characteristics of children that live in the same household, which likely arise due to exposure to similar social networks, parenting style, etc.. In a sensitivity analysis shown in Section 5.2, we cluster instead on the level of local cluster which allows for dependencies between unobserved characteristics of children that live in the same neighborhood. Such dependencies may arise due to exposure to similar institutions, infrastructure, or social networks.
14For a representation of the specific weights please refer to Table A.2 in the Appendix.
5
Results
5.1
Main Results
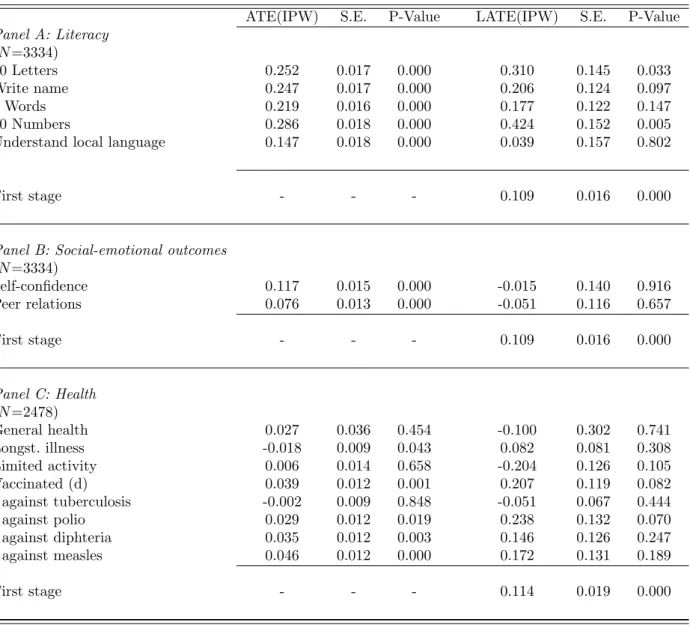
What are the effects of attending preschool on the development of Roma children? Table 4 displays the estimates resulting from the two alternative approaches, the selection-on-observables method and IV method. We first discuss the estimates based on the selection-on-observables approach. As we judge the underlying assumption to be rather strong in the context of our application, the estimates serve in our opinion only as a benchmark for the estimates based on the IV approach. The estimates resulting from the IV approach are, in our opinion, more plausible for assessing the causal effects of preschool attendance.
The overall picture resulting from the estimates under the selection-on-observables assumption resem-bles quite closely the picture resulting from the unconditional correlations (Table 4, Panel A versus Table 2, last column): children attending preschool outperform children not attending preschool. The condi-tional estimates are only slightly smaller in magnitude than the uncondicondi-tional ones. Children attending preschool are more likely to know ten letters of the alphabet (by 25.2 ppts), to write their name (by 24.7 ppts), to read 4 popular words (by 21.9 ppts), to recognize the symbol of at least ten numbers (by 28.6 ppts), and to understand the local language (by 14.7 ppts). The differences between children attending and not attending preschool regarding a couple of measures for children’s social-emotional development also maintain their relevance and significance (at any conventional level) when conditioning on the full set of controls: children attending preschool are more self-confident (by 11.7 ppts) and integrate better with their peers (by 7.6 ppts). Regarding the series of health-related outcomes we observe that children attend-ing preschool are slightly less likely to suffer from a longstandattend-ing illness (by 1.8 ppts) and are more likely to be vaccinated (by 3.9 ppts). Again these estimates are comparable in magnitude to the unconditional correlations displayed in Table 2.
As discussed in Section 4.2, omitted variables may bias the estimates resulting from a selection-on-observable strategy. We therefore proceed with the estimates resulting from the IV approach. Before doing so, we briefly discuss the first stage of our IV estimation. In other words, we address the question of whether the availability of a preschool in the close vicinity indeed stimulates preschool attendance among (at least some) Roma children. Doing so sheds some light on the relevance of the instrument, one of the assumptions underlying an IV estimation (see Section 4.2 for details). Table 4 shows that in the case of the sample available for children’s literacy and social-emotional outcomes the instrument shifts the likelihood of Roma children to attend preschool by 10.9 ppts, which is statistically significant at any conventional level. Using the smaller sample available for children’s health outcomes, the first stage is of similar magnitude – 11.4 ppts – and is also significant at any conventional significance level. In light of the rather low level of preschool attendance among Roma children – not even one third (30.9 %) of the
Table 4:
Estimation Results
ATE(IPW) S.E. P-Value LATE(IPW) S.E. P-Value Panel A: Literacy (N =3334) 10 Letters 0.252 0.017 0.000 0.310 0.145 0.033 Write name 0.247 0.017 0.000 0.206 0.124 0.097 4 Words 0.219 0.016 0.000 0.177 0.122 0.147 10 Numbers 0.286 0.018 0.000 0.424 0.152 0.005
Understand local language 0.147 0.018 0.000 0.039 0.157 0.802
First stage - - - 0.109 0.016 0.000
Panel B: Social-emotional outcomes (N =3334) Self-confidence 0.117 0.015 0.000 -0.015 0.140 0.916 Peer relations 0.076 0.013 0.000 -0.051 0.116 0.657 First stage - - - 0.109 0.016 0.000 Panel C: Health (N =2478) General health 0.027 0.036 0.454 -0.100 0.302 0.741 Longst. illness -0.018 0.009 0.043 0.082 0.081 0.308 Limited activity 0.006 0.014 0.658 -0.204 0.126 0.105 Vaccinated (d) 0.039 0.012 0.001 0.207 0.119 0.082 - against tuberculosis -0.002 0.009 0.848 -0.051 0.067 0.444 - against polio 0.029 0.012 0.019 0.238 0.132 0.070 - against diphteria 0.035 0.012 0.003 0.146 0.126 0.247 - against measles 0.046 0.012 0.000 0.172 0.131 0.189 First stage - - - 0.114 0.019 0.000
Note: The results above reflect the estimates resulting from separate selection-on-observables and IV estimations using the inverse probability weighting (IPW) methods as discussed in Hirano, Imbens, and Ridder (2003) and Fr¨olich (2007), respectively (see Section 4.3 for details). The set of controls corresponds to the variables shown in Table 2. Standard errors are estimated based on bootstrapping 1999 times. Significance is indicated as follows: *** p > 0.01, ** p > 0.05, * p > 0.1
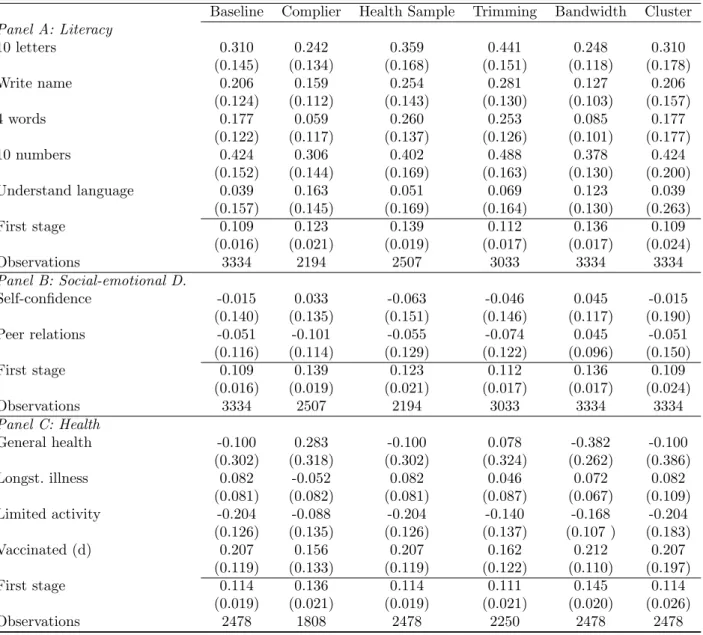
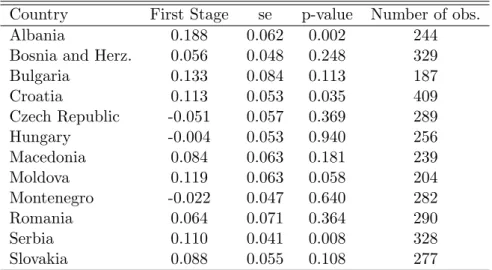
children in our Roma sample goes to preschool – this is a substantial increase. Among the Roma children in our sample who do not have a preschool close by, attendance is even lower, amounting to only one fifth. Hence, the mere offer of a preschool facility in the neighborhood helps to integrate Roma children into the local educational system early in life. The effectiveness of such a policy, however, differs across countries (see Table A.3 in the Appendix). Putting aside the issue of precision – notice that country samples contain rarely more than 300 observations –, the availability of a preschool in the close vicinity shifts preschool attendance in all except three countries. The exceptions are Czech Republic, Hungary and Montenegro. In the next section we therefore provide estimation results when excluding these three countries.15
The IV estimates based on our non-parametric IPW approach presented in Table 4, Panel A, suggest that preschool attendance brings considerable benefits for Roma children in terms of literacy. Roma children in preschool are 31.0 ppts more likely to know ten letters of the alphabet (significant at the 5 % level), 20.6 ppts more likely to write their own name, and 42.4 ppts more likely to recognize the symbols for the numbers 1 to 10. The estimated benefits of preschool exposure are substantial, in particular in the light of the poor performance of Roma children without exposure to preschool (see Table 2): only 20.6 % of the Roma children without exposure to preschool are able to name ten letters of the alphabet, 10.8 % can write their own name, and only 31.0 % recognize the symbols for the numbers 1 to 10. Hence, the point estimates suggest that exposure to preschool more than doubles the performance of Roma children in the performance of such literacy tasks and thus, helps close the performance gap with non-Roma children (which amounts to 26.9 ppts, 23.9 ppts, and 28.6 ppts, respectively). As a word of caution, however, it needs to be mentioned that the IV confidence intervals are rather wide, even for the statistically significant effects.16
To judge further about the magnitude of these estimates, we compare them to the estimates previously found in the literature. Notice that we only draw on studies investigating the impact of universal preschool on minority children. The reason for this is, as discussed in Section 1, that universal programs may not be sufficient for addressing the needs of minority children and thus findings for targeted programs may differ enormously from findings for universal programs. For such a comparison it is important to express the effects in terms of a standardized measure such as in terms of standard deviations (sd). The effects correspond to 0.65 sd, 0.52 sd and 0.86 sd in the case of being able to name ten letters, to write his or her own name and to identify the symbols of the numbers 1 to 10. These effects are comparable to those found, for instance, for ethnic minorities in Oklahoma (Gormley, Gayer, Phillips, and Dawson 2005). The
15
Selecting countries based on the country-specific first stages may jeopardize the accuracy of the results due to pre-testing bias. See also Abadie, Gu, and Shen (2015) for a discussion on this issue.
16
Interestingly, the estimated effect for the impact of preschool attendance on children’s literacy resulting from the IV approach are comparable to the estimates resulting from the selection-on-observables approach. Therefore, omitted confounding variables do not seem to play a big role in the case of the specific measures of children’s literacy. As discussed in Section 4.3 the marginal child is comparable in terms of observable characteristics to the average child. As such we also do not expect strong effect heterogeneity, at least not for this set of outcomes.
estimated benefits from preschool exposure for black children varied between 0.52 and 0.74 sd for verbal skills and amounted to 0.30 sd for analytical skills. In the case of Hispanic children, benefits were about 0.94 sd for analytical skills and ranged between 0.98 and 1.5 sd for verbal skills.
The skills discussed so far are the outcomes of basic literacy tests. Preschool seems to do a good job of boosting the Roma children’s performance in such tests. The picture, however, changes when evaluating the impact of attending preschool on Roma children’s proficiency in the local language, a more complex measure than the performance in basic literacy tests. In contrast to the estimate resulting from the selection-on-observables approach, the IV estimate for the impact of preschool attendance on children’s proficiency in the local language is almost 0 and insignificant. These differences point towards the existence of relevant confounding variables of parents’ decision to send their child to preschool and their effort to enhance children’s knowledge of the local language. What explains the absence of any causal effect of preschool on Roma children’s language proficiency? One possible explanation may be that Roma are likely to settle in compact areas. As such, there may also be a high concentration of Roma children in preschools and thus, little scope for teachers and native peers to influence Roma children’s proficiency in the local language.17 This is particularly important when comparing our results to the results of the study by
Dustmann, Raute, and Schoenberg (2013) who analyze the impact of universal preschool on immigrant children. In contrast to our study, they find positive returns to preschool in terms of language proficiency. Yet, they focus on a county in west Germany with a rather low immigrant ratio (abut 10 %).
Also in the case of children’s social-emotional development, such as self-confidence and peer relations, the IV estimates cannot confirm the positive and significant estimates resulting from the selection-on-observables approach (Table 4, Panel B). This difference between the results based on the alternative approaches points to the existence of important unobserved determinants of parental decision to send their children to preschool and inputs into the production of children’s social-emotional development. Such confounding variables may be, for instance, parents’ availability and effort to spend time with their children. In fact, a prominent theory established in developmental psychology – the so-called attachment theory (Bowlby 1969) – stresses the importance of a clear contact person for the development of children’s social-emotional skills. Unfortunately, we are unaware of any study providing estimates of universal preschool on minority children’s socio-emotional development. Findings from studies on children of the majority population provide mixed evidence. While Baker, Gruber, and Milligan (2008) and Kottelenberg and Lehrer (2014) find negative effects of universal care on children’s socio-emotional outcomes in Quebec – notice, however, the reform under study affected mainly children from advantaged backgrounds –
Datta-17We have experimented with splitting the sample according to the share of Roma living in the neighborhood.
While the points estimates for Roma children living in high Roma concentration areas (above 50 %) are substantially higher than the point estimates for Roma children living in low concentration areas (19.3 ppts versus -1.7 ppt), the confidence intervals are to big to really derive a strong statement regarding the relevance of the ethnic composition of the peers.