HAL Id: hal-02470246
https://hal.archives-ouvertes.fr/hal-02470246
Submitted on 7 Feb 2020
HAL is a multi-disciplinary open access archive for the deposit and dissemination of sci-entific research documents, whether they are pub-lished or not. The documents may come from teaching and research institutions in France or abroad, or from public or private research centers.
L’archive ouverte pluridisciplinaire HAL, est destinée au dépôt et à la diffusion de documents scientifiques de niveau recherche, publiés ou non, émanant des établissements d’enseignement et de recherche français ou étrangers, des laboratoires publics ou privés.
Study of the surface oxides and corrosion behaviour of
an equiatomic CoCrFeMnNi high entropy alloy by XPS
and ToF-SIMS
Luntao Wang, Dimitri Mercier, Sandrine Zanna, Antoine Seyeux, Mathilde
Laurent-Brocq, Loic Perriere, Ivan Guillot, Philippe Marcus
To cite this version:
Luntao Wang, Dimitri Mercier, Sandrine Zanna, Antoine Seyeux, Mathilde Laurent-Brocq, et al.. Study of the surface oxides and corrosion behaviour of an equiatomic CoCrFeMnNi high entropy alloy by XPS and ToF-SIMS. Corrosion Science, Elsevier, 2020, pp.108507. �10.1016/j.corsci.2020.108507�. �hal-02470246�
Preprint accepted for publication in Corrosion Science DOI: 10.1016/j.corsci.2020.108507
*Corresponding authors:
E-mail addresses: dimitri.mercier@chimieparistech.psl.eu (D. Mercier),
philippe.marcus@chimieparistech.psl.eu (P. Marcus)
1
Study of the surface oxides and corrosion behaviour of an equiatomic
CoCrFeMnNi high entropy alloy by XPS and ToF-SIMS
Luntao Wang1, Dimitri Mercier1*, Sandrine Zanna1, Antoine Seyeux1, Mathilde Laurent-Brocq2, Loïc Perrière2, Ivan Guillot2,
Philippe Marcus1*
1 Chimie ParisTech, PSL University, CNRS, Institut de Recherche de Chimie Paris, Physical Chemistry of Surfaces Group, 75005 Paris, France
2 Université Paris-Est Créteil, CNRS, ICMPE (UMR7182), 94320, Thiais, France
Abstract
XPS and ToF-SIMS analysis have been combined with electrochemical measurements to determine the corrosion behavior of the equiatomic CoCrFeMnNi high entropy alloy. An XPS methodology based on analysis of the 3p core level spectra was developed to determine the composition and thickness of oxide films. Both native oxide (∼1.4nm) and passive films (∼ 1.6nm) formed in acidic medium are duplex, comprising Cr and Mn inner layer and Cr/Fe/Co mixture outer layer. No nickel is observed in the oxide layer. The effects of exposure of the native film to sulfuric acid and passivation under anodic polarization have been investigated. Keywords: High entropy alloy; Oxide film; Passivation; XPS; ToF-SIMS
1. Introduction
Equiatomic high entropy alloys (HEAs), compared to the traditional alloys usually comprising a base metal and alloy elements, are a new class of alloys in which the distinction between major and minor elements is not relevant anymore. Indeed, they are composed of four, five or more metallic elements, in near equimolar concentration [1, 2]. For some compositions, depending mainly on the balance between the entropy of configuration of the solid solution and the enthalpy of mixing of the intermetallic [3, 4], HEAs form a single phase solid solution (without any intermetallic or other secondary phases), such as face-centered cubic (FCC) alloys elaborated from transition metals [5-8] and body-centered cubic (BCC) alloys elaborated from refractory metals [9-12]. The FCC CoCrFeMnNi HEA, which was first discovered by Brian Cantor et al. [13], has received a great deal of research interest due to its excellent mechanical properties [14-16]. Although this type of HEA has been developed since 2004, very little research focused on the corrosion behaviour of CoCrFeMnNi HEA [17-20].
2
The CoCrFeNi alloy was reported to have good anti-corrosion properties due to the formation of a protective oxide film rich in Cr species [18]. Generally, for conventional alloys containing chromium, such as stainless steel and Ni-base alloys, a high corrosion resistance is provided by the Cr-rich oxide layer playing the role of a barrier against the attack of aggressive ions from the environment [21-25]. The impact of other elements at high contents (Co and Mn) in the bulk alloys has been rarely studied. Normally, for alloys with high contents of Mn (range from 21 to 28 wt%), the corrosion resistance will decrease caused by the instability of the Mn oxide in the film [26]. The high Co concentration (15%) will also decrease the corrosion resistance of the alloys [27]. The corrosion behavior of CoCrFeNi-based HEAs, including Al, Cu, W, Mo and Ru[28-33], has been studied. Lee et al. [28] investigated the corrosion performance of AlxCrFe1.5MnNi0.5(x=0,0.3,0.5) HEAs in 1M NaCl solution, and the results
demonstrated that the addition of Al to the alloys reduces the resistance to pitting corrosion. The addition of Al in the AlxCoCrFeNi(x=0,0.25,0.5,1) HEAs had a similar effect in
chloride-containing solution, with Al leading to the formation of a porous passive film [29]. The corrosion behaviour of FeCoNiCrCux(x=0,0.5,1) HEA was studied in sulfuric acid, and it was
suggested that the corrosion resistance of the alloys was deteriorated by the segregation of Cu resulting in galvanic corrosion [31]. The CoCrFeNiMox(x=0.1-0.5at%) HEAs demonstrated good
corrosion resistance in Cl-containing solution due to the beneficial effect of Mo[32]. Scully et al. [33] reported excellent passivity for 38Ni-21Cr-20Fe-13Ru-6Mo-2W HEA with the enrichment of Cr (48 at%) and small amount of Mo (8 at%) in the oxide film. Some recent work was focused on the corrosion behavior of CoCrFeMnNi HEA. For example, a comparison between a CoCrFeMnNi HEA and a commercial alloy (Hastelloy® C276) in 3.5wt% NaCl solution has demonstrated an improvement of the corrosion resistance properties for the HEA [34]. A similar comparison with a 304 stainless steel in sulfuric acid solution, showing relatively low anti-corrosion performance of the HEA, could be explained by a lower content of Cr oxide and large quantity of hydroxide in the passive film. Characterization of oxidized CoCrFeMnNi HEA in air from 500 to 900°C showed the dependence of the oxide film composition on oxidation temperature. The oxide film is mainly composed of Mn2O3 with a
thin inner Cr oxide at temperatures lower than 800°C, while at 900°C, the oxide film was composed of Mn3O4 [35]. However, up to now, there is a limited number of investigations of
the corrosion behavior of CoCrFeMnNi HEA related to modification of composition and structure of the surface oxide films.
In this paper, we investigate the corrosion behavior of an equimolar CoCrFeMnNi high entropy alloy using electrochemical measurements coupled with advanced surface characterization
3
techniques, including Time-of-Flight Secondary Ions Mass Spectrometry (ToF-SIMS) and X-ray Photoelectron Spectroscopy (XPS). Particularly, the composition of the surface oxide layers (native oxide and passive films) was determined using a new XPS approach based on the peak fitting of the 3p photopeaks.
2. Experimental procedures
2.1 Sample preparationPure Fe, Co, Cr, Ni and Mn ingots (purity exceeding 99.9 wt%) were used to prepare the HEA by high frequency electromagnetic induction melting in a water-cooled copper crucible under He atmosphere. Before melting, samples were prepared by mechanical polishing of raw materials. Afterwards, the ingot was shaped into a rod with a diameter of 13 mm and a length of around 8 cm by gravity casting. The cooling rate was estimated to be about 103 K.s-1. Finally, the samples were wrapped into a tantalum sheet, and were annealed at 1373 K during 13h under a He atmosphere to limit oxidation. At the end of the annealing, the samples were air quenched. The objective of this homogenization annealing is to eliminate the dendritic microstructure formed during casting process. To refine the grain size, HEA samples were rolled and then annealed at a temperature of 900°C for 30min under a He atmosphere, followed by air quenching. The average grain size of the HEA is ~ 30µm. Table 1 presents the measured chemical composition of the HEA in atomic percentage (measured by scanning electron microscopy coupled with Energy-dispersive X-ray spectroscopy (EDX)). As shown in previous papers[6, 36], the obtained CoCrFeMnNi is a face centered cubic solid solution, which is representative of the high temperature (i.e.: 1373 K) stable state.
Elements Fe Co Ni Cr Mn
at.% 19.8 20 19.9 20.3 20
Table 1 Chemical composition of the CoCrFeMnNi alloy obtained by EDX
The samples were ground with SiC paper from 320 up to 2400 grit, and then polished with 6µm, 3µm, 1µm and 0.25µm diamond suspension until a mirror like finish is obtained. They were then cleaned in ultrasonic baths of acetone, ethanol and ultra-pure water for 10 mins, and dried in compressed air. The sample surfaces were mechanically polished before each electrochemical experiment.
2.2 Electrochemical measurements
4
+0.245V/NHE), a Pt wire as the counter electrode and a HEA sample as a working electrode (area 1.3cm2 delimited by a Viton O ring) was used. The electrochemical measurements were carried out at room temperature in 0.05 M H2SO4 (aq) prepared with ultra-pure water (Millipore,
resistivity 18.5Mohm.cm) pre-deaerated by Ar bubbling for 30 min. An EC_Lab SP200 potentiostat from Bio-Logic was used. Before the potentiodynamic and potentiostatic tests, the open circuit potential (OCP) was monitored for 30 min, corresponding to the stabilisation time of the potential. The potentiodynamic polarization tests were performed at a potential scan rate of 1 mV.s-1, and the potential range was from -800mV/SCEto 1200mV/SCE. The potentiostatic tests were carried out at 200mV/SCE, 400mV/SCE and 600mV/SCE.
2.3 Surface characterization
Surface analysis was performed by a combination of X-Ray Photoelectron Spectroscopy (XPS), and Time-of-Flight Secondary Ions Mass Spectrometry (ToF-SIMS).
X-ray Photoelectron Spectroscopy (XPS) analysis was performed using a Thermo Electron Escalab 250 spectrometer, with a monochromatic Al Kα X-ray source (hv=1486.6eV) operating at a pressure around 10-9 mbar. The analyser pass energy was 50eV for survey spectra and 20eV for high resolution spectra. Beforehand the spectrometer was calibrated using Au4f7/2 at 84.1eV.
Spectra were recorded and analysed using Thermo Avantage software (Version 5.956). Elemental depth profiles were obtained using a ToF-SIMS 5 spectrometer (IONTOF GmbH). The spectrometer was run at an operating pressure of 10-9 mbar. A pulsed 25 keV Bi+ primary ion source was employed for analysis, delivering a current of 1.2 pA over a 100 × 100 μm2 area. Depth profiling was carried out by interlacing static analysis with sputtering using a 0.5 keV Cs+ sputter beam giving a 17 nA target current over a 300×300 μm2 area.
5
3. Results
3.1 The native oxide film
1400 1200 1000 800 600 400 200 0 0 1x10⁵ 2x10⁵ 3x10⁵ 4x10⁵ 5x10⁵ 6x10⁵ 7x10⁵ C1s 3p O1s Cr2p Mn2p Fe2p Co2p Counts / s Binding Energy / eV Ni2p (a) 0.0 0.2 0.4 0.6 0.8 1.0 0 2 4 6 8 10 XPS Spectrum Ni Auger Fe Auger Co Auger Mn Auger 810 800 790 780 770 5000 10000 15000 20000 25000 30000 Fe L3VV Ni L3M23M23 Co 2p1/2 Counts / s Binding Energy / eV Co 2p3/2 Co 2p (b) 660 650 640 630 2000 3000 4000 5000 6000 7000 8000 9000 Ni L3VV Mn 2p1/2 Counts / s Binding Energy / eV Mn 2p3/2 Mn 2p (c) 740 730 720 710 700 0 4000 8000 12000 16000 20000 24000 Ni L3M23V Co L3VV Fe 2p1/2 Counts / s Binding Energy / eV Fe 2p3/2 Fe 2p (d) 890 880 870 860 850 840 20000 40000 60000 80000 100000 Mn L3VV Ni 2p1/2 Counts / s Binding Energy / eV Ni 2p3/2 Ni 2p (e)
6
595 590 585 580 575 570 565 10000 12000 14000 16000 18000 20000 22000 24000 Cr 2p Counts / s Binding Energy / eV Cr 2p1/2 Cr 2p3/2 (f) 80 75 70 65 60 55 50 45 40 35 2000 4000 6000 8000 10000 Cr 3p Ni 3p Co 3p Fe 3p Mn 3p Cr 3s Counts / s Binding Energy / eV 3p (g)Fig.1 High resolution XPS (a) survey spectrum, (b)-(f) 2p core level spectra and (g) 3p core level spectrum recorded for the
native oxide film formed on the HEA and Auger transitions of pure elements constituting the CoCrFeMnNi alloy
X-Ray Photoelectron Spectroscopy (XPS) is an appropriate method to investigate the composition of nanometer-thick surface oxide films[21, 22, 37-40]. Generally, for alloys containing Fe, Cr, Ni, Co and Mn, the 2p core level peaks are recorded with high resolution and many references are available to study the chemical states of the analyzed elements[41-46]. However, for the CoCrFeMnNi HEA with five elements in equiatomic ratios, new challenges appear to analyze the XPS data due to the interference of the Auger transitions which overlap with 2p peaks of the main elements in the alloy.
The characteristic high resolution XPS 2p core level spectra obtained for a native oxide film formed on the equiatomic CoCrFeMnNi HEA are presented on Fig.1(b)-(f). For each spectrum, the Auger transitions of constituting elements of the HEA have been added. It is observed that using the Al Kα X-ray source all photopeaks overlap with Auger transitions except the Cr 2p3/2
peak (Co2p3/2 / NiL3M23M23 and FeL3VV, Mn2p3/2 / NiL3VV, Fe2p3/2 / NiL3M23V and CoL3VV,
Ni2p3/2 / MnL3VV). An Mg Kα X ray source could be used, but overlap with Auger transitions
(Fe2p3/2 / Mn L3M23M23) still exist making quantification difficult.
Thus, another approach based on the 3p core level peaks (Fig.1(g)) was developed to characterize the HEA surfaces. Although the sensitivity of 3p peaks is lower than for 2p peaks, the 3p spectra do not present overlapping with Auger peaks and the narrow energy range for the analyzed elements allows probing the same thickness for all elements.
7
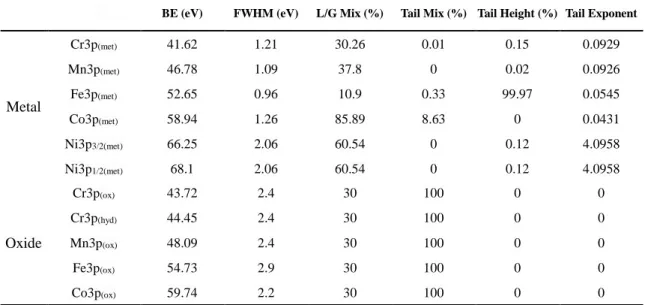
Table 2 The parameters for fitting the XPS 3p spectra of the pure metals and oxides
Firstly, the standard 3p core level peaks for the pure metals were recorded using pure metals from batches used to manufacture the CoCrFeMnNi HEA. These pure metal samples were polished with 2400 grit SiC paper, and then introduced into the XPS analysis chamber. Samples were sputtered using an Ar+ ion beam to remove surface oxides and contaminants and obtain metallic surfaces. High resolution XPS 3p core level spectra were recorded and curve fitted using the Thermo Electron software Avantage with an iterative Shirley-type background subtraction. All the parameters, including binding energy (BE), full width at half maximum (FWHM), Gaussian-Lorentzian(GL) ratio and asymmetry factor, were automatically adjusted by the software to best fit the peaks of pure metals. An asymmetric function was necessary for the peak fitting of metal peaks, as expected for transition metals (owing to the conduction electron scattering amplitude for inter-band absorption or emission in metals, at the Fermi level[47, 48]). The detailed parameters for fitting the 3p peaks of pure metals are shown in Table 2.For Ni 3p, a splitting of the metallic component is observed (spin orbit coupling is due to the coupling between the electron spin momentum and its orbital angular momentum). Generally, this effect is visible for p, d and f core levels but spectral resolution can limit this splitting. It is the case here for the 3p orbitals of Cr, Mn, Fe and Co.
A similar approach based on the decomposition of the native oxide covering the pure metals has also been used. For components characteristic of the oxide layer, a Lorentzian/Gaussian peak shape with a fixed ratio of 30/70 was used. The detailed parameters for fitting the 3p peaks of oxides are shown in Table 2.
BE (eV) FWHM (eV) L/G Mix (%) Tail Mix (%) Tail Height (%) Tail Exponent
Metal Cr3p(met) 41.62 1.21 30.26 0.01 0.15 0.0929 Mn3p(met) 46.78 1.09 37.8 0 0.02 0.0926 Fe3p(met) 52.65 0.96 10.9 0.33 99.97 0.0545 Co3p(met) 58.94 1.26 85.89 8.63 0 0.0431 Ni3p3/2(met) 66.25 2.06 60.54 0 0.12 4.0958 Ni3p1/2(met) 68.1 2.06 60.54 0 0.12 4.0958 Oxide Cr3p(ox) 43.72 2.4 30 100 0 0 Cr3p(hyd) 44.45 2.4 30 100 0 0 Mn3p(ox) 48.09 2.4 30 100 0 0 Fe3p(ox) 54.73 2.9 30 100 0 0 Co3p(ox) 59.74 2.2 30 100 0 0
8
80 75 70 65 60 55 50 45 40 35 2000 4000 6000 8000 10000 Cr 3s Ni 3p3/2 Ni 3p1/2 Co 3pox Co 3pmet Fe 3pox Fe 3pmet Mn 3pox Mn 3pmet Cr 3phyd Cr 3pox Counts / s Binding Energy / eV Cr 3pmet 3p(a)
580 575 570 8000 10000 12000 14000 16000 18000 20000 22000 24000 (b) Cr 2phyd Cr 2pox Cr2pmet Counts / s Binding Energy / eV Cr 2p3/2Fig.2 XPS core level spectra for the native oxide film formed on the HEA:(a) Cr 3p, Mn 3p, Fe 3p, Co 3p, Ni 3p and (b) Cr
2p3/2. The black dots represent the experimental spectra and the colored lines show the peak fitting.
The spectrum (35-75eV) characteristic of the 3p peaks of Cr, Mn, Fe, Co and Ni, and the peak fitting for a native oxide film formed on CoCrFeMnNi HEA surface are presented in Fig.2(a). This decomposition has been carried out by introducing the fit parameters determined previously for each element (metal state and oxide state) (Table 2).
The Cr 3p core level spectrum is fitted with three peaks, corresponding to metallic Crmet
9
chemical states. As previously indicated, the absence of overlap between the Cr 2p3/2 core level
spectrum and Auger transitions of other metals makes it possible to decompose the Cr 2p3/2
photopeak and compare the decomposition of the Cr 3p core level. Fig.2(b) shows the fitting of Cr 2p3/2 core level spectrum. The Cr 2p3/2 spectrum is fitted by three components
characteristic of metallic Crmet (BE=573.9±0.1eV, FWHM=1.25eV), hydroxide Crhyd
(BE=577.1±0.1eV, FWHM=2.55eV) and oxide, which is represented by five peaks, based on the peak fitting method proposed by Biesinger [41], Crox (BE=575.7±0.1eV, 576.6±0.1eV,
577.4±0.1eV, 578.4±0.1eV and 579±0.1eV, FWHM=1.05eV). In our work, the area ratio between the 5 components of decomposed Cr 2p3/2ox (chromium oxide) has been determined
and considered as fixed for all analysed surfaces.
The Co 3p, Fe 3p and Mn 3p spectra show two components representing the metallic states Comet (BE=58.9±0.1eV), Femet (BE=52.7±0.1eV) and Mnmet (BE=46.8±0.1eV), and the oxide
states Coox (BE=59.7±0.1eV), Feox (BE=54.7±0.1eV) and Mnox (BE=48.1±0.1eV). The
decomposition of Ni 3p into two components, Ni 3p3/2 at 66.3eV and Ni 3p1/2 at 68.1eV only
shows the presence of metallic nickel underneath the oxide layer. No oxidized nickel is observed in the surface oxide layer.
To calculate the thickness of the oxide film and the chemical composition of the film and the modified alloy layer under the oxide, a model consisting in a homogeneous and continuous oxide layer on the sample surface, comprising Feox, Crox/hyd, Mnox and Coox, and a modified
alloy layer with Femet, Crmet, Mnmet, Comet and Nimet was assumed. Based on this model, the
following 11 equations with 11 unknowns (𝑘 , 𝑑𝑜𝑥𝑖𝑑𝑒,𝐷𝐶𝑟𝑀𝑒𝑡,𝐷𝑀𝑛𝑀𝑒𝑡,𝐷𝐹𝑒𝑀𝑒𝑡,𝐷𝐶𝑜𝑀𝑒𝑡,𝐷𝑁𝑖𝑀𝑒𝑡,
𝐷𝐶𝑟𝑂𝑥,𝐷
𝑀𝑛𝑂𝑥,𝐷𝐹𝑒𝑂𝑥,𝐷𝐶𝑜𝑂𝑥) was used :
I𝑋𝑀𝑒𝑡= 𝑘𝜎𝑋𝜆𝑋𝑀𝑒𝑡𝐷𝑋𝑀𝑒𝑡𝑇𝑋exp(−𝑑𝑜𝑥𝑖𝑑𝑒𝜆
𝑋
𝑂𝑥 ), with X=Cr, Mn, Fe, Co and Ni (1)
I𝑍𝑂𝑥= 𝑘𝜎𝑍𝜆𝑍𝑂𝑥𝐷𝑍𝑂𝑥𝑇𝑍[1 − exp(−𝑑𝑜𝑥𝑖𝑑𝑒𝜆
𝑍
𝑂𝑥 )], with Z=Cr, Mn, Fe and Co (2)
𝐷𝐶𝑟𝑀𝑒𝑡+ 𝐷𝑀𝑛𝑀𝑒𝑡+ 𝐷𝐹𝑒𝑀𝑒𝑡+ 𝐷𝐶𝑜𝑀𝑒𝑡+ 𝐷𝑁𝑖𝑀𝑒𝑡= 𝐷𝑀𝑒𝑡 (3) 𝐷𝐶𝑟𝑂𝑥+ 𝐷𝑀𝑛𝑂𝑥+ 𝐷𝐹𝑒𝑂𝑥+ 𝐷𝐶𝑜𝑂𝑥= 𝐷𝑂𝑥 (4)
with 𝐼𝑋𝑌 the intensity of photoelectrons (cps eV) emitted by the considered core level X in the matrix Y, 𝑘 a constant characteristic of the spectrometer, 𝜎𝑋 the photoionization cross-section of the considered core level X, 𝜆𝑋𝑌 the inelastic mean free path of photoelectrons emitted by the considered core level X in the matrix Y(in nm), 𝑇𝑋 the transmission function of the analyse for the considered core level X, 𝑑𝑜𝑥𝑖𝑑𝑒 the thickness of the oxide layer (nm)
10
and 𝐷𝑋𝑌 the density of the element X in the matrix Y (mol.cm-3) defined by 𝐷𝑋𝑌 = 𝑀𝜌𝑌
𝑌× 𝑥𝑋
𝑌
with 𝜌𝑌 the density of the matrix Y (g.cm-3), 𝑀𝑌 the molar mass of the matrix Y (g.mol-1) and 𝑥𝑋𝑌 the atomic percentage of the element X in the matrix Y. The 𝜌
𝑀𝑒𝑡 value is 8 g.cm-3 [49,
50]. The 𝜌𝑂𝑥 value is taken as 5.22 g.cm-3, which is the density of chromium oxide, as it is shown later that the surface oxide layer is enriched in Cr(III). The density of Fe2O3 would be
similar (5.24 g.cm-3). The values of the photoionization cross-sections (𝜎𝑋) at 1486.6 eV are taken from Scofield[51] and the inelastic mean free paths (𝜆𝑋𝑌) calculated by the TPP2 formula[52] are compiled in the Table 3.
Core level Cr 3p Mn 3p Fe 3p Co 3p Ni 3p
𝝈𝑿 1.173 1.423 1.669 1.93 2.217
𝝀𝑿𝒐𝒙𝒊𝒅𝒆(nm) 2.6 2.6 2.59 2.58 2.57
𝝀𝑿𝒎𝒆𝒕𝒂𝒍(nm) 2.14 2.14 2.14 2.14 2.14
Table 3 Values of the photoionization cross-section (𝜎𝑋) and inelastic mean free paths (𝜆𝑋𝑌) used for XPS quantification
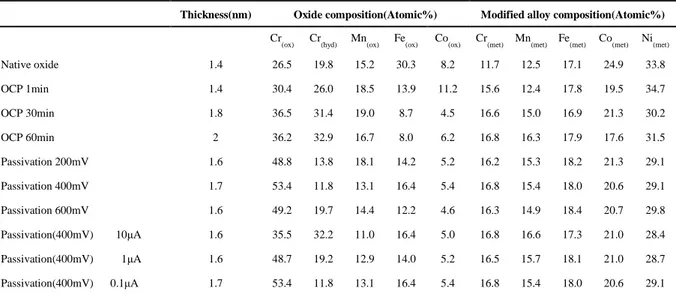
Using the intensities of the 3p peaks obtained after peak fitting and equations (1) to (4), the thickness of the oxide layer as well as the elemental compositions of the oxide layer and of the modified layer under the oxide (alloy/oxide interface) are determined. The results are reported in Table 4.
Thickness(nm) Oxide composition(Atomic%) Modified alloy composition(Atomic%)
Cr
(ox) Cr(hyd) Mn(ox) Fe(ox) Co(ox) Cr(met) Mn(met) Fe(met) Co(met) Ni(met)
Native oxide 1.4 26.5 19.8 15.2 30.3 8.2 11.7 12.5 17.1 24.9 33.8 OCP 1min 1.4 30.4 26.0 18.5 13.9 11.2 15.6 12.4 17.8 19.5 34.7 OCP 30min 1.8 36.5 31.4 19.0 8.7 4.5 16.6 15.0 16.9 21.3 30.2 OCP 60min 2 36.2 32.9 16.7 8.0 6.2 16.8 16.3 17.9 17.6 31.5 Passivation 200mV 1.6 48.8 13.8 18.1 14.2 5.2 16.2 15.3 18.2 21.3 29.1 Passivation 400mV 1.7 53.4 11.8 13.1 16.4 5.4 16.8 15.4 18.0 20.6 29.1 Passivation 600mV 1.6 49.2 19.7 14.4 12.2 4.6 16.3 14.9 18.4 20.7 29.8 Passivation(400mV) 10μA 1.6 35.5 32.2 11.0 16.4 5.0 16.8 16.6 17.3 21.0 28.4 Passivation(400mV) 1μA 1.6 48.7 19.2 12.9 14.0 5.2 16.5 15.7 18.1 21.0 28.7 Passivation(400mV) 0.1μA 1.7 53.4 11.8 13.1 16.4 5.4 16.8 15.4 18.0 20.6 29.1
Table 4 Thickness and chemical composition of the native oxide, the oxide after exposure to acidic solution at the open
circuit potential (OCP) and passive films formed in 0.05M H2SO4 on equiatomic CoCrFeMnNi HEA surface
The thickness for the native oxide film is estimated at 1.4 nm. The native oxide film presents a strong enrichment of chromium (46.3 at%, including 26.5 at% of oxide and 19.8 at% of hydroxide) and iron (30.3 at%) while a depletion of Co (8.2 at%) is clearly observed. No nickel oxide is detected by XPS in the oxide layer.
11
at%), Mn (12.5 at%) and Fe (17.1 at%) is observed, while the concentration of metallic Ni (33.8 at%) and Co (24.9 at%) are significantly higher than in the bulk. The chromium depletion zone in the modified alloy layer is correlated to the enrichment of chromium oxide in the oxide film. The chromium enrichment in the oxide is due to the higher oxygen affinity to Cr [53] (standard free energy of formation for chromium oxide (ΔG298.15k˚) is -1058.067 kJ/mol [54],
i.e more negative than for the other alloy elements). A Cr depleted-zone in the alloy beneath the oxide film appears due to slow diffusion in the alloymatrix at room temperature [55, 56].
0 50 100 150 101 102 103 104 105 Modified alloy layer Oxide 116Ni 2 -112 Fe2 -110 Mn2 -104 Cr2 -118 Co2 -91CoO 2 -87MnO 2 -88 FeO2 -Intensity (counts) Sputtering time (s) 84 CrO2 -Metallic substrate
Fig.3 ToF-SIMS depth profiles for the native oxide film formed on the HEA
Fig.3 shows the ToF-SIMS negative ion depth profiles for the native oxide film formed on the surface of the HEA sample. The intensity is plotted in logarithmic scale versus sputtering time. The 84CrO
2- ion profile is used to define the oxide film region (ending at 84% of the maximum
intensity in the depth profile) since the chromium oxide is located throughout the oxide film region, and the 112Fe2- ion profile is used to define the metallic region (starting at beginning of
the intensity plateau). Thus, an intermediate region is determined from 35s to 70s of sputtering. The colour dashed lines mark the limits between the oxide film, modified alloy layer and metallic substrate.
In the oxide region, one observes that the 88FeO2- profile peaks in the outer part of the oxide
film region and decreases slowly through the oxide. Oxidized iron is therefore mainly located in the outer part of the film, although its presence in small amount in the inner oxide cannot be excluded. The 91CoO2- profile also has its maximum in the outer region of the oxide film,
indicating that the cobalt oxide is mainly located in the outer oxide. Furthermore, 91CoO 2
12
is the main species at the surface. The 84CrO2- profile exhibits a wide peak throughout the whole
region of the film. Oxidized chromium is thus distributed in the whole film. Finally, the
87MnO
2- profile has its maximum in the inner region of the oxide film (around 20s of sputtering
time), indicating that manganese oxide is preferentially located in the inner oxide film region. The 90NiO2- ion is not plotted in Fig.1, since its intensity is extremely low compared to those
of 84CrO2-, 88FeO2-, 91CoO2- and 87MnO2- ions. It means that Ni oxide is present only at trace
level in the oxide film.
Focussing on the intermediate region, one can see that it is characterised by increasing intensities of the signals of the metallic compounds (112Fe2-, 110Mn2-, 116Ni2- and 118Co2-) and a
fast decrease of the intensity of the signals characteristic of the oxides, i.e. MO2- (with M=Cr,
Fe, Mn, Co), making the passage of the oxide/alloy interface. The alloy region under the oxide is enriched in Ni and Co, as indicated by the hump in the Ni2- and Co2- signals. The 104Cr2
-profile shows very low intensity due to low secondary emission yield.
From ToF-SIMS observations, it is thus possible to establish the presence of a duplex oxide structure composed of chromium, iron and cobalt oxides in the outer layer and chromium and manganese oxides in the inner layer. Under this duplex oxide film, near the metal/oxide interface, there is a modified alloy layer, enriched in Ni and Co. The alloy substrate can be located for sputtering times over 70s.
3.2 Surface oxide film after exposure to acidic aqueous solution at the open circuit potential
13
Fig.4 (a) Open circuit potential evolution for the CoCrFeMnNi HEA with a native oxide film in 0.05M H2SO4 and (b)
Potentiodynamic polarization curve of the CoCrFeMnNi HEA in 0.05M H2SO4 (scan rate of 1mV/s)
The evolution of the open circuit potential (OCP) for the CoCrFeMnNi HEA with a native oxide film in 0.05M H2SO4 electrolyte is presented in Fig.4(a). The potential exhibits a sharp
decrease and reaches its minimum value after ~1min of immersion, suggesting some dissolution of the native film. Then the potential increases slightly to reach a stabilisation plateau after 600s. In order to determine the chemical changes at the surface during immersion at OCP, surfaces immersed for 1min (minimum potential), 30 and 60 min were analysed by XPS and ToF-SIMS. The XPS data are compiled in Table 4 and ToF-SIMS profiles are presented on Fig.5. 0 50 100 150 200 250 100 101 102 103 104 105 Modified alloy layer Metallic substrate Intensity (counts) Sputtering time (s) 110Mn 2 -104 Cr2 -112Fe 2 -116 Ni2 -118 Co2 -91 CoO2- 87MnO 2 -88FeO 2 -84CrO 2 -Oxide (a)
14
0 50 100 150 200 250 300 100 101 102 103 104 105 (b) Modified alloy layer Metallic substrate Intensity (counts) Sputtering time (s) 110 Mn2 -104 Cr2 -112 Fe2 -116 Ni2 -118 Co2 -91 CoO2 -87 MnO2 -88 FeO2 -84 CrO2 -Oxide 0 50 100 150 200 250 300 100 101 102 103 104 105 (c) Modified alloy layer Metallic substrate Intensity (counts) Sputtering time (s) 110 Mn2 -104 Cr2 -112 Fe2 -116 Ni2 -118 Co2 -91 CoO2 - 87 MnO2 -88 FeO2 -84 CrO2 -OxideFig.5 ToF-SIMS depth profiles for the HEA with a native oxide film after exposure to 0.05M H2SO4 at OCP for (a) 1min, (b)
30min and (c) 60min
Fig.5 shows ToF-SIMS depth profiles obtained on HEA samples after exposure to acidic aqueous solution at the OCP. The general behaviour is similar to the one observed on the native oxide. Fe and Co oxides are located in the outer layer while Mn oxide is in the inner layer. Cr oxide is distributed in the whole film. The maximum intensity of 88FeO2- strongly decreases
with increasing immersion time (compared to the native oxide) indicating a decrease of the iron content in the outer oxide.
The sputtering time associated to the thickness of the oxide layer is increasing from 60s to 90s for 1min and 60min immersion in acidic aqueous solution at OCP, meaning that the thickness of the oxide film is increasing with prolonged immersion time, which is in agreement with XPS data (1.4 and 2 nm, respectively).
15
The immersion time in sulfuric acid has also an effect on the shape of the oxide depth profiles. For all characteristic ions of the oxides, a slow decrease of the signal is observed in the metallic substrate region. This indicates a roughening of the metal/oxide interface.
The chemical composition and thickness of the film and modified alloy layer for different immersion times in 0.05M H2SO4 are reported in Table 4. Although the thickness of the film
after 1 minute of immersion is similar to the one of the native oxide layer, the chemical composition is strongly modified. A sharp decrease of iron content is observed (13.9 at% compared to 30.3 at% for the native oxide), which can be explained by the dissolution of iron oxide during the immersion in acidic solution. The content of chromium compounds, and particularly the chromium hydroxide, increases strongly (26.0 at% as compared to 19.8 at% for the native oxide). For increasing immersion time at the open circuit potential, the amount of iron in the oxide layer continues to decrease until it becomes stationary (8.7 at% after 30min and 8.0 at% after 1h), and the amount of chromium in the oxide film continues to increase until it becomes stationary (Cr oxide: 36.5 at% for 30min and 36.2 at% after 1h; Cr hydroxide: 31.4 at% for 30min and 32.9 at% after 1h). During the immersion, the amounts of cobalt and manganese oxides remain nearly constant. Nickel oxide is not detected. A thickening of the oxide layer is observed during the immersion.
3.3 Passivity of the HEA alloy
To further understand the reactivity of the CoCrFeMnNi HEA surfaces, different passive layers have been elaborated by chronoamperometry in 0.05M H2SO4. The experimental parameters
for the formation of passive layers have been determined from potentiodynamic polarization curves in 0.05M H2SO4 solution, presented in Fig.4(b) for a scan rate of 1 mV.s-1. In the anodic
region, the HEA shows an anodic current peak at -250mV/SCE caused by active dissolution, then a wide passive range from 0mV/SCE to 800mV/SCE. The lowest current density is observed at 400mV/SCE. To investigate the passive state of the HEA, it was maintained in 0.05M H2SO4(aq) at a passive potential until current went down to 0.1µA/cm² for three
different passive potentials (200 mV, 400 mV and 600 mV). The passive film and the alloy underneath the film were subsequently analysed by XPS, and the XPS 3p core level spectra for the passive films formed on the HEA for three different passive potentials are shown in Fig.6.
16
75 70 65 60 55 50 45 40 35 2000 4000 6000 8000 Ni 3p1/2 Counts / s Binding Energy / eV 200mV Ni 3p3/2 Co 3pox Co 3pmet Fe 3pox Fe 3pmet Mn 3pox Mn 3pmet Cr 3phyd Cr 3pox Cr 3pmet (a) 75 70 65 60 55 50 45 40 35 2000 4000 6000 8000 (b) Counts / s Binding Energy / eV 400mV Ni 3p1/2 Ni 3p3/2 Co 3pox Co 3pmet Fe 3pox Fe 3pmet Mn 3pox Mn 3pmet Cr 3phyd Cr 3pox Cr 3pmet 75 70 65 60 55 50 45 40 35 2000 4000 6000 (c) Counts / sBinding Energy (E) 600mV Ni 3p1/2 Ni 3p3/2 Co 3pox Co 3pmet Fe 3pox Fe 3pmet Mn 3pox Mn 3pmet Cr 3phyd Cr 3pox Cr 3pmet
17
Fig.6 XPS 3p core level spectra for the passive films formed on the HEAat three different passive potentials:(a) 200 mV, (b) 400 mV and (c) 600 mV
The results of composition and thickness of the passive films, obtained from the XPS 3p core level spectra, are reported in Table.4. The thickness of the passive films is found to be 1.6 nm after passivation at 200mV and 600mV, and 1.7 nm at 400mV. Thus, the passivation potential has no significant effect on the thickness of the film. In the passive film a chromium enrichment is always observed compared to the native oxide. This enrichment is mainly reflected in a strong increase of the chromium oxide (48.8 at% at 200 mV, 53.4 at% at 400 mV and 49.2 at% at 600mV compared to 26.5 at% for the native oxide) while chromium hydroxide is in average slightly lower (13.8 at% at 200 mV, 11.8 at% at 400 mV and 19.7 at% at 600mV) than in the native oxide (19.8 at%). The amounts of Mn and Co measured in the passive film are similar to those measured in the native oxide. The iron content shows a strong decrease, which was also observed at the OCP, assigned to a selective dissolution of iron oxide.
The Cr, Mn and Fe contents in the modified alloy layer under the passive film are found to be around 16 at%, 15 at% and 18 at%, respectively. This shows a slight depletion of Cr, Mn and Fe in the modified alloy layer compared to the contents in the bulk. The concentrations of Co in the modified alloy region are found to be around 20 at%, i.e. similar to the Co bulk content. The Ni contents in the modified alloy layer reach 29 at%, revealing a strong Ni enrichment under the oxide compared to the bulk (20 at%). The composition of the modified alloy layer under the passive film is similar to the one of the native oxide. It is to be noted that despite the stronger enrichment of chromium oxide in the passive film compared to the native oxide, the content of Cr (16 at%) in the modified alloy layer is slightly higher than that for the native oxide (12 at%). This is related to the passivation process in which there is no dissolution of Cr, whereas Fe is dissolved.
Table 4 also shows the composition and thickness obtained for the passive film formed at 400mV at different passive currents. Increasing the passivation time at 400mV causes a decrease of the passive current. The passive film was analysed at three different stages (10µA/cm² (45s), 1µA/cm² (530s) and 0.1µA/cm² (4600s)). The thickness of the films remains unchanged (1.6 nm) with increasing passivation time (decreasing passive current). As for the concentration of the oxides in the film, the contents of Mn oxide (11 to 13 at%), Fe oxide (14 to 16 at%), Co oxide (5 at%) do not change significantly during prolonged passivation. The marked modification occurring in the film during the passivation is the increase of the Cr oxide (from 35.5 at% to 53.4 at%) combined with the decrease of the Cr hydroxide (from 32.2 at%
18
to 11.8 at%), indicating dehydroxylation during the passivation process. In the modified alloy layer, the fractions of metallic Cr (16 at%), Mn (16 at%), Fe (18 at%), Co (21 at%) and Ni (29 at%) are stable.
0 50 100 150 200 101 102 103 104 105 Modified alloy layer Metallic substrate 84 CrO2 -Intensity (counts) Sputtering time (s) 118 Co2 -87 MnO2 -88 FeO2 -91 CoO2 -116 Ni2 -112 Fe2 -110 Mn2 -104 Cr2 -Oxide
Fig.7 ToF-SIMS depth profiles for the passive film formed on the HEA at 400 mV/SCE in 0.05M H2SO4 (Passivation time:4600s; passive
current:0.1µA/cm²)
Fig.7 shows the ToF-SIMS depth profile for the passive film formed on the CoCrFeMnNi HEA sample after passivation for 4600s in 0.05M H2SO4(aq) at 400 mV/SCE.
As previously, the depth profiles can be splitted into 3 regions corresponding to the passive film, the modified alloy and the metallic substrate. After passivation, the structure of the oxide film is not modified. The 91CoO2- and 88FeO2- signals in the outer oxide show a lower intensity,
indicating a lower Co and Fe concentration; the oxides of the other elements remain unchanged. As for the modified alloy layer, a slight Ni enrichment is observed.
4. Discussion
In this work, XPS and ToF-SIMS have been used to determine the nature (chemical composition) and thickness of different oxides (native oxide, passive layers) formed on the surface of a CoCrFeMnNi HEA. The native oxide presents an enrichment of Cr3+ (46.3 at %) and Fe3+ (30.3 at%) while passive films comprise mainly Cr3+ (>60%). In all cases, Ni oxide is
19
Gibbs standard free energy of formation (ΔG298.15k˚) for Cr2O3, which is -1058.067kJ/mol, i.e.
much more negative than for Fe2O3 (-742.294 kJ/mol), MnO2 465.138 kJ/mol) and CoO
(-214.198 kJ/mol) [54].
A duplex layer covers the substrate. Fe and Co are located preferentially in the outer layer, Mn in the inner layer. Cr is distributed in the whole film. A modified alloy layer, enriched in Ni, is observed under the oxide film.
After exposure of the alloy covered by the native oxide to acidic aqueous solution at OCP, the CoCrFeMnNi HEA shows a marked dissolution of Fe oxide from the film, in agreement with others [57]. The amounts of Cr oxide and hydroxide in the film are increased after immersion for 60 min. This is explained by the slow dissolution rate of Cr compared to Fe oxide in the acid media [22, 38]. Despite the dissolution of species in sulfuric acid, the thickness of the film is increased after immersion. There is a balance between dissolution of the species and growth of the oxide which seems to bring a stationary thickness after ~30 min of immersion. The thickening of the oxide film is observed by both XPS and ToF-SIMS measurements.
The passivity of the HEA at different passive potentials (200mV, 400mV and 600mV) has been studied. The XPS characterization has shown that the passivation potential has a weak effect on the composition and thickness of the oxide layer and modified alloy layer. The studied passive films are found to be enriched in Cr species, particularly Cr oxide, compared to the native oxide film. The contents of Mn and Co oxides in the passive films are similar to that in the native oxide film. Much less Fe oxide is observed in the passive film after passivation, which is consistent with the high dissolution of Fe oxide in the acidic solution. The total thickness for the passive films is found to be 1.6-1.7 nm, which is of the same order of magnitude as the thickness of the passive film (1.5-2 nm) on stainless steel after passivation in sulfuric acid [22, 58]. During passivation at 400 mV in sulfuric acid, the main modification of the composition observed in the passive film is the increase of Cr oxide and decrease of Cr hydroxide. Considering that the total content of Cr species (Cr oxide and hydroxide) in the film is stationary, the passivation process is correlated to the transformation of Cr hydroxide into Cr oxide. This transformation process is also responsible for the decrease of passive current. This passivation mechanism has been already proposed by Marcus et al. [38] for the passivation of stainless steel. The thickness of the film is maintained at 1.6-1.7 nm, hence the passivation time has no significant effect on the thickness of the passive film, which has already been verified by Maurice et al. [22] for Fe-17Cr-14.5Ni-2.3Mo stainless steel.
20
5. Conclusions
XPS, ToF-SIMS and electrochemical measurements were combined in order to study the corrosion behavior of the equiatomic CoCrFeMnNi high entropy alloy, with emphasis on characterization of the native oxide and passive films. A new XPS approach based on the analysis of 3p core level spectra has been developed. The parameters for fitting the 3p core level peaks of pure metals were used as reference for fitting the XPS 3p spectra for the oxide covered high entropy alloy. The decomposition of Cr 3p core level peaks into oxide and hydroxide have been verified by fitting also the Cr 2p spectra.
For all studied oxide films (native oxide and passive films), a duplex structure is observed. Cr3+ is distributed in the whole film, while Fe and Co oxides are located preferentially in the outer layer and Mn oxide in the inner layer. Ni is not observed in the oxide layer. A modified metallic layer is observed under the oxide, with a significant enrichment of nickel.
During immersion in sulfuric acid at OCP, a selective dissolution of iron oxide combined with an increase of the chromium hydroxide is clearly demonstrated. Mn and Co oxide contents and locations in the film are not significantly modified.
After passivation of the HEA, an increase of chromium content is observed in the passive film. The transformation from Cr hydroxide to Cr oxide (by dehydroxylation) is observed for increasing passivation time.
Declaration of Competing Interest
The authors declare that they have no known competing financial interests or personal relationships that could have appeared to influence the work reported in this paper.
Author Statement
Luntao Wang: Methodology, Investigation, Formal analysis, Writing - original draft Dimitri Mercier: Conceptualization, Writing - review & editing, Supervision
Sandrine Zanna: Investigation, Methodology, Validation Antoine Seyeux: Investigation, Methodology, Validation Mathilde Laurent-Brocq: Writing - review, Investigation Loïc Perrière: Investigation
21
Philippe Marcus: Conceptualization, Writing - review & editing, Supervision.
All authors contributed to the interpretation of the results and to the writing of the paper.
Data availability statement
The datasets generated for this study are available on request to the corresponding author.
Acknowledgements
This project has received funding from the European Research Council (ERC) under the European Union’s Horizon 2020 research and innovation program (ERC Advanced grant no. 741123). Région île-de-France is acknowledged for partial funding of the ToF-SIMS equipment. China Scholarship Council (CSC) is acknowledged for the scholarship to the first author (No. 201706460018).
References
[1] D.B. Miracle, O.N. Senkov, A critical review of high entropy alloys and related concepts, Acta Mater. 122 (2017) 448-511.
[2] Y. Zhang, T.T. Zuo, Z. Tang, M.C. Gao, K.A. Dahmen, P.K. Liaw, Z.P. Lu, Microstructures and properties of high-entropy alloys, Prog. Mater. Sci. 61 (2014) 1-93.
[3] O. Senkov, J. Miller, D. Miracle, C. Woodward, Accelerated exploration of multi-principal element alloys with solid solution phases, Nat. Commun. 6 (2015) 6529.
[4] Y. Zhang, High-Entropy Materials: A Brief Introduction, Springer 2019.
[5] T. Nagase, P.D. Rack, J.H. Noh, T. Egami, In-situ TEM observation of structural changes in nano-crystalline CoCrCuFeNi multicomponent high-entropy alloy (HEA) under fast electron irradiation by high voltage electron microscopy (HVEM), Intermetallics 59 (2015) 32-42.
[6] G. Bracq, M. Laurent-Brocq, L. Perrière, R. Pirès, J.-M. Joubert, I. Guillot, The fcc solid solution stability in the Co-Cr-Fe-Mn-Ni multi-component system, Acta Mater. 128 (2017) 327-336.
[7] Z. Wu, H. Bei, F. Otto, G.M. Pharr, E.P. George, Recovery, recrystallization, grain growth and phase stability of a family of FCC-structured multi-component equiatomic solid solution alloys, Intermetallics 46 (2014) 131-140.
[8] G. Bracq, M. Laurent-Brocq, C. Varvenne, L. Perrière, W. Curtin, J.-M. Joubert, I. Guillot, Combining experiments and modeling to explore the solid solution strengthening of high and medium entropy alloys, Acta Mater. 177 (2019) 266-279.
[9] M. Feuerbacher, T. Lienig, C. Thomas, A single-phase bcc high-entropy alloy in the refractory Zr-Nb-Ti-V-Hf system, Scr. Mater. 152 (2018) 40-43.
[10] J. Couzinié, G. Dirras, L. Perrière, T. Chauveau, E. Leroy, Y. Champion, I. Guillot, Microstructure of a near-equimolar refractory high-entropy alloy, Mater. Lett. 126 (2014) 285-287.
[11] L. Lilensten, J.-P. Couzinie, L. Perriere, A. Hocini, C. Keller, G. Dirras, I. Guillot, Study of a bcc multi-principal element alloy: Tensile and simple shear properties and underlying deformation mechanisms, Acta Mater.
22
142 (2018) 131-141.
[12] O.N. Senkov, G. Wilks, J. Scott, D.B. Miracle, Mechanical properties of Nb25Mo25Ta25W25 and V20Nb20Mo20Ta20W20 refractory high entropy alloys, Intermetallics 19 (2011) 698-706.
[13] B. Cantor, I.T.H. Chang, P. Knight, A.J.B. Vincent, Microstructural development in equiatomic multicomponent alloys, Mater. Scie. Eng.: A 375-377 (2004) 213-218.
[14] B. Gludovatz, A. Hohenwarter, D. Catoor, E.H. Chang, E.P. George, R.O. Ritchie, A fracture-resistant high-entropy alloy for cryogenic applications, Science 345 (2014) 1153-1158.
[15] B. Schuh, F. Mendez-Martin, B. Völker, E.P. George, H. Clemens, R. Pippan, A. Hohenwarter, Mechanical properties, microstructure and thermal stability of a nanocrystalline CoCrFeMnNi high-entropy alloy after severe plastic deformation, Acta Mater. 96 (2015) 258-268.
[16] Y. Zhao, D.-H. Lee, M.-Y. Seok, J.-A. Lee, M. Phaniraj, J.-Y. Suh, H.-Y. Ha, J.-Y. Kim, U. Ramamurty, J.-i. Jang, Resistance of CoCrFeMnNi high-entropy alloy to gaseous hydrogen embrittlement, Scr. Mater. 135 (2017) 54-58.
[17] Y. Shi, B. Yang, P. Liaw, Corrosion-resistant high-entropy alloys: A review, Metals 7 (2017) 43.
[18] Y. Qiu, S. Thomas, M.A. Gibson, H.L. Fraser, N. Birbilis, Corrosion of high entropy alloys, NPJ Mater. Degrad. 1 (2017) 15.
[19] Z. Tang, L. Huang, W. He, P.K. Liaw, Alloying and processing effects on the aqueous corrosion behavior of high-entropy alloys, Entropy 16 (2014) 895-911.
[20] M.-H. Tsai, J.-W. Yeh, High-entropy alloys: a critical review, Materials Research Letters, 2 (2014) 107-123. [21] E. Gardin, S. Zanna, A. Seyeux, A. Allion-Maurer, P. Marcus, Comparative study of the surface oxide films on lean duplex and corresponding single phase stainless steels by XPS and ToF-SIMS, Corros. Sci. 143 (2018) 403-413.
[22] V. Maurice, H. Peng, L.H. Klein, A. Seyeux, S. Zanna, P. Marcus, Effects of molybdenum on the composition and nanoscale morphology of passivated austenitic stainless steel surfaces, Faraday Discuss. 180 (2015) 151-170. [23] V. Maurice, P. Marcus, Progress in corrosion science at atomic and nanometric scales, Prog. Mater. Sci. 95 (2018) 132-171.
[24] V. Maurice, W. Yang, P. Marcus, XPS and STM Study of Passive Films Formed on Fe‐ 22Cr (110) Single‐ Crystal Surfaces, Journal of the Electrochemical Society, 143 (1996) 1182-1200.
[25] Y. Dou, S. Han, L. Wang, X. Wang, Z. Cui, Characterization of the passive properties of 254SMO stainless steel in simulated desulfurized flue gas condensates by electrochemical analysis, XPS and ToF-SIMS, Corros. Sci. (2019) 108405.
[26] S. Fajardo, I. Llorente, J.A. Jiménez, J. Bastidas, D.M. Bastidas, Effect of Mn additions on the corrosion behaviour of TWIP Fe-Mn-Al-Si austenitic steel in chloride solution, Corros. Sci. 154 (2019) 246-253.
[27] S. Peissl, G. Mori, H. Leitner, R. Ebner, S. Eglsäer, Influence of chromium, molybdenum and cobalt on the corrosion behaviour of high carbon steels in dependence of heat treatment, Mater. Corros. 57 (2006) 759-765. [28] C.P. Lee, C.C. Chang, Y.Y. Chen, J.W. Yeh, H.C. Shih, Effect of the aluminium content of AlxCrFe1.5MnNi0.5 high-entropy alloys on the corrosion behaviour in aqueous environments, Corros. Sci. 50 (2008) 2053-2060.
[29] Y.-F. Kao, T.-D. Lee, S.-K. Chen, Y.-S. Chang, Electrochemical passive properties of AlxCoCrFeNi (x= 0, 0.25, 0.50, 1.00) alloys in sulfuric acids, Corros. Sci. 52 (2010) 1026-1034.
[30] C.-M. Lin, H.-L. Tsai, Evolution of microstructure, hardness, and corrosion properties of high-entropy Al0.5CoCrFeNi alloy, Intermetallics 19 (2011) 288-294.
[31] Y.-J. Hsu, W.-C. Chiang, J.-K. Wu, Corrosion behavior of FeCoNiCrCux high-entropy alloys in 3.5% sodium chloride solution, Mater. Chem. Phys. 92 (2005) 112-117.
23
[32] X.-L. Shang, Z.-J. Wang, Q.-F. Wu, J.-C. Wang, J.-J. Li, J.-K. Yu, Effect of Mo Addition on Corrosion Behavior of High-Entropy Alloys CoCrFeNiMo x in Aqueous Environments, Acta Metall. Sin. Engl. 32 (2019) 41-51.
[33] K.F. Quiambao, S.J. McDonnell, D.K. Schreiber, A.Y. Gerard, K.M. Freedy, P. Lu, J.E. Saal, G.S. Frankel, J.R. Scully, Passivation of a corrosion resistant high entropy alloy in non-oxidizing sulfate solutions, Acta Mater. 164 (2019) 362-376.
[34] A. Rodriguez, J.H. Tylczak, M. Ziomek-Moroz, Corrosion Behavior of CoCrFeMnNi High-Entropy Alloys (HEAs) Under Aqueous Acidic Conditions, ECS Trans. 77 (2017) 741-752.
[35] G. Laplanche, U. Volkert, G. Eggeler, E. George, Oxidation behavior of the CrMnFeCoNi high-entropy alloy, Oxid. Met. 85 (2016) 629-645.
[36] M. Laurent-Brocq, A. Akhatova, L. Perrière, S. Chebini, X. Sauvage, E. Leroy, Y. Champion, Insights into the phase diagram of the CrMnFeCoNi high entropy alloy, Acta Mater. 88 (2015) 355-365.
[37] F. Di Franco, A. Seyeux, S. Zanna, V. Maurice, P. Marcus, Effect of High Temperature Oxidation Process on Corrosion Resistance of Bright Annealed Ferritic Stainless Steel, J. Electochem. Soc. 164 (2017) C869-C880. [38] V. Maurice, W. Yang, P. Marcus, X‐ Ray photoelectron spectroscopy and scanning tunneling microscopy study of passive films formed on (100) Fe‐ 18Cr‐ 13Ni single‐ crystal surfaces, J. Electochem. Soc. 145 (1998) 909-920.
[39] A. Machet, A. Galtayries, P. Marcus, P. Combrade, P. Jolivet, P. Scott, XPS study of oxides formed on nickel‐ base alloys in high‐ temperature and high‐ pressure water, Surf. Interface Analysis 34 (2002) 197-200.
[40] P. Marcus, M.E. Bussell, XPS study of the passive films formed on nitrogen-implanted austenitic stainless steels, Applic. Surf. Sci. 59 (1992) 7-21.
[41] M.C. Biesinger, B.P. Payne, A.P. Grosvenor, L.W.M. Lau, A.R. Gerson, R.S.C. Smart, Resolving surface chemical states in XPS analysis of first row transition metals, oxides and hydroxides: Cr, Mn, Fe, Co and Ni, Applic. Surf. Sci. 257 (2011) 2717-2730.
[42] M. Aronniemi, J. Sainio, J. Lahtinen, Chemical state quantification of iron and chromium oxides using XPS: the effect of the background subtraction method, Surf. Sci. 578 (2005) 108-123.
[43] T. Yamashita, P. Hayes, Analysis of XPS spectra of Fe2+ and Fe3+ ions in oxide materials, Applic. Surf. Sci. 254 (2008) 2441-2449.
[44] B. Payne, M. Biesinger, N. McIntyre, X-ray photoelectron spectroscopy studies of reactions on chromium metal and chromium oxide surfaces, J. Electron Spectrosc. Relat. Phenom. 184 (2011) 29-37.
[45] A.M. Salvi, J.E. Castle, J.F. Watts, E. Desimoni, Peak fitting of the chromium 2p XPS spectrum, Applic. Surf. Sci. 90 (1995) 333-341.
[46] E. Ünveren, E. Kemnitz, S. Hutton, A. Lippitz, W. Unger, Analysis of highly resolved x‐ ray photoelectron Cr 2p spectra obtained with a Cr2O3 powder sample prepared with adhesive tape, Surf. Interface Analysis 36 (2004) 92-95.
[47] S. Doniach, M. Sunjic, Many-electron singularity in X-ray photoemission and X-ray line spectra from metals, J. Phys. C: Solid State Phys. 3 (1970) 285.
[48] J.W. Gadzuk, M. Šunjić, Excitation energy dependence of core-level x-ray-photoemission-spectra line shapes in metals, Phys. Rev. B 12 (1975) 524.
[49] N.D. Stepanov, D.G. Shaysultanov, G.A. Salishchev, M.A. Tikhonovsky, E.E. Oleynik, A.S. Tortika, O.N. Senkov, Effect of V content on microstructure and mechanical properties of the CoCrFeMnNiVx high entropy alloys, J. Alloys Compd. 628 (2015) 170-185.
[50] J. He, W. Liu, H. Wang, Y. Wu, X. Liu, T. Nieh, Z. Lu, Effects of Al addition on structural evolution and tensile properties of the FeCoNiCrMn high-entropy alloy system, Acta Mater. 62 (2014) 105-113.
24
[51] J.H. Scofield, Hartree-Slater subshell photoionization cross-sections at 1254 and 1487 eV, J. Electron Spectrosc. Relat. Phenom. 8 (1976) 129-137.
[52] S. Tanuma, C.J. Powell, D.R. Penn, Calculations of electorn inelastic mean free paths. II. Data for 27 elements over the 50–2000 eV range, Surf. Interface Analysis 17 (1991) 911-926.
[53] L. Wang, A. Seyeux, P. Marcus, Thermal stability of the passive film formed on 316L stainless steel surface studied by ToF-SIMS, Corros. Sci. (2019) 108395.
[54] I. Barin, Thermochemical data of pure substances, VCH, (1989).
[55] H.E. Evans, D.A. Hilton, R.A. Holm, Chromium-depleted zones and the oxidation process in stainless steels, Oxid. Met. 10 (1976) 149-161.
[56] C. Leygraf, G. Hultquist, Initial oxidation stages on Fe-Cr(100) and Fe-Cr(110) surfaces, Surf. Sci. 61 (1976) 69-84.
[57] H. Luo, Z. Li, A.M. Mingers, D. Raabe, Corrosion behavior of an equiatomic CoCrFeMnNi high-entropy alloy compared with 304 stainless steel in sulfuric acid solution, Corros. Sci. 134 (2018) 131-139.
[58] Z. Wang, F. Di-Franco, A. Seyeux, S. Zanna, V. Maurice, P. Marcus, Passivation-induced physicochemical alterations of the native surface oxide film on 316L austenitic stainless steel, J. Electochem. Soc. 166 (2019) C3376-C3388.