Publisher’s version / Version de l'éditeur:
Journal of The Electrochemical Society, 156, 6, pp. B782-B790, 2009-04-23
READ THESE TERMS AND CONDITIONS CAREFULLY BEFORE USING THIS WEBSITE. https://nrc-publications.canada.ca/eng/copyright
Vous avez des questions? Nous pouvons vous aider. Pour communiquer directement avec un auteur, consultez la première page de la revue dans laquelle son article a été publié afin de trouver ses coordonnées. Si vous n’arrivez pas à les repérer, communiquez avec nous à PublicationsArchive-ArchivesPublications@nrc-cnrc.gc.ca.
Questions? Contact the NRC Publications Archive team at
PublicationsArchive-ArchivesPublications@nrc-cnrc.gc.ca. If you wish to email the authors directly, please see the first page of the publication for their contact information.
NRC Publications Archive
Archives des publications du CNRC
This publication could be one of several versions: author’s original, accepted manuscript or the publisher’s version. / La version de cette publication peut être l’une des suivantes : la version prépublication de l’auteur, la version acceptée du manuscrit ou la version de l’éditeur.
For the publisher’s version, please access the DOI link below./ Pour consulter la version de l’éditeur, utilisez le lien DOI ci-dessous.
https://doi.org/10.1149/1.3116922
Access and use of this website and the material on it are subject to the Terms and Conditions set forth at
Correlation of in situ and ex situ measurements of water permeation
through nafion NRE211 proton exchange membranes
Adachi, Makoto; Navessin, Titichai; Xie, Zhong; Frisken, Barbara; Holdcroft,
Steven
https://publications-cnrc.canada.ca/fra/droits
L’accès à ce site Web et l’utilisation de son contenu sont assujettis aux conditions présentées dans le site
LISEZ CES CONDITIONS ATTENTIVEMENT AVANT D’UTILISER CE SITE WEB.
NRC Publications Record / Notice d'Archives des publications de CNRC:
https://nrc-publications.canada.ca/eng/view/object/?id=5c18cdd6-bfe9-446a-8b3f-cfa6aa726456
https://publications-cnrc.canada.ca/fra/voir/objet/?id=5c18cdd6-bfe9-446a-8b3f-cfa6aa726456
Correlation of In Situ and Ex Situ Measurements of Water
Permeation Through Nafion NRE211 Proton Exchange
Membranes
Makoto Adachi,a,bTitichai Navessin,a,zZhong Xie,a,
*
Barbara Frisken,candSteven Holdcrofta,b,z
a
Institute for Fuel Cell Innovation, National Research Council Canada, Vancouver, British Columbia V6T 1W5, Canada
b
Department of Chemistry and cDepartment of Physics, Simon Fraser University, Burnaby, British Columbia V5A 1S6, Canada
Water permeability at 70°C is determined for Nafion NRE211 membrane exposed to either liquid or vapor phases of water. Chemical potential gradients of water across the membrane are controlled through use of differential humidity 共38–100% RH兲 in the case of water vapor and hydraulic pressure 共0–1.2 atm兲 in the case of liquid water. Accordingly, three types of water permeation are defined: vapor-vapor permeation, liquid-vapor permeation 共LVP兲, and liquid-liquid permeation. The difference in chemical potentials across the membrane, and more significantly, the flux of water, is largest when the membrane is exposed to liquid on one side and vapor on the other 共i.e., LVP conditions兲. Polarization curves and net water fluxes are reported for NRE211-based MEAs at 70°C under two different operating conditions. Water permeability measurements obtained ex situ are compared to fuel cell water balance measurements obtained in situ. It is found that the magnitude of back-transport of water during fuel cell operation can be explained only by considering that the membrane is exposed to liquid on one side and vapor on the other 共i.e., LVP conditions兲. Thus, LVP water transport is largely responsible for regulating water balance within the operating mem-brane electrode assembly.
© 2009 The Electrochemical Society. 关DOI: 10.1149/1.3116922兴 All rights reserved.
Manuscript submitted January 6, 2009; revised manuscript received March 9, 2009. Published April 23, 2009.
As a clean and efficient power converter, proton exchange mem-brane 共PEM兲 fuel cells are considered a candidate for mobile, trans-portation, and stationary applications. In this type of fuel cell, a PEM serves as both the electrolyte and the separator of reactants. Perfluorosulfonated ionomer 共PFSI兲 membranes are commonly em-ployed and are sandwiched between gas diffusion electrodes that form the anode and cathode of a membrane electrode assembly 共MEA兲. In these devices, hydrogen gas is typically oxidized at the anode and oxygen is reduced at the cathode. Protons generated at the anode transport through the aqueous regions of the PFSI membrane to the cathode where they combine with oxygen according to known electrochemical reactions. The presence of water in the membrane is considered essential for proton transport to occur, and in this respect, the membrane must be sufficiently hydrated during operation.
Water transport to, from, and through the membrane involves a complex interplay of processes, as illustrated in Fig.1. Included in these processes are the transport of water from the anode to the cathode by electro-osmotic drag共JEOD兲, i.e., water that accompanies
protons as they travel from anode to cathode, and the generation of water at the cathode as the product of the oxygen reduction reaction 共JORR兲 at a rate that increases with current density. Both these
pro-cesses lead to an unfavorable, unbalanced distribution of water within the MEA. Electro-osmotic drag 共EOD兲 has the potential to dehydrate the ionomer near, and in, the anode catalyst layer, whereas the accumulation of liquid water in the pores of the cathode impedes oxygen from reaching the reaction sites. The latter is mitigated if the rate of water evaporation at the cathode共Jcគevap.兲 offsets its
accumu-lation, whereas the effect of the former may be reduced if water is able to permeate from the cathode to the anode 共JWP兲. When the
sum of the rates of liquid water evaporation共Jcគevap.兲 and back water
permeation共JWP兲 is insufficient to compensate the sum of JORRand
JEOD, water accumulates at the cathode.
During the past decade, a number of water balance experiments have been performed on fuel cells that refer to the direction and the magnitude of the net flux of water 共i.e., the sum of JWPand JEOD兲.1-7
The water fluxes obtained from these experiments are useful for discerning the net flow of water under steady-state conditions.
When comparing net water fluxes of fuel cell systems, it is often convenient to normalize the data to obtain the value, , which is the ratio of the net water flux to proton flux, as defined by Springer et al.8When  is positive, the direction of the net water flux is toward the cathode; when negative, it is toward the anode. Negative -values imply that JWPtoward the anode is larger than JEOD and
have been experimentally observed. Janssen and Overvelde et al. conducted a systematic evaluation of  using Nafion 105 under combinations of wet, dry, and differential pressure of the supplied gases.9Negative -values were observed when the anode was dry, whereas positive -values were observed for other operating condi-tions. Yan et al. observed negative -values when the cathode gases were saturated and the flow rate of the relatively drier H2gas 共20%
RH兲 at the anode was increased.10 Cai et al. conducted a water balance study of Nafion 112-based MEAs under dry H2and
moder-ately humidified air and report that -values are negative, increasing in magnitude from −0.06 to −0.18 as the current density is increased from 0.1 to 0.6 A cm−2.11
Although the body of work on measurements of net water trans-port through an operating fuel cell is quite large, more information is required to take advantage of negative  values so that a net trans-port of water to the anode may serve to offset the deleterious effects of dehydration of the anode and flooding of the cathode.5,9-11 For
*Electrochemical Society Active Member.
z
this reason, studies of water permeation共JWP兲 through PEMs are
drawing increasing interest as part of a general strategy for mitigat-ing issues associated with water management and improvmitigat-ing the performance of PEM fuel cells.
The permeation of water through a membrane is the transport of water from one side of a membrane to the other.12 The process consists of water sorption, diffusion within the membrane, and de-sorption. Within the field of PFSI-based PEMs, Nafion has been the most extensively studied. Studies of water transport through Nafion can be categorized as one of three types: 共i兲 Measurements of rates of water transport into, within, and out of, the membrane, 共ii兲 studies of the distribution of water within the membrane, and 共iii兲 the mo-lecular mobility of water within the membrane. This current work falls within the first category. Information on water transport can be extracted by observing the rate of swelling and deswelling of the membrane on exposure to water vapor.13-17 In these experiments, transient rates of water ingressing or egressing the membrane can be derived. Alternatively, the permeability of a membrane to water can be determined by applying a chemical potential gradient,18-21 in-duced by a concentration or pressure gradient, and measuring the flux of water. For example, Majsztrik et al. determined the water permeation flux through Nafion 115 membrane to be 0.03 g min−1cm−2共equivalent to 0.28 mol m−2s−1兲 under a liquid
water/PEM/dry N2flow共0.8 L min−1兲 at 70°C.22From these
mea-surements, information such as permeability of the membranes and activation energy of water permeation were extracted.
In order to understand and to correlate these individually studied ex situ and in situ experimental studies, numerical modeling of the water transport processes have been undertaken. Concepts underpin-ning the modeling of heat and mass transport within a fuel cell have been extensively reviewed.23Springer et al., in a highly cited piece of work, proposed a model for water transport through a PEM8in which they took the membrane’s state of hydration into account in order to predict the rates of water transport across the PEM. Despite the material properties of the components not being particularly well understood at the time, their empirical and systematic application of physical chemistry principles to fuel cell operation enabled them to construct a simplistic model that has guided many recent studies in this area. Together with other studies, a generalized understanding of water transport processes in an operating fuel cell has emerged, as illustrated in Fig.1. Different models are often distinguished in the way they describe each of the water fluxes illustrated in Fig. 1. Eikerling et al., for example, proposed that hydraulic permeation to be a significant factor determining JWP,24whereas Weber combined
hydraulic permeation and diffusive permeation in the JWPterm.25
The nature and magnitude of JWPis clearly an important factor in
any realistic model. Thus, a requirement of implementing numerical models to explain and predict actual permeation fluxes is the avail-ability of accurate values of water transport parameters. However, the experimental techniques used to obtain these parameters are of-ten technique-specific and may not always be transferable to the simulation of fuel cell polarization data, leading to inaccurate con-clusions. The conditions under which water transport parameters are obtained may be quite different from the conditions under which fuel cell polarization curves are obtained, thus making numerical simulation even more suspect.
In this work, we attempt to obtain water permeability measure-ments obtained ex situ and compare the data to fuel cell water bal-ance measurements obtained in situ, under comparable conditions of temperature and relative humidity, with the specific purpose of re-vealing the role of back transport of water on fuel cell performance. More specifically, this paper describes the comparison of water transport data obtained when a Nafion NRE211 membrane is ex-posed to either liquid or vapor phases of water, and wherein a chemical potential gradient is developed across the membrane by either controlling the differential humidity in the case of water vapor or hydraulic pressure in the case of liquid water. Accordingly, three types of water permeation are defined as follows:
1. Vapor-vapor permeation 共VVP兲, wherein both sides of the membrane are exposed to water vapor and the driving force for water permeation is created by off-setting the humidity on both sides of the membrane. This method is similar to what it is described as “Standard test methods of water vapor transmission of materials” in ASTM.26
2. Liquid-vapor permeation 共LVP兲, wherein one side of the membrane is in contact with liquid water and the other side is ex-posed to water vapor. The driving force for water permeation is controlled by varying the relative humidity of the vapor.
3. Liquid-liquid permeation 共LLP兲, wherein both sides of the membrane are in contact with liquid water and the driving force for water permeation is created by applying hydraulic pressure.
Using in situ, net water balance measurements on fuel cells, the ex situ permeability data are used to determine which mode of water transport 共VVP, LVP, and LLP兲 applies for an operational PEM for a given set of conditions. These studies provide specific information related to water transport properties of dispersion-cast, Nafion NRE211 membranes and lead to a better understanding of the com-plex water transport phenomenon occurring in PEM fuel cells.
Experimental
Materials.— Nafion membrane 共NRE211, 25 m, DuPont兲 in its H+ form was used as received.27 Membranes boiled at 80°C in 3 wt % H2O2 solution for 2 h, rinsed in deionized Milli-Q water
共Millipore兲 at room temperature several times, and stored in deion-ized water for 24 h prior to use, exhibited identical hydration and permeability characteristics as as-received membranes.
CCM-MEAs.— Carbon-supported Pt was dispersed in 50 wt % methanol in water by sonication for 30 min and 5 wt % Nafion ionomer solution 共DuPont兲 was added to provide 30 wt % Nafion content, based on the solids content, and the mixture was homog-enized by sonication for 1 h more. This catalyst ink was spray de-posited using an automated spray coater 共EFD, Nordson Company兲 on both sides of a NRE211 membrane, mounted on a vacuum table. The deposition was controlled to yield 0.35–0.40 mg cm−2 Pt on
each side of the membrane. Sheets of two-layer gas diffusion layer 共GDL兲 possessing a microporous layer 共SIGRACET 24BC, SGL Carbon Group兲 were used to sandwich the catalyst coated mem-branes 共CCMs兲. The GDL/CCM/GDL was assembled into a 25 cm2 triple serpentine flow design cell 共Fuel Cell Technologies兲 without hot-pressing. Compressible silicone gaskets, 125 m thick, were used on both sides of the MEA to seal the reactant gases and to provide consistent compression, which was confirmed using pres-sure sensitive paper 共Prespres-surex, super-low, Sensor Products Inc.兲.
Ex situ measurement of water transport through Nafion NRE211 membranes.— VVP and LVP.— NRE211 membranes were sand-wiched between two polyethylene 共PE兲 sheets with thermal adhe-sives 共HeatSeal, 1.5 mil, GBC兲. The PE sheets had a punched hole, 34.9–37.1 cm2, through which the membrane was exposed. The
sandwich was thermally sealed using the rolling laminator 共Creative laminator, 9 in., GBC兲. In the case of VVP experiments, the PE/ membrane/PE assembly was placed in a leak-free sample holder, as illustrated in Fig.2a, and docked to a polypropylene container filled with water. The container was placed in an environmental chamber so that the relative humidity 共RH兲 of the head space between the water and membrane was at a saturated point, whereas the RH above the membrane was controlled by the environmental chamber in an isothermal environment. For measurements of LVP, a PE/ membrane/PE assembly was floated on the surface of the water in a stainless steel container and placed in the environmental chamber, so that one side of the membrane was exposed to liquid water, while the other side was exposed to a RH controlled by the environmental chamber, as illustrated in Fig.2b. All measurements were performed at 70°C.
B783
An Espec Model SH-241 environmental chamber was used for VVP and LVP measurements. The temperature and humidity of this chamber were measured with a calibrated dew-point meter 共HMT337, Vaisala Inc.兲 to confirm its humidity-controlling capabil-ity. The temperature was controlled to ⫾0.5°C according to a cali-brated k-type digital thermometer 共Omega兲. Initial LVP and VVP experiments revealed that the water in the container cooled during water permeation due to the endothermicity of water evaporation. In the case of VVP measurements, the temperature of the liquid water dropped by⬃1°C from its initial, set temperature of 70°C, which lowered the RH in the head space between the water and the mem-brane, to⬃96% RH from 100%. Because 1°C is similar in magni-tude to the error of the digital thermocouple, rather than attempting to maintain the VVP cell at the required temperature through exter-nal heating, the 1°C difference was accounted for in the calculated chemical potential gradients, discussed later. In the case of LVP measurements, where rates of water permeation were found to be much greater, and consequently, rates of evaporation to be much greater, the temperature of the liquid water dropped by up to 10°C from its initial temperature of 70°C, which significantly affected the measured rates of water permeation. Hence, the stainless steel con-tainer was externally heated to maintain a constant temperature of 70°C using a 100 W flexible heater 共Watlow electric Mfg. Co.兲,
thermocouple 共K-type TC, Omega Engineering Inc.兲, and external temperature controller 共Model 210, J-KEM Scientific Inc.兲.
As Ge et al.,18Motupally et al.,20Romero et al.,21and Majsztrik et al.22 and others18,20-22 have observed, the flow velocity of the carrier gas on the evaporation side of the membrane influences the rate of water permeation in both VVP and LVP measurements be-cause the local concentration of water at the membrane/gas interface varies with flow velocity. In the present experimental setup, the convection fan in the environmental chamber was used to generate a constant gas flow of humidified air on the evaporation side of the membrane. The magnitude of this flow velocity at the membrane/gas interface was investigated by measuring the evaporation rate of wa-ter from the container. The obtained data was then compared to Hisatake et al.’s study on the rate of water evaporation versus the convective flow velocity at the surface from which evaporation is taking place.28From this investigation, the gas-flow velocities at the membrane surface in our setup were estimated to lie between 1.5–3.2 m s−1, depending on where the container was placed in the
environmental chamber. These values are much larger than those reportedly required to achieve gas-flow–independent rates of water permeation.18,20,22For example, Majsztrik et al. observed maximum rates of water permeation when the flow velocity of the dry N2gas
is ⬎⬃ 0.17 and at 0.37 m s−1at 70°C for vapor/N115/dry gas and
liquid/N115/dry gas configurations, respectively.29Romero et al. re-ported He gas flow velocities of ⬎0.008 and ⬎0.025 m s−1 for flow-independent water permeation through vapor and liquid equili-brated N115 membranes at 70°C.21Ge et al. observe the maximum flow-independent water permeation through a N112-based MEA to occur for N2gas flow velocities of 0.13 and 0.81 m s−1for vapor/
MEA/dry gas and liquid/MEA/dry gas configurations, respectively, at 80°C.18Thus, the flow velocity at the evaporation interface of the membrane in our VVP and LVP setups are sufficiently high to avoid the formation of stagnant layers of humidified air at the membrane/ gas interface, leading to the important assertion that water perme-ation is insensitive to small variperme-ations in convective velocities that may be present in the environmental chamber.
For VVP and LVP measurements, the container containing water and the PE/membrane/PE assembly was removed from the environ-mental chamber at regular intervals and weighed. The initial weight of the container was weighed after the temperature of the container was stabilized at 70°C, which was typically 2 h. The mass change of the container was weighed in a typical interval of 2–6 h for both VVP and LVP measurements. Rates of VVP and LVP are calculated as water fluxes through the membrane 共JVVPand JLVP, respectively兲.
For LVP measurements, the rate of evaporation from a water-filled container onto which an identically sized PE film, without the punch hole, was measured, in order to determine errors induced by direct evaporation of water from the small gap between the perimeter of the PE film and the container’s wall. This background rate of evapo-ration 共0.13–0.03 mmol s−1per container, depending on the RH兲 is
⬍20–23% of the rate or permeation through the membrane and was subtracted from the measured weight loss of the container. For VVP measurements, the leak rate from the membrane holder and the polypropylene container was⬃2.1 ⫻ 10–4mmol s−1共⬍0.5% of the
total rate of water permeation兲 at 70°C and 40% RH condition, which we consider to be negligible.
Water fluxes for VVP and LVP共JVVP,JLVP兲 are expressed below
where ⌬M /⌬t represents the evaporation rate of water, MH2Oand A
as the molar mass of water and the geometrical area of the mem-brane JVVP= 共⌬M /MH2O⌬t兲PEM AVVP 关1兴 JLVP= 共⌬M /MH2O⌬t兲PEM−共⌬M /MH2O⌬t兲background ALVP 关2兴 VVP and LVP fluxes were determined from four series of measure-ments taken from two different pieces of membrane. Errors are
de-Figure 2. 共Color online兲 Schematic diagram of the 共a兲 VVP and 共b兲 LVP experimental setups.
fined as the standard deviation. The stability and reproducibility of this setup was found satisfactory. For example, the variation of the measured rates of water permeation through a given membrane for the largest RH differential 共40% RH at 70°C兲 was accurate to ⫾0.00051 mol m−2s−1for VVP measurements, i.e., 关⫾5% range in
variance from the averaged value and ⫾0.0079 mol m−2s−1共⫾6%
range兲 for LVP兴.
Measurement of liquid-liquid permeation.— Water permeation through the membrane driven by a hydraulic pressure gradient was measured using the setup illustrated in Fig. 3. A syringe 共GASTIGHT no. 1025, Hamilton Co. with PHD2000, Havard Ap-paratus兲 filled with deionized water, a mass flowmeter 共2.0 and 20 L/min, -FLOW, Bronkhorst HI-TEC兲, and a pressure trans-ducer 共PX302-100GV, Omega Engineering Inc.兲 were connected in series with 1/8 in. o.d. PTFE tubings. The membrane was installed in a cell made in-house, consisting of a PTFE-coated stainless steel screen to prevent rupture of the membrane and an O-ring. The cell was heated on a mantle and maintained at 70°C. A constant flow of water throughout the system was maintained until the desired tem-perature and pressure was reached. Measurements were taken when the upstream pressure indicated by the pressure transducer deviated by ⬍1% of the measured pressure. This was repeated at least 10 times in the pressure range of 0–1.2 atm. The apparatus was con-trolled and monitored using Labview software.
In situ measurement of water transport through a fuel cell.— A fuel cell test station 共850C, Scribner Associates兲 was used to control and supply gases to the 25 cm2triple serpentine flow design, single
cell 共Fuel Cell Technologies兲. Values of vapor pressure used to cal-culate the relative humidity were taken from a literature source.30 The cell temperature was 70°C. Water-cooled condensers 共⬃0.6 m long for the anode and⬃1 m long for the cathode兲 were installed at the exhaust manifolds of the cell to collect the water.
When the open-circuit voltage reached 0.95 V, 0.4–0.6 A cm−2 was applied to maintain a cell potential of 0.5–0.7 V. The flow rate of the H2and air were supplied in the stoichiometric ratio of 2.0 and
3.0. To avoid reactant starvation, minimum flow rates of the gases were set to be 0.25 L min−1. This corresponds to the fuel cell
oper-ated at constant flow mode up to 0.4 and 0.05 A cm−2for anode and
cathode, respectively. Polarization curves were recorded in 50 mV increments, stabilized for 3 min at each point. Eight polarization curves were recorded for each operating condition.
The net water flux was measured by collecting the water from anode outlet, subtracting the amount of water introduced as humidi-fied gas. The conditioned cell was operated at the desired constant current for at least 60 min before the first measurement and 20 min for the subsequent measurements. After steady state was achieved, water was directed to the condensers for collection until ⬎3.0 g of water was collected.
The net water flux through the PEM was determined from the amount of water collected at the anode. In this case, the loss or gain of water at the anode outlet was normalized to the MEA’s geometri-cal active area to determine the flux. In this case, JNETa is given by
JNETa =
Ja-out− Ja-in
Acell 关3兴
where Ja-in is the flux of water introduced and determined from
calibration measurements, while Ja-out is the measured amount of
water collected from the anode.
The triple serpentine flow channel design used in this work was suited to the nature of this type of water balance measurement. This flow channel design allowed the set gas flow rates to be relatively small that kept the ratio of JNETa and Ja-in to be in the range of
0.3–0.5 and 1.4–1.6 for the tested conditions 共i兲 and 共ii兲, which are defined later. However, it has to be noted that the disadvantage of this design is the inhomogeneity of the humidity along the channel under high current density. For instance, humidity of the saturated anode stream was found to decrease to 80% RH at the outlet and humidity of the relatively dry 共40% RH兲 anode stream was found to increase close to saturation at the outlet at the highest current den-sities.
Results and Discussion
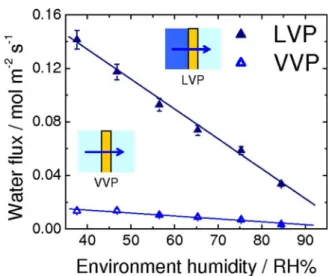
Ex situ measurements of water permeation.— The rates for VVP and LVP of water through NRE211 membrane are given in Fig.4. For VVP measurements, one side of the membrane was ex-posed to air humidified at 96% RH, while the RH of the opposite side was varied between 38% and 85% according to our calibration. For LVP measurements, the membrane was exposed to liquid water on one side while the RH of the other side was varied. For both types of measurements, a water concentration gradient is developed across the membrane, which serves to transport water to the side where the chemical activity of water is lower 共i.e., the side exposed to lower RH兲. The flux of water is observed to increase linearly with a reduction in relative humidity of the “drier” side. The rate of water permeation for the case of LVP is much greater than for VVP. The corresponding water fluxes through NRE211 membrane correspond-ing to LLP, in which transport is induced by application of hydraulic pressure, are shown in Fig.5. The permeance was determined from the linear slope of this plot to be 8.83 ⫻ 10−12m Pa−1s−1. The
thickness-normalized permeability is 2.43 ⫻ 10−16m2Pa−1s−1,
which is similar in value to other reports for Nafion membranes.31,32 In order to quantitatively compare VVP, LVP, and LLP, and to compare the different water-transport properties among various PEMs for fuel cell applications, the differential chemical potential of water across the membranes was calculated, as described below.
Figure 3. 共Color online兲 Schematic of the LLP setup. Syringe, liquid mass flow-meter, and the pressure transducer were placed in an isothermal environment of 20°C. The cell was heated separately at 70°C.
B785
Chemical potential of vapor, liquid water, and pressurized liquid water.— The chemical potentials of water in the liquid and vapor phase at various temperatures and 1 atm are given as33
liqគT共x兲O = liqគSTD O + ␥ liq共T共x兲 − TSTD兲 关4兴 vapគT共x兲O = vapគSTD O + ␥ vap关T共x兲 − TSTD兴 关5兴
where liqគSTDO and
vapគSTD
O are the standard chemical potentials of liquid water and water vapor: −237.18 and −228.59 kJ mol−1, re-spectively. ␥ represents the temperature coefficient for the chemical potential of water in the liquid and vapor phase: −69.9 and −188.7 J mol−1K−1, respectively. The chemical potentials of liquid and vapor at 343 K, liqគ343 KO and vapគ343 KO , are calculated to be
−240.33 and −237.08 kJ mol−1, respectively.
From the standard chemical potential of water vapor at 70°C, the chemical potentials of water vapor at various relative humidities were calculated according to Eq.6, where y indicates the relative humidity 共expressed as percent兲 and R, T, psat-vap, and ptot
corre-spond to the universal gas constant, temperature of the environment,
saturated vapor pressure at that temperature, and ambient pressure, respectively.34 The chemical potentials of water vapor at various humidities at 70°C calculated from Eq.6are plotted in Fig.6a. As the relative humidity is increased toward saturation, the chemical potential of water vapor approaches that of liquid water
vapគRH共y兲= vapគ343 K
O + RT ln
冋
共y/100兲psat-vapptot
册
关6兴 The chemical potential of liquid water under pressure was esti-mated using Eq.7, where p共z兲, pSTD, and ␦ indicate the applied
pressure, standard pressure, and the pressure coefficient for water. Here, the standard pressure is 1 atm and the coefficient, ␦, is 1.990 J mol−1atm−1.33The calculated chemical potentials of liquid
water as a function of pressure are plotted in Fig.6b
liqគp共z兲= liqគ343 K
O
+ ␦关p共z兲 − pSTD兴 关7兴
As illustrated in Fig. 6, the chemical potential of water vapor in-creases nonlinearly with relative humidity, whereas the chemical potential of liquid water increases linearly with pressure. Moreover, the variation in chemical potential of the latter is much smaller in magnitude. Equations8and9define the difference in chemical po-tentials of water for VVP and LVP measurements, where y corre-sponds to percent RH. Similarly, Eq.10describes the difference in chemical potential created for LLP measurements
⌬VVPគRH共y兲= vapគRH共96%兲− vapគRH共y兲 关8兴
⌬LVPគRH共y兲= liqគ343 KO −
vapគRH共y兲 关9兴 Figure 4. 共Color online兲 Rate of water permeation through NRE211 at 70°C
as a function of relative humidity of the drier side of the membrane. LVP configuration: liquid water/membrane/variable RH; VVP configuration: 96% RH/membrane/variable RH.
Figure 5. 共Color online兲 Rate of water permeation through NRE211 at 70°C as a function of differential hydraulic pressure 共LLP兲.
Figure 6. 共Color online兲 共a兲 Calculated chemical potential of water vapor for the range of 30–100 %RH at 70°C. 共b兲 Calculated chemical potentials of pressurized liquid water for the range of 0–1.5 atm above ambient pressure at 70°C.
⌬LLPគP共z兲= liqគP共z兲− liqគ343 K
O
关10兴 The differential chemical potential across the membrane consti-tutes the driving force responsible for water permeation through the membrane. The water fluxes reported in Fig.4and5are thus replot-ted in Fig.7against the difference in chemical potentials of water on the other side of the membrane. The break in the axis is necessary because of the wide range of ⌬ values generated in the LLP and LVP/VVP experiments. For all three types of water permeation mea-surements, the water flux was observed to increase linearly with increasing ⌬. Values of permeation coefficient 共permeance兲, expressed as a function of chemical potential, were obtained from the slopes of the plots to be 0.0059 共⫾4.6 ⫻ 10−4兲,
0.052 共⫾1.7 ⫻ 10−3兲, and 26 共⫾0.80兲 mol2m−2s−1kJ−1
for VVP, LVP, and LLP measurements, respectively. Normalizing these values to the thickness of the hydrated membrane 共28 m兲 provided water permeability values of 1.6 ⫻ 10−12
共⫾1.3 ⫻ 10−13兲, 1.5 ⫻ 10−11 共⫾4.8 ⫻ 10−13兲, and 7.4 ⫻ 10−9
共⫾2.2 ⫻ 10−10兲 mol2cm−1s−1J−1, for VVP, LVP, and LLP
mea-surements, respectively.
The largest of the water permeation coefficients is obtained when liquid water is in contact with both sides of the membrane 共LLP兲, the next largest when liquid is in contact with one side 共LVP兲, and the smallest when both sides are exposed only to water vapor 共VVP兲. LLP permeability coefficients are ⬃500 and 5000 times greater than LVP and VVP permeability coefficients, respectively. Two explanations are provided to account for this trend. The hydra-tion state of the membrane is known to be an influential factor for water transport through the membrane, with larger water contents leading to higher degrees of swelling and more facile water trans-port. As shown by numerical simulations and experimental measure-ments, and described by Kreuer and Paddison, “pores” of Nafion expand on hydration. In our measurements, membranes exposed to liquid water on both sides 共LL兲 are expected to contain a higher content of water than those exposed to vapor on one side 共LV兲, which in turn, is expected to contain more water than those exposed to vapor on both sides 共VV兲. The second explanation involves con-sideration of interfacial water transport 共adsorption and desorption of water兲, which is known to play a significant role in the overall permeation of water, as discussed by Majsztrik,29 Romero,21 and recently quantified by Monroe et al.35and Aotani et al.36In the LLP case, the formation of a liquid-membrane interface and a membrane-liquid interface is expected to facilitate ingress and egress of water into and out of the membrane, relative to the LVP case, for which
water from the membrane must egress into the vapor phase, and relative to the VVP case, for which water must ingress from, and egress to, the vapor phase.
Despite the fact that the formation of liquid/membrane interfaces leads to a high permeability coefficient for water, the absolute per-meability of water is observed to be largest for the LVP measure-ments 共see Fig.7兲. This is because the presence of vapor on one side of the membrane creates a much larger chemical potential driving force 共three to four orders of magnitude greater than for the LLP system兲. ⌬ is relatively small for all reasonable hydraulic pressures used in the LLP measurement, because pressure is an ineffective method for raising the chemical potential of a liquid. The presence of a liquid-membrane interface, however, is noticeable when com-paring the absolute permeability of water under LVP conditions rela-tive to VVP conditions. The absolute permeability of water for the LVP measurements is much greater than for VVP measurements, even though ⌬ is similar for both. Clearly, interfacial phenomenon 共i.e., a liquid/membrane interface vs a vapor/membrane interface兲 is of great importance to the permeability of water. A similar conclu-sion is stated by Majsztrik22and others.21,36
In situ measurements of water permeation.— Polarization curves and water transport through the MEA.— Polarization curves for NRE211-based MEAs at 70°C and under two different operating conditions are presented in Fig.8a. The operating conditions are: 共i兲 wet anode 共⬎100% RH, TDP= 75°C兲 and dry cathode 共40% RH兲
and 共ii兲 dry anode 共40% RH兲 and wet cathode 共⬎100% RH, TDP
= 75°C兲.
The highest current was observed for case 共i兲, when the anode was fully humidified and the cathode was operated with air
intro-Figure 7. 共Color online兲 Rates of water permeation at 70°C as a function of chemical potential differential.
Figure 8. 共Color online兲 共a兲 Polarization curves for NRE211-based MEAs obtained under different conditions. 共b兲 Net water flux as a function of cur-rent density obtained under diffecur-rent conditions. Dashed and solid lines in-dicate the estimated EOD flux for Nd= 0.5 and 1.0, respectively. 共i兲 -
䊏-RHanode⬎100%, RHcathode= 40%, 共ii兲 -䉱- RHanode= 40%, RHcathode
⬎100%. Cell temperature, 70°C. H2and air were supplied in a
stoichio-metric ratio 2.0: 3.0 at ambient pressure.
B787
duced at lower humidity. Under these conditions, 0.97 A cm−2was
generated at 0.6 V. When the anode was fed with gases at a lower humidity and the cathode was fully humidified, the single-cell per-formance reduced to 0.67 A cm−2at 0.6 V. The correlations of
per-formance with the different operating conditions is not unexpected: For case 共i兲, reducing the humidity at the cathode reduces the like-lihood of its flooding, while fully humidifying the anode reduces its propensity to dehydrate; case 共ii兲 promotes flooding at the cathode and dehydration of the anode, relative to case 共i兲. The performance under these conditions is discussed later.
Water transport through NRE 211 MEAs.— Net water fluxes at the anode were measured for fuel cells operated under the same condi-tions described above. These fluxes are plotted in Fig.8bas a func-tion of current density. In case 共i兲, a positive water flux 共anode to cathode兲 was observed. This is because both the chemical potential gradient, ⌬, formed by application of the differentially humidified gases, and the EOD flux act in concert to direct water from the anode to the cathode. For current densities up to⬃0.4 A cm−2, the
flux of water is⬃0.020 mol m−2s−1. In this regime, where the flux
of water due to EOD is not significant with respect to the measured flux, the concentration gradient driven fluxes 共i.e., VVP or LVP兲, is the major contributor to the net water flux. At higher current densi-ties 共i.e., ⬎0.6 A cm−2兲, the EOD flux plays a more significant role
in the net water transport and the water flux is observed to increase steadily as more current is drawn.
In case 共ii兲, a negative water flux 共cathode to anode兲 is observed. For low current densities 共⬍0.4 A cm−2兲, the net water flux is
⬃0.015 mol m−2s−1. As in case 共i兲, EOD is negligible in this region
and, thus, the net water flux is due to the permeation of water re-sulting from the chemical potential gradient that is formed from a fully humidified cathode and partially humidified anode. As the cur-rent density is increased 共above 0.6 A cm−2兲, the net water flux
to-ward the anode increases, despite the fact that EOD brings water from the anode to the cathode.
The fluxes of water, shown in Fig.8b, when extrapolated to zero current are 0.018 and 0.014 mol m−2s−1for case 共i兲 and 共ii兲,
respec-tively. The membrane is expected to be exposed to saturated water vapor on one side and 40% RH, i.e., they can be described falling under the category VVP according to the terminology of ex situ measurements 共see Fig.4, VVP plot兲. The similarity of the in situ and ex situ water permeability data are consistent with this. Thus at OCV, the PEM appears to be exposed to water vapor on both sides despite one of the gases being oversaturated with moisture.
When current is drawn from the cell, water is generated at the cathode and the flux of protons creates an EOD that draws addi-tional water to the cathode. The EOD is a nebulous parameter to measure or quantify, because the coefficient, Nd, is highly dependent
on the water content of the membrane, as illustrated in TableI, and can vary largely with current density and the net direction of water transport in the membrane. In the context of our work, we consider the scenarios where Nd= 0.5 and 1.0, as Ge et al. have reported
EOD coefficients to lie in this range for 0.3–1.0 for vapor equili-brated MEAs.37Estimates of EOD, ignoring forward or back trans-port of water, for Ndvalues of 0.5 and 1.0 are plotted in Fig.8bas
a function of current density.
EOD for Nd= 0.5 is particularly significant in this work as the
plot is near parallel to the net water flux vs current for fuel cells operated under conditions described as case 共i兲. At these current densities共1.0–1.4 A cm−2兲, the measured net water flux increases
linearly with current, which is an expected observation when the rate of back transport has reached a limiting value and where further increases in water flux are caused simply by a linear increase in EOD with current.
For fuel cells operated under conditions described as case 共i兲, the measured net water fluxes lie well below those estimated from the EOD flux for Nd= 0.5, except for very low current densities, where
the flux of water is dominated by simple permeation. This estimation of Nd= 0.5 is a conservative estimation according to other literature
values. Comparing the net water flux of water at 1.0, 1.2, and 1.4 A cm−2 with the flux theoretically generated by EOD 共N
d
= 0.5兲, it is deduced that the actual net water flux of water is con-sistently 0.022 mol m−2s−1lower than the estimated EOD at each
current density. This suggests that back diffusion of water to the anode plays a significant role in determining the water balance. This raises the question as to which mode of permeation is operating: LLP, LVP, or VVP? LLP can be quickly discounted because the differential pressure generated in the cell would have to be unrea-sonably high to achieve this rate of permeation. For instance, ex situ LLP measurements indicate that it requires 0.46 atm differential pressure to support a water flux of 0.022 mol m−2s−1, as can be derived from Fig.5, but no such pressure is applied to the fuel cell and it is unlikely the cell would generate this pressure internally. Furthermore, it is highly unlikely that the PEM at the anode is saturated at liquid water; given that it is exposed only to water vapor and that the net flow of water occurs from anode to cathode. Simi-larly, VVP can be eliminated as a mode for water transport because permeabilities in excess of 0.014 mol m−2s−1are only achievable, according to Fig.4, when the RH on the drier side ⬍38%. Recall that in case 共i兲 the anode is fed with 100% RH hydrogen while the cathode is fed with 40% RH, but water is produced at the cathode and accumulated at the cathode by EOD, so that the effective RH at the cathode at high current is expected to be substantially higher than 40%. Of the three scenarios for water permeation, only LVP is capable of sustaining the rate of water permeation required to ac-count for back transport. As a substantial amount of water is generated/accumulates at the cathode under high current it is not unreasonable to consider that the PEM on the cathode side is ex-posed to liquid water. The RH of the hydrogen at the anode inlet is at saturation, but the outlet humidities are calculated to be decreased to 99–85 % RH, based on the amount of water introduced and trans-ported, which could generate a chemical potential gradient and may explain why water is transported toward the anode. Figure4共LVP兲 indicates that the water permeability is 0.034 mol m−2s−1when the Table I. Comparison of reported Ndvalues (electro-osmotic drag coefficient value) for Nafion membranes.
Ex situ Ndvalue comparison
T 共°C兲 Hydration state Nd共H2O/H+兲 PEM
Zawodzinski et al.38 30 22
共H2O/SO32−兲 ⬃2.5 Nafion 117
Zawodzinski et al.38 30 1–14
共H2O/SO32−兲 ⬃0.9 Nafion 117
Fuller and Newman39 25 1–14
共H2O/SO32−兲 0.2–1.4 Nafion 117
Ise et al.40 27 11–20
共H2O/SO32−兲 1.5–3.4 Nafion 117
Xie and Okada41 Ambient 22
共H2O/SO32−兲 ⬃2.6 Nafion 117
Ge et al.37 30–80 0.2–0.95 0.3–1.0 Nafion 117
Ge et al.37 30–80 Contact with liquid water 1.8–2.6 Nafion 117
Aotani et al.36 70 2–6共H2O/SO3
2−兲 2.0–1.1 Nafion 115
Ye et al.6 80 3–13共H2O/SO3
membrane is exposed to liquid water on one side and⬃84% RH vapor on the other, which is capable of sustaining the level of back transport calculated above 共0.022 mol m−2s−1兲. In summary, the
back transport of water for fuel cells operated at high current under case 共i兲 关wet anode 共⬎100% RH兲 and dry cathode 共40% RH兲兴 is explained by LVP, wherein the membrane on the cathode side is exposed to liquid water while the anode side is exposed to vapor.
The influence of EOD and back transport on the net water flux for MEAs operated under conditions described by case 共ii兲 关dry anode 共40% RH兲 and wet cathode 共⬎100% RH兲兴 can be reasoned using similar arguments, but taking into account that the initial hu-midities are reversed. Assuming for sake of discussion that Nd
= 0.5, the EOD flux is 0.052 mol m−2s−1 toward the cathode at 1.0 A cm−2, as given in Fig. 8b. The actual net flux of water is
−0.027 mol m−2s−1, toward the anode, at 1.0 A cm−2. Clearly, back
transport of water offsets EOD. The difference in water fluxes indi-cates that back transport is⬃0.079 mol m−2s−1. If the cathode side
of the membrane is considered as being wet and the anode side exposed to 40% RH, then it is reasonable to assume from Fig.4, that LVP is capable of sustaining the level of back transport.
Conclusion
Liquid-liquid permeation 共LLP兲, liquid-vapor permeation 共LVP兲, and vapor-vapor permeation 共VVP兲 fluxes were measured for dis-persion cast, 25 m, NRE211 membrane at 70°C. Water fluxes in-creased with increase in chemical potential gradient across the mem-brane for all three types of permeations. Water permeation coefficients 共i.e., water flux values normalized to the chemical po-tential gradient of water and membrane thickness兲 were determined for each scenario of water-permeations. The largest water perme-ation coefficient was obtained for LLP due to the high hydrperme-ation state of the membrane as well as favorable water sorption and de-sorption processes at the membrane-bulk water interface. However, the difference in chemical potential of water across the membrane created by application of reasonable hydraulic pressure gradients are calculated to three orders of magnitude smaller than those generated by scenarios described by VVP and LVP. The significance of the chemical potential gradient of water across the membrane is signifi-cant in determining the water flux in operating fuel cells.
The water flux through this thin Nafion membrane is largest when the membrane is exposed to liquid on one side and vapor on the other. LVP water transport is largely responsible for regulating water balance within the operating MEA. This leads to a conclusion that formation of a chemical potential gradient for water and good hydration at the interface and across the membrane allows the mem-brane to self-regulate water content across the operating MEA. When both these factors work together, in the cases of LVP, the water permeation flux is large enough to offset the substantial EOD flux in an operating fuel cell. Learning from this, we believe this experimental approach and the results obtained will serve to en-hance our understanding of the interaction between water and PFSA-based PEMs. For example, water balance across NRE211-based MEAs may be designed and optimized for a particular set of operating conditions, and the permeation coefficients reported here may be useful in determining required water permeability criteria for membranes in order that they self-regulate water balances in operating fuel cells.
Acknowledgments
The authors gratefully acknowledge financial support from the NRC-National Hydrogen and Fuel Cell Program. The authors thank Dr. Ken Shi, Dr. Xinsheng Zhao, Dr. Michael Eikerling, Dr. Kourosh Malek, Dr. Marc Secanell, Dr. Tatiana Romero, and Dr. Walter Mérida for fruitful discussions. The authors also thank SFU machine shop and NRC-IFCI design studio for fabrication of the LLP cell and VVP/LVP cells.
NRC-IFCI assisted in meeting the publication costs of this article.
List of Symbols
Acell geometrical active area of the MEA, m−2
ALVP exposed membrane area of the LVP cell, m−2
AVVP exposed membrane area of the VVP cell, m−2
Ja-in flow rate of water introduced to the cell at anode, mol s−1
Ja-out flow rate of water exhausted at anode, mol s−1
JNETa calculated net water flux through the MEA derived from the
an-ode stream, mol m−2s−1
JLLP liquid-liquid permeation flux, mol m−2s−1
JLVP liquid-vapor permeation flux, mol m−2s−1
JVVP vapor-vapor permeation flux, mol m−2s−1
MH2O molecular weight of water, g mol−1
Nd electro-osmotic drag coefficient
psat-vap saturate vapor pressure at 343 K, atm
pSTD standard pressure共1 atm兲, atm
ptot total pressure, atm
p共z兲 pressure, z, atm
R universal gas constant, J K−1mol−1
TSTD standard temperature共289 K兲, K
T共x兲 temperature, x, K Greek
 NET water transport coefficient
␥liq temperature coefficient for chemical potential of liquid water, J
mol−1K−1
␥vap temperature coefficient for chemical potential of water vapor, J
mol−1K−1
␦liq pressure coefficient for chemical potential of liquid water, J
mol−1atm−1
⌬LLPគp共z兲 difference in chemical potential between liquid water at 1 atm
and liquid water at z atm at 343 K, kJ mol−1
⌬LVPគRH共y兲 difference in chemical potential between vapor at relative
humid-ity y% and liquid water at 343 K, 1 atm, kJ mol−1
⌬VVPគRH共y兲 difference in chemical potential between vapor at relative
humid-ity y% and 96% RH water vapor at 343 K, 1 atm, kJ mol−1
⌬M mass change of the water filled container, g ⌬t duration of the experiment, s
liqគSTD
O
standard chemical potential of liquid water at 278 K, 1 atm, kJ mol−1
liqគT共x兲O
chemical potential of liquid water at temperature x, 1 atm, kJ mol−1
vapគSTDO standard chemical potential of water vapor at 278 K, 1 atm, kJ
mol−1
vapគT共x兲O chemical potential of water vapor at temperature x, 1 atm, kJ mol−1
vapគ343 KO chemical potential of water vapor at infinitely diluted
concentra-tion, 343 K, 1 atm, kJ mol−1
liqគ343 KO chemical potential of liquid water, at 343 K, 1 atm, kJ mol−1
vapគRH共y兲 chemical potential of water vapor at y% RH, 343 K, 1 atm, kJ
mol−1
liqគP共z兲 chemical potential of liquid water at 343 K, z atm, kJ mol−1
References
1. T. A. Zawodzinski, C. Derouin, S. Adzinski, R. J. Sherman, V. T. Smith, T. E. Springer, and S. Gottesfeld, J. Electrochem. Soc., 140, 1041 共1993兲.
2. K. H. Choi, D. H. Peck, C. S. Kim, D. R. Shin, and T. H. Lee, J. Power Sources,
86, 197 共2000兲.
3. X. Ren and S. Gottesfeld, J. Electrochem. Soc., 148, A87 共2001兲.
4. T. Murahashi, M. Naiki, and E. Nishiyama, J. Power Sources, 162, 1130 共2006兲. 5. F. Liu, G. Lu, and C. Y. Wang, J. Membr. Sci., 287, 126 共2007兲.
6. X. Ye and C. Y. Wang, J. Electrochem. Soc., 154, B676 共2007兲. 7. X. Ye and C. Y. Wang, J. Electrochem. Soc., 154, B683 共2007兲.
8. T. E. Springer, T. A. Zawodzinski, and S. Gottesfeld, J. Electrochem. Soc., 138, 2334 共1991兲.
9. G. J. M. Janssen and M. L. J. Overvelde, J. Power Sources, 101, 117 共2001兲. 10. Q. Yan, H. Toghiani, and J. Wu, J. Power Sources, 158, 316 共2006兲. 11. Y. Cai, J. Hu, H. Ma, B. Yi, and H. Zhang, Electrochim. Acta, 51, 6361 共2006兲. 12. W. R. Vieth, Diffusion In and Through Polymers, p. 5, Oxford University Press,
New York 共1979兲.
13. D. Rivin, C. E. Kendrick, P. W. Gibson, and N. S. Schneider, Polymer, 42, 623 共2000兲.
14. D. R. Morris and X. Sun, J. Appl. Polym. Sci., 50, 1445 共1993兲.
15. K. K. Pushpa, D. Nandan, and R. M. Iyer, J. Chem. Soc., Faraday Trans. 1, 84, 2047 共1998兲.
16. P. Krtil, A. Trojanek, and Z. Samec, J. Phys. Chem. B, 105, 7979 共2001兲. 17. D. J. Burnett, A. R. Armando, and F. Thielmann, J. Power Sources, 160, 426
共2006兲.
18. S. Ge, X. Li, B. Li, and I. M. Hsing, J. Electrochem. Soc., 152, A1149 共2005兲. 19. J. P. G. Villaluenga, B. Seoane, V. M. Barragan, and C. Ruiz-Bauza, J. Colloid
B789
Interface Sci., 268, 476 共2003兲.
20. S. Motupally, A. J. Becker, and J. W. Weidner, J. Electrochem. Soc., 147, 3171 共2000兲.
21. T. Romero, Ph.D. Dissertation, University of British Columbia 共2008兲. 22. P. W. Majsztrik, M. W. Satterfield, A. B. Bocarsly, and J. B. Benzinger, J. Membr.
Sci., 301, 93 共2007兲.
23. A. Z. Weber and J. Newman, Chem. Rev. (Washington, D.C.), 104, 4679 共2004兲. 24. M. Eikerling, Y. Kharkats, A. A. Kornyshev, and Y. Volfkovich, J. Electrochem.
Soc., 145, 2684 共1998兲.
25. A. Z. Weber, Ph.D. Dissertation, University of California, Berkeley 共1999兲. 26. ASTM Standard E96-94, Standard Test Methods for Water Vapor Transmission of
Materials, p. 696, ASTM, Philadelphia 共1994兲.
27. For further information, obtain technical product data sheet DuPont, Nafion PFSA Membranes NRE-211 by DuPont on Nafion PFSA Membranes NRE-212. 28. K. Hisatake, S. Tanaka, and Y. Aizawa, J. Appl. Phys., 73, 7395 共1993兲. 29. P. W. Majsztrik, Ph.D. Dissertation, Princeton University 共2008兲.
30. D. R. Lide, Handbook of Chemistry and Physics, Vol. 78, pp. 6–8, CRC Press,
Boca Raton 共1997兲.
31. C. E. Evans, R. D. Noble, S. Nazeri-Thompson, B. Nazeri, and C. A. Koval, J.
Membr. Sci., 279, 521 共2006兲.
32. T. Okada, H. Satou, M. Okuno, and M. Yuasa, J. Phys. Chem. B, 106, 1267 共2002兲. 33. G. Job and H. Herrmann, Eur. J. Phys., 27, 353 共2006兲.
34. H. A. J. Oonk and M. T. Calvet, Equilibrium between Phases of Matter, p. 77, Springer, The Netherlands 共2008兲.
35. C. W. Monroe, T. Romero, W. Rida, and M. Eikerling, J. Membr. Sci., 324, 1 共2008兲.
36. K. Aotani, S. Miyazaki, N. Kubo, and M. Katsuta, ECS Trans., 16共2兲, 341 共2008兲. 37. S. Ge, B. Yi, and P. Ming, J. Electrochem. Soc., 153, A1443 共2006兲.
38. J. Zawodzinski, T. E. Springer, F. Uribe, and S. Gottesfeld, Solid State Ionics, 60, 199 共1993兲.
39. T. F. Fuller and J. Newman, J. Electrochem. Soc., 139, 1332 共1992兲. 40. M. Ise, K. D. Kreuer, and J. Maier, Solid State Ionics, 125, 213 共1999兲. 41. G. Xie and T. Okada, J. Electrochem. Soc., 142, 3057 共1995兲.