https://doi.org/10.4224/17506221
READ THESE TERMS AND CONDITIONS CAREFULLY BEFORE USING THIS WEBSITE. https://nrc-publications.canada.ca/eng/copyright
Vous avez des questions? Nous pouvons vous aider. Pour communiquer directement avec un auteur, consultez la première page de la revue dans laquelle son article a été publié afin de trouver ses coordonnées. Si vous n’arrivez pas à les repérer, communiquez avec nous à [email protected].
Questions? Contact the NRC Publications Archive team at
[email protected]. If you wish to email the authors directly, please see the first page of the publication for their contact information.
Archives des publications du CNRC
For the publisher’s version, please access the DOI link below./ Pour consulter la version de l’éditeur, utilisez le lien DOI ci-dessous.
Access and use of this website and the material on it are subject to the Terms and Conditions set forth at
Progress Report: Ship Safety and Performance in Pressured Ice Zones
Kubat, Ivana
https://publications-cnrc.canada.ca/fra/droits
L’accès à ce site Web et l’utilisation de son contenu sont assujettis aux conditions présentées dans le site
LISEZ CES CONDITIONS ATTENTIVEMENT AVANT D’UTILISER CE SITE WEB.
NRC Publications Record / Notice d'Archives des publications de CNRC:
https://nrc-publications.canada.ca/eng/view/object/?id=cd63747f-4cb7-4706-bced-6dfbf40b49bc https://publications-cnrc.canada.ca/fra/voir/objet/?id=cd63747f-4cb7-4706-bced-6dfbf40b49bc
Progress Report: Ship Safety and Performance in
Pressured Ice Zones
Ivana Kubat
Canadian Hydraulics Centre National Research Council of Canada
Ottawa, Ont. K1A 0R6 Canada
Technical Report CHC-TR-064
ABSTRACT
The objective of this project is to provide real-time information to ships operating in the Arctic to minimize safety and operational problems due to pressured ice conditions. This will be done by providing real-time information and on-board predictive system to ship operators. The output will give ship captains information on the development of pressured ice along shipping routes and on locations of pressured ice. Such information is not available now. This project will develop and implement new technology to improve advising on ice pressure development along specific shipping lanes in the Arctic. Computer code will be developed by the Canadian Hydraulics Centre of National Research Council of Canada (NRC-CHC) and delivered to Canadian Ice Service (CIS), and potentially to ship operators. NRC-CHC will work with CIS and other partners on the implementation and testing of the system.
This report describes progress made during the second year of the four-year project. Start date of the entire project was April 1, 2007 and the completion date is March 31, 2011.
TABLE OF CONTENTS ABSTRACT... 1 TABLE OF CONTENTS... 3 LIST OF FIGURES ... 5 1.0 BACKGROUND ... 7 2.0 DELIVERABLES... 8 2.1 Progress up-to-date ... 8
3.0 CAPTAINS RESPONSE TO THE QUESTIONNAIRE AND ANALYSIS OF ICE PRESSURE ZONES ... 10
3.1 Summary of Captains responses to the questionnaire... 10
3.2 The Ice Forecasting Tool ... 11
3.3 Ice Pressure Zones simulations ... 11
4.0 SUMMARY ... 15 5.0 ACKNOWLEDGEMENTS ... 15 6.0 REFERENCES ... 15 APPENDIX A ... 17 APPENDIX B ... 25 APPENDIX C ... 29
LIST OF FIGURES
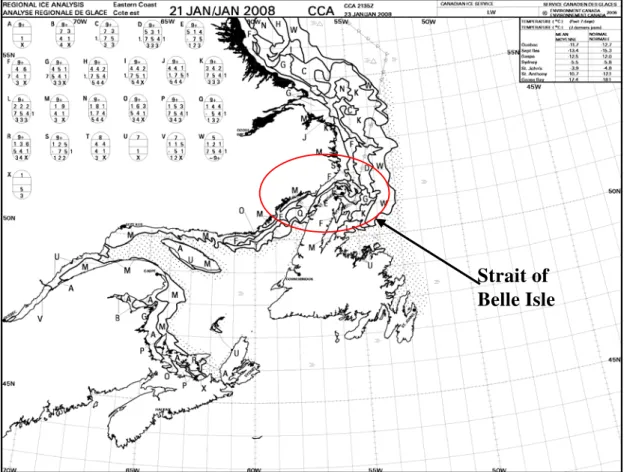
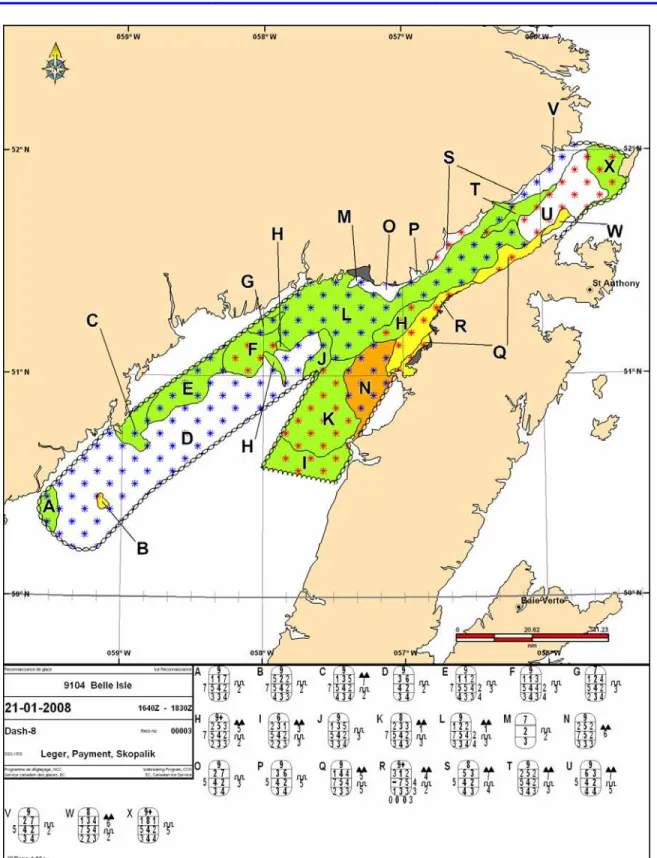
Figure 1: Regional Ice chart presenting ice conditions at the start of the run on January 21, 2008... 12 Figure 2: Reconnaissance chart presenting detailed ice conditions in the Strait of Belle
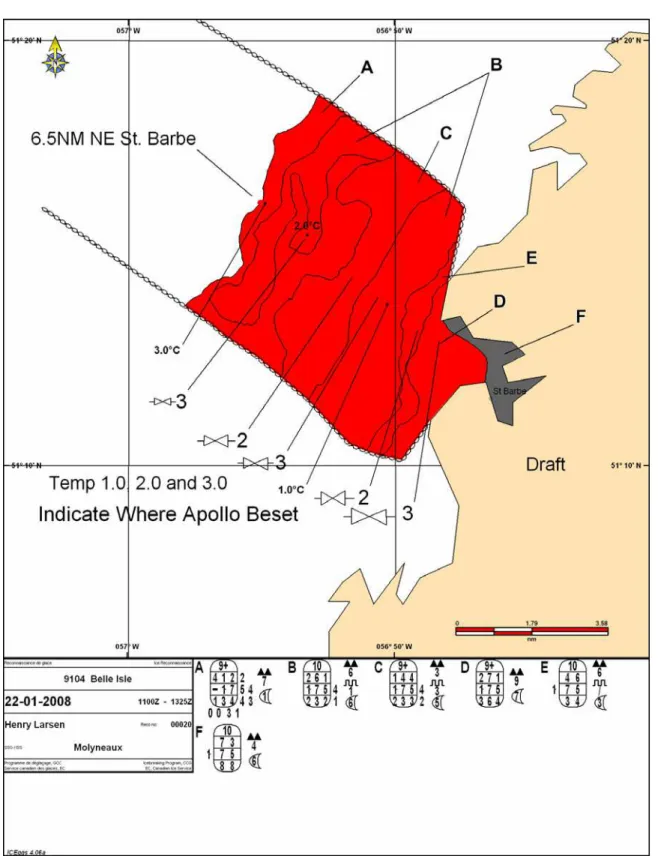
Isle at the start of simulation (January 21, 2008)... 13 Figure 3: Reconnaissance chart presenting detailed ice condition on January 22,
Progress Report: Ship Safety and Performance in
Pressured Ice Zones
1.0 BACKGROUND
The Captains of Canadian Coast Guard Icebreakers and Captains of commercial ships that operate in the Arctic have been interviewed within the framework of a project focusing on Ice Information Requirements for Marine Transportation of Natural Gas from the High Arctic (Timco et al., 2005). One of the two high priority areas that they identified was reliable predictions of pressured ice conditions along shipping lanes. At present, this information is not available. The Captains were also interviewed to find what areas/locations are the most critical and what type of product/tool will be the most useful to them. During these interviews they indicated that if timely information on ice pressure build-up was available last spring 2007, the fishing vessels would not have been trapped and damaged in the pressured ice in northeast coast of Newfoundland and southern Labrador. The need for such information will become even more urgent with increased shipping in the Arctic since it is likely that less experienced Masters will be at the helm and they would require even better ice information than is now available.
The objective of this project is to provide real-time information to ships operating in the Arctic to minimize safety and operational problems due to pressured ice conditions. The project will also determine the performance and safety of various ship classes in pressured ice. This will be done by providing information to ship operators on the development of pressured ice along shipping routes and on locations of pressured ice. This project will develop and implement new technology to improve such information. Once developed, CHC will work with the Canadian Ice Service (CIS) and other partners to disseminate it to vessels operating in the Arctic.
To ensure that the predictive system will provide information that will be of use to the Captains and ship owners and operators, during the first year of this project a questionnaire was prepared and distributed to the Captains of vessels that travel through the Canadian Arctic. The main focus of the questionnaire was on topics such as the type of product needed, the geographical regions where pressure ice presents a problem during shipping, and how the product should be distributed to operating vessels. TP14847 report contains all the details (Kubat and Sudom, 2008).
This report describes progress made during the second year of the four-year project, April 1, 2008 to March 31, 2009. Start date of the entire project was April 1, 2007 and the completion date is March 31, 2011.
2.0 DELIVERABLES
Main deliverables of the project is a predictive system to provide information on the development of pressure areas, and the performance of various ship classes under those ice-pressure conditions. This research will improve safe shipping and operability of vessels in the Arctic and minimize the risk of pollution. It will also improve energy efficiency by selecting the more navigable route.
The timeline for the project is:
FY 2007/08 – Planning, compilation of data and preliminary testing • Compile imagery, charts and environmental records.
• Preliminary analysis and examination of zones and routes.
• Review and testing of algorithms and models for vessel interaction with pressured ice fields.
FY 2008/09- Analysis of pressure zones and interaction with vessels
• Conduct analyses of specific routes and regions to determine pressure zones scenarios.
• Examine the interaction between pressure zones and vessels.
• Define and validate forecast systems for predicting ice pressure zones. FY 2009/10- Delivery of ice pressure forecasting system to CIS
• Complete analysis of pressure zones and forces on vessels.
• Deliver first version of the ice pressure forecasting system to CIS. • Develop forecast products to be issued by CIS.
FY 2010/11- Completion and final deliverables.
• Validate and, if needed, modify the ice pressure forecasting system.
• Implement forecast products at CIS and provide products for delivery to end users.
• Incorporate feed-back from TC and end-users.
2.1 Progress up-to-date
Existing literature describing pressure ice zones and vessel performance in pressured ice was reviewed. The existing damage databases were analyzed and detailed information was obtained on events describing vessel damage and performance in pressured ice. Charts and environmental records were compiled and analyzed. A questionnaire to obtain information from ship Captains and ship operators on pressure zones, factors contributing to pressure development, and type of product that would help ships to safely navigate in pressured ice was developed and sent out. Responses from questionnaires were analyzed and summarized in the report TP 14847 (Kubat and Sudom, 2008). A number of meetings had been held with CIS and Canadian Coast Guard (CCG) representatives to discuss the validating and implementing forecast system for predicting ice pressure zones. In addition, the results of this project work have been presented at a number of workshops. The following section presents discussion and outcome of the meetings.
July 19, 2007 During this meeting the objective of the project, work plan, and collaboration between CHC and CIS were discussed. The minutes of the meeting are enclosed in Apendix A
July 24, 2007 During this meeting the objective of the project, work plan, and collaboration between CHC and CCG were discussed. The minutes of the meeting are enclosed in Apendix A
October 2008 This meeting was scheduled to discuss responses from the questionnaires distributed to the Captains and to set-up the time-line for the project to ensure a successful completion of it. The Agenda for this meeting is enclosed in Appendix A. The time-line is presented in the Appendix B. A plan for testing the ice forecasting tool against the recorded ice pressure events has been established. Two areas were selected for this exercise: Strait of Belle Isle and Northeast Coast of Newfoundland. These areas were also indicated by the Captains and shipping operators as the areas for which the ice pressure forecast should be issued (Kubat and Sudom, 2008). A short summary of Captains responses to the questionnaire, description of the ice forecasting tool and the analysis of ice pressured zones is given in the section 3.0
March 2009 During this meeting status of the progress of validating the forecasting tool with data obtained from CIS was presented. The minutes of the meeting are enclosed in Apendix A. Presentation given during this meeting is enclosed in the Appendix C. Detailed results of the simulation will be provided in the report completed in June 2009.
Aside from these meeting NRC-CHC and CIS have been working closely throughout duration of the project on forecasting system development and testing. In addition to the meetings with CIS and CCG representatives, results of the work done and the progress made in this project have been presented at a number of workshops and/or conferences: First Northern Watch Conference, Halifax – October 2007
CMAC-Northern meeting, Hay River - November 2007 CCG Post Arctic Meeting, Montreal – December 2007 CIS Ice University, Ottawa – May 2008
CMAC-Northern meeting, Whitehorse – November 2008 CCG Post Arctic Meeting, Ottawa – November 2008
3.0 CAPTAINS RESPONSE TO THE QUESTIONNAIRE AND
ANALYSIS OF ICE PRESSURE ZONES
3.1 Summary of Captains responses to the questionnaire
The locations for which the product on ice pressure occurrence should be provided depend on shipping frequency. In the Canadian Arctic, the most important regions are Lancaster Sound, the Beaufort Coast, and Hudson Strait. In Atlantic Canada, pressured ice is of concern mainly in Voisey’s Bay, off the Labrador Coast, and off the North-East Coast and Fogo Island. In the Gulf of St. Lawrence pressured ice seems to cause problems all over the Gulf. The priority in location also depends on the time of year, which is directly linked to the traffic density and the shipping season. However, ice pressure development is not solely dependent on the time of year. It is also dependent on ice concentration, ice breakup, floe size, and driving forces such as currents, tide, swell and wind. In addition, the proximity of land or an adjacent heavier ice field can restrict ice movement and cause a build-up of ice pressure. In some regions ice pressure development is mainly affected by currents, while in other pressure is caused by wind forcing. Air temperature also plays a significant role. Large swells from low pressure in the North Atlantic can cause extreme ice pressure events that are not forecasted. Ice pressure is most likely to develop in spring, but can form any time of the year.
The type and format of a product that will help Captains determine the presence of pressured ice and its development varies depending on the equipment available at each vessel. A number of Captains indicated an interest in having digital pressure charts that could be overlaid on maps used by their GIS system, or a digital animation showing ice pressure and leads development. A number of Captains would also be interested in running stand-alone software onboard a vessel which would accept and analyze real-time parameters input by the Captains. On the other hand, some vessels don’t have tech-savvy equipment onboard, so in that case a hard copy of pressured ice charts would be the best option. The ice pressure forecast should align with the regularly scheduled weather forecast (6 hours preferably) along with updates for serious conditions (in which case conditions should be updated every hour). The length scale of the area covered by the forecast should be based on a 24-hour ship transit. A suggested approach was the establishment of “sensitive zones” that would be known to all ships and the forecast would be provided for these zones.
The problem in the Arctic is often receiving the information. The product may be available, but in the higher Arctic the reception is often difficult, so this should be taken into account. In general, Captains see the Canadian Ice Service (CIS) playing the lead role in the product distribution and/or maintenance of a website from which the product could be downloaded.
3.2 The Ice Forecasting Tool
NRC-CHC has collaborated with CIS and McGill University on the development of models and formulations of ice properties and forecasting. These new tools, especially ice forecasting prediction tools, will be used in developing products providing information for ships on the location of likely pressured conditions along with the magnitude of the anticipated pressure, and help with route selection. Detailed description of the ice forecasting model can be found in Sayed and Carrieres (1999); and Sayed et al. (2002). It consists of a number of components from which one of the most important is thickness redistribution model (Savage 2002, 2008). The thickness redistribution model provides a parameterization for the dependence of ridging and lead opening processes on deformation. The model has been examined with field data obtained from the Gulf of St. Lawrence (Kubat et al., 2009a, 2009b). The results showed that the model effectively simulates the process of ice thickness and ice concentration evolution. The comparison between the observations and model predictions confirms that simulations were able to predict deformation and drift of the sea ice.
3.3 Ice Pressure Zones simulations
A meeting has been held at CIS in October, 2008 at which a plan for testing the ice forecasting tool against the recorded ice pressure events has been established. Two areas were selected for this exercise: Strait of Belle Isle and Northeast Coast of Newfoundland. These areas were also indicated by the Captains and shipping operators as the areas for which the ice pressure forecast should be issued (Kubat and Sudom, 2008). In order to simulate the ice pressure development detailed information on environmental conditions has to be input into the model. Canadian Ice Service and Canadian Coast Guard provided NRC-CHC with ice charts, reconnaissance charts, weather and ice conditions reports from vessels, position of vessels trapped and beset in pressured ice over a certain period of time, and other relevant information for analyzing pressure zones and forces on vessels and simulating the ice condition evolution during April 16-18 2007 and January 20-21, 2008. Figures 1 to 3 show example of the ice charts that were used for initializing the model and for comparing the output of the model. The ice charts issued on April 14 to April 18 were used for simulating the second case, i.e. ice pressure zones build-up off Newfoudland Coast in 2007. An effort has been spent on obtaining a dataset that provides information on water currents and wind forcing during the testing period. A meeting at which results were discussed was held at CIS in March 2009. Presentation given during this meeting is enclosed in the Appendix C. Detailed results of the simulation will be provided in the report completed in June 2009. Upon successful validation, NRC-CHC will deliver first version of the system to CIS along with documentation necessary for implementation. This work also includes a study on the forecast system sensitivity to input parameters.
Strait of
Belle Isle
Figure 1: Regional Ice chart presenting ice conditions at the start of the run on January 21, 2008.
Figure 2: Reconnaissance chart presenting detailed ice conditions in the Strait of Belle Isle at the start of simulation (January 21, 2008)
Figure 3: Reconnaissance chart presenting detailed ice condition on January 22, indicating where a vessel was beset
4.0 SUMMARY
This report presents a progress of work done to develop a forecast system for predicting ice pressure zones along the shipping routes in Canadian Arctic. Data have been collected to validate the ice forecasting system. Meetings with stakeholders have been held to develop a timeline for the forecast system validation and implementation. The work has been progressing as planned; this project represents no risk for successful completion and expenditure of fund.
5.0 ACKNOWLEDGEMENTS
The author would like to acknowledge the interest and financial support of Transport Canada. The support of Canadian Ice Service and Canadian Coast Guard is also appreciated.
6.0 REFERENCES
Kubat, I. and Sudom, D. (2008). “Ship Safety and Performance in Pressured Ice Zones: Captains’ Responses to Questionnaire” Technical Report CHC-TR-059/ TP14847.
Kubat, I., Sayed, M., Savage, S.B., and Carrieres, T. (2009a). Numerical Simulations of Ice Thickness Redistribution and Ice Drift in the Gulf of St. Lawrence, Technical Report CHC-TR-059
Kubat, I., Sayed, M., Savage, S.B., and Carrieres, T. (2009b). Numerical Simulations of Ice Thickness Redistribution in the Gulf of St. Lawrence, Submitted to Cold Regions Science and Technology.
Savage, S.B. (2002). “Two category sea-ice thickness redistribution model,” Report prepared for Canadian Ice Service, Environment Canada, 373 Sussex Dr, Ottawa, Ontario, Canada, K1A 0H3, March 31, 2002.
Savage, S.B. (2008). “Two Component Sea-Ice Thickness Redistribution Model,” Cold Regions Science and Technology, Vol.51, Issue 1, pp 20-37.
Sayed, M., and Carrieres, T. (1999). “Overview of a new operational ice forecasting model”, Proc. Int. Offshore and Polar Eng. Conf., ISOPE, Brest, France, May 30- June 4, Vol. II, pp. 622-627.
Sayed, M., Carrieres, T., Tran, H. and Savage, S.B. (2002). “Development of an operational ice dynamics model for the Canadian Ice Service,” Proc. Int. Offshore and Polar Eng. Conf., ISOPE, Kitakyushu, Japan , May 26-31, pp. 841-848.
G.W. Timco, B.Gorman, J.Falkingham and B.O’Connell (2005) Scoping Study: Ice Information Requirements for Marine Transportation of Natural Gas from the High Arctic, Technical Report CHC-TR-029, February 2005
Minutes of the meeting July 19, 2007
Canadian Hydraulics Centre, 3rd Floor Conference Room Thursday July 19, 2007
13:30 – 15:00
Attendance: CHC – Ivana Kubat, Mohamed Sayed CIS – Tom Carrieres
Agenda: Discuss the objective of the project, work plan, and collaboration between CHC and CIS
Topics: - Pressured ice project interaction with Sea ice forecasting and SAFEICE projects
- Items in the Questionnaire to be discussed with Captains and ship operators
- Delivery of potential products through CIS
- Test Cases collaboration (CHC – testing the cases; CIS – e.g. providing ice charts, wind data, etc; BIO – e.g providing WebDrogue (webpage enclosed at the end of this document)
Ideas/Points: - response to wind (PERD related) - ice strength issue
- vessel performance in pressured ice in the Gulf of St.Lawrence => a lot of data for designing and validating test cases; data from CICERO voyage
- check if any data describing damage events in pressured ice are recorded in the CHC’s Damage database
- development of an Algorithm versus a new model -> the algorithm could be used in any model, but would have to be (most likely) calibrated
- rotated coordinates can be used at CIS => Cartesian system could be used rather than spherical coordinates in the model
- local model for ice including the ship class (plus very high resolution)
Actions: Ivana – schedule meeting with ship Captains and operators Ivana/Mohamed – decide on test cases
SAFEICE project:
Objective: The main purposes of the SAFEICE project are to develop semi-empirical methods based on measurements to determine the ice loads on ship hull, to find relationship between operational conditions and ice load, to develop ship-ice interaction models to assess the design ice loads on ship hull, to develop methods to estimate ultimate strength of shell plating and frames and to develop methods to analyse ice damages. The target is to decrease the risk involved in winter navigation.
There are 11 work packages, each including a number of tasks. Some of the tasks which results will be used in the Pressured ice project are:
- D2-4: Database filled with data (NRC and HUT)
- D3-4: Relationship between ice loads and the operational environment (HUT) - D4-3.1: Compressive ice conditions in the Gulf of Finland (TUT)
- D7.1: Description of main parameters needed in ice load prediction (HSVA and TUT)
- PRADS’07 paper: T. Kõuts , K. Wang, M. Leppäranta “On connection between mesoscale stress of geophysical sea ice models and local ship load” Abreviations:
HUT = Helsinki University of Technology TUT = Tallin University of Technology HSVA = Hamburg Ship Model Basin
PRADS = International Symposium on Practical Design of Ships and Other floating Structures
WebDrogue:
Minutes of the meeting July 24, 2007
Canadian Hydraulics Centre, 3rd Floor Conference Room Tuesday, July 24, 2007
13:30 – 15:00
Attendance: CHC –Mohamed Sayed, Ivana Kubat CCG – Fiona Robertson, Barb O’Connell
Agenda: Discuss the objective of the project, work plan, and collaboration between CHC and CCG
Topics: - Pressured ice project interaction with Sea ice forecasting, Ice Navigation Challenges in the High Arctic, and SAFEICE projects
- Objectives and Deliverables of the Ship Safety and Performance in Pressured Ice Zones project
- Objectives of the SAFEICE project and its interoperability with the Pressured ice project
- Objectives of the Sea Ice Forecasting project and utilization of it towards the Pressured ice projects
- Items in the Questionnaire to be discussed with Captains and ship operators
- Potential products to be delivered to Captains and ship operators
Meeting:
IK: gave a background of the project; discussed related projects: Safe Ice and the joint forecasting project with CIS (PERD).
IK: Talked about priorities; contacting ship captains. For example, what are the geographic areas/zones of interest (Lancaster Sound, others)? Mentioned the meeting and discussions with R. Gorman.
FR: said that a long-term objective (might take a few years) is to overlay on the charts new information (e.g. regarding the pressure). She discussed/wondered if there are fields in Manice other than those used now. If there are provisions for more information in Manice, they should be in the/a catalogue.
FR: mentioned that electronic formats are preferable to just paper products (e.g. faxes). The electronic information can be incorporated in other systems (e.g. ECDIS).
BO: Ice specialists/ships often report that their observations are different from the ice chart. CIS would modify the chart issued the next day, but only around the location of the ship.
BO: Now there is no way to get real time information to the ships. There are limits to the rates (in kilo bytes).
FR: Said that a product should be disseminated from CIS; e.g. a model should run at CIS.
MS: asked about ship access to webtide- answer no access.
BO: There was a problem for ships passing under the Confederation Bridge in 2003. Ships were carried by the ice cover and maneuvering was very challenging. The pressure in the ice dropped only near/under the bridge.
MS: asked if power requirements and resistance would also be of interest. Reply was that pressure is the priority.
FR: Offered to translate the questionnaire and send it under a cover email to captains.
FR & BO: mentioned that a good opportunity to meet captains would be during the “Post Arctic Meeting” to be held in Montreal, 27 & 28 November
Actions: Fiona – translation of e-mail to be sent to Captains along with the questions Fiona – send e-mail to Captains with the list of questions
Ivana – schedule meetings/calls with ship Captains and operators
Links to related projects and reports:
SAFEICE: http://www.tkk.fi/Units/Ship/Research/SafeIce/Public/
Report describing “Scoping Study: Ice Information Requirement for Marine
Transportation of Natural Gas from the High Arctic”
Agenda for the meeting October 30, 2008
Navigating through pressured ice zones: Captains’ requirements and possible products/tools
Canadian Ice Service 3rd Floor Boardroom October 30, 2008
13:30 – 15:30
Attendees: Ivana Kubat (NRC-CHC)
Mohamed Sayed (NRC-CHC)
Marie-France Gauthier (CIS)
Darlene Langlois (CIS)
Trudy Wohlleben (CIS)
Dan Fequet (CIS)
Tom Carrieres (CIS)
Vladimir Zabeline (CIS)
Fiona Robertson (CCG)
13:30 – 13:45 Project Introduction
13:45 – 14:00 Questionnaire and Captains’ responses to the questionnaire 14:00 – 14:15 Different approaches to respond to Captains’ needs
14:15 – 15:00 Potential implementation at CIS Distribution of a product
15:00 – 15:25 Next steps
Minutes of the meeting March 4, 2009
Navigating through pressured ice zones: Ice Forecasting model validation, model response to wind forcing
Canadian Ice Service 3rd Floor Boardroom Wednesday, March 4, 2009
9:30 – 12:00
Attendees: Ivana Kubat (CHC)
Mohamed Sayed (CHC)
Marie-France Gauthier (CIS)
Darlene Langlois (CIS)
Trudy Wohlleben (CIS)
Paul Pestieau (CIS)
Tom Carrieres (CIS)
Vladimir Zabeline (CIS)
Fiona Robertson (CCG)
Status of the project progress was presented. The effect of different solutions (explicit, standard implicit, and modified) on model response to wind was presented. Four cases of model validation were presented: model validation against data obtained from the Gulf of St. Lawrence, Beaufort Sea, Strait of Belle Isle, and Northeast Coast of Newfoundland. The action items resulting from the meeting:
• Darlene/Trudy will send a Table listing data on ice pressures to CHC
• Paul will send CMC archived wind data to CHC (Ivana will specify dates needed) • Paul will send information on dex files interpretation (such as brash ice, 9+, etc) • CHC will distribute POAC (The response of sea ice dynamics models to wind) and
CRST (Numerical simulations of Ice thickness redistribution and Ice drift in the Gulf of St. Lawrence) papers once the reviewer’s comments are incorporated • CHC will complete reports on model validation in June 2009
Deliverable/ Milestone/ Task
April 2009
1. CI S to provide additional information packages to CHC over the Gulf and Newfoundland waters for validation
May 2009 1. CHC to provide CI S with report on model validation over Strait of Belle
I sle/ Gulf/ Newfoundland areas
2. CI S/ CHC to identify additional validation activities
December 2009 1. CHC to provide a final report describing analysis of pressure zones and
forces on vessels
2. CHC to compare their model to existing models
3. CI S/ CCG/ CMC/ CHC to discuss options for implementation and documentation requirements including training
March 2010 1. CHC to deliver documents and the first version of system
2. CI S/ CCG/ CHC to develop prototype products
FY 2010/ 11- Completion and final deliverables
• Validate and, if needed, modify the ice pressure forecasting system
• I mplement forecast products and provide products for delivery to end users • I ncorporate feed-back from TC and end-users
Deliverable/ Milestone/ Task May 2010
1. Run the model in a development environment and provide prototype products
2. Set up validation and feedback process for Arctic regions
November 2010 1. Validation report and modification to the system and finalizing the forecast
December 2010 1. Set-up validation and feedback process for Southern regions
2. Finalize output products and implementation plan
March 2011
1. I mplementation of products and final report incorporating the feedback from I ndustry
1
Model Validation
CHC-CIS-CCG meeting, March 4th, 2009
Outline
• Gulf of St. Lawrence
Î Ice drift, thickness distribution, ice thickness, ice concentration, pressure build-up
• Beaufort Sea
Î Ice drift, ice thickness, ice concentration
• Strait of Belle Isle
Î Pressure build-up, ice thickness, ice concentration
• Northeast Coast of Newfoundland
2
• Advection:Particle-In-Cell (Lagrangian)
• Rheology:Hibler’s elliptical yield envelope and viscous plastic approximation, other criteria are tested
• Solution of the momentum equations: Zhang-Hibler semi-implicit approach
• Thickness redistribution: New model of Savage
Test 1
3
Model validation
• 5 km grid cell • Duration : 9 days
• Initial thickness: regional weekly ice chart • Initial area coverage: regional weekly ice chart • Wind speed and direction: field measurements • Tidal currents: BIO
Field measurements Feb/March 2004
• Bedford Institute of Oceanography field measurements • Satellite-tracked ice beacons and helicopter-borne sensors • Sea-ice thickness and ice roughness measured
Gulf of St.Lawrence – initial ice conditions
Ice conditions: February 16, 2004 G V T S P O I L H
4
Gulf of St.Lawrence – after 7 days
Daily Ice Chart February 23, 2004 Model Output M Q M N H H D G Q
5
6
7
• Initial thickness modified to agree with field measurements
for February 16, 2004
Ice Thickness Distribution
Feb 16, 2004 Feb 24, 2004 Field Model Initial 0 0.05 0.1 0.15 0.2 0.25 -0.1 0.5 1.0 1.5 2.0 2.5 3.0 3.5 4.0 4.5 5.0 5.5 6.0 Ice Thickness, m Norm a liz e d Fre que nc y DAY 8 0 0.01 0.02 0.03 0.04 0.05 0.06 0.07 -0.1 0.5 1.0 1.5 2.0 2.5 3.0 3.5 4.0 4.5 5.0 5.5 6.0 Ice Thickness, m Norm a liz e d Fre que nc y
8
Comparison of model results with field measurements
3.88 3.87 2.51 2.5 Start Model Field
After 4 days beacon stopped in the ridged pack ice compressed against PEI
Status
• Validation completed
• Paper written (Cold Region Science
Technology)
• Future work: compare the model output with
the output of the model run operationally at
CMC – location
9
Beaufort Sea
Test Conditions
Model validation
• 5 km grid cell
• Duration : April 16 – April 29, 2003
• Initial thickness and area coverage: CIS digital regional ice charts • Wind speed and direction: NARR (North American Regional
Reanalysis)
10
11
Start
Status
• Project ongoing
• Results proprietary
12
Strait of Belle Isle
Test Conditions
Model validation
• 5 km grid cell • Duration : 2 days
• Initial thickness and area coverage: daily ice chart (dex files) and
reconnaissance charts
• Wind speed and direction: NARR (North American Regional
Reanalysis)
• Water currents: Mercator, CIOM, CECOM, wind driven water
currents
Field observations January 20-21, 2008
13
Input ice conditions – Jan 21, 2008
14
Reconnaissance charts
15
Input data: January 21, 2008
16
Status
• Validation in progress
17
Coast of Newfoundland
Test Conditions
Model validation
• 5 km grid cell • Duration : 6 days• Initial thickness and area coverage: daily ice chart (dex files) and
reconnaissance charts
• Wind speed and direction: NARR (North American Regional
Reanalysis)
• Water currents: Mercator, CIOM, CECOM, wind driven water
currents
Field observations April 16-18, 2007
18
19
Status
• Validation in progress
20