AIRCRAFT CONFLICT ANALYSIS AND REAL-TIME CONFLICT PROBING USING PROBABILISTIC TRAJECTORY MODELING
by Lee C. Yang
S.M. Aeronautics and Astronautics. Massachusetts Institute of Technology (1994). B.S. Aeronautical and Astronautical Engineering. University of Washington (1989). Submitted to the Department of Aeronautics and Astronautics in Partial Fulfillment of the
Requirements for the Degree of
DOCTOR OF PHILOSOPHY IN AERONAUTICS AND ASTRONAUTICS AT THE
MASSACHUSETTS INSTITUTE OF TECHNOLOGY
June,2000 MASSACHUSETTS INSTITUTE
OF TECHNOLOGY @ 2000 Massachusetts Institute of Technology
All rights reserved
LIBRARIES
Signature of A uthor... ... ... ... Depart t of Aeronautics and Astronautics
April 28, 2000
Certified by
...
... ...Professor James K. Kuchar (Thesis Supervisor) Certified by... ...
Professor R. John Hansman (Thesis Committee Member) C ertified by ... ...
Professor Walter Ho ister (Thesis Committee Member) C ertified by ... ... ...
Professor Eric Feron (Thesis Committee Member) A ccepted b y ... . .... ...
AIRCRAFT CONFLICT ANALYSIS AND REAL-TIME CONFLICT PROBING USING PROBABILISTIC TRAJECTORY MODELING
by Lee C. Yang
Submitted to the Department of Aeronautical and Astronautics
on April 28, 2000, in Partial Fulfillment of the Requirements for the Degree of Doctor of Philosophy in Aeronautics and Astronautics
ABSTRACT
Methods for maintaining separation between aircraft in the current airspace system have been built from a foundation of structured routes and evolved procedures. However, as the airspace becomes more congested and the chance of failures or operational error become more problematic, automated conflict alerting systems have been proposed to help provide decision support and to serve as traffic monitoring aids.
The problem of conflict detection and resolution has been tackled from a number of different ways, but in this thesis, it is recast as a problem of prediction in the presence of uncertainties. Much of the focus is concentrated on the errors and uncertainties from the working trajectory model used to estimate future aircraft positions. The more
accurate the prediction, the more likely an ideal (no false alarms, no missed detections) alerting system can be designed.
Additional insights into the problem were brought forth by a review of current operational and developmental approaches found in the literature. An iterative, trial and error approach to threshold design was identified. When examined from a probabilistic perspective, the threshold parameters were found to be a surrogate to probabilistic performance measures. To overcome the limitations in the current iterative design method, a new direct approach is presented where the performance measures are directly computed and used to perform the alerting decisions.
The methodology is shown to handle complex encounter situations (3-D, multi-aircraft, multi-intent, with uncertainties) with relative ease. Utilizing a Monte Carlo approach, a method was devised to perform the probabilistic computations in near real-time. Not only does this greatly increase the method's potential as an analytical tool, but it also opens up the possibility for use as a real-time conflict alerting probe. A prototype alerting logic was developed and has been utilized in several NASA Ames Research Center experimental studies.
Thesis Supervisor: James K. Kuchar
Acknowledgments
I used to believe that a Ph.D. degree from MIT was only a passing dream - a pinnacle of bold accomplishments by the best and brightest in the world of which I am not one. If you had asked me 10 years ago where I would be now, I would have told you I'd be completely lost in no man's land. The people here at MIT not only gave me life, but some hope for the future. I'd like to think there is a Supreme Being up there looking after me, but the people here have had their part in helping me through my trials and tribulations; not just of this thesis, but in life in general.
I dedicate this thesis to my loving father, John Huei Lee, Ph.D, who past away (7/30/1940 - 11/20/1999) before he could see me finish my work and finally graduate after all these years. I hope to fill the gap in my family by bringing home a Ph.D. left void by my father's passing. I only wish he could have been with us long enough to become a grandfather. I know he would have been great in that role.
My family (Mike, Allan, Jimmy, and my parents) have been of great support to me in my times of need. I know I have tried to push them away when things looked bleak, but they would not let me go. I have always found comfort in our cats, Simba, Garfield, Patches, and Kellie (who passed away recently after 16 wonderful years). They always made me laugh and never complained when I needed their attention.
I would like to give special thanks to Professor James Kuchar, who has not only been my thesis supervisor for the last 4 years, but has been a friend and co-worker in just about every project I've done at MIT. I know I've put him through a lot of anguish all this time and may have even put some gray hair on head, but he has always been there when I went astray. I appreciate his kindness and understanding through it all, and I truly look to him as the perfect role model that he is. Also, I would like to thank Professor R. John Hansman for taking me under his wings many years ago and pushing me along to finish 2 graduate degrees (S.M. and Ph.D.). He has shown me that it is possible to be both a workaholic as well as a truly devoted family man. Professors Walt Hollister and Eric Feron have also been of great help in providing guidance for my work. Without them, this thesis would not have been complete.
I have made some very special friends throughout my long tenure here at MIT, and I would like to thank them all for everything they have done for me. To Maria for her kindness and friendship in the short time I had to know her. I just wish she would have known how much she meant to me and how I still think about her everyday. There may be other fish in the sea, but none in comparison to her. You changed my life forever, Maria. To Tom B. for making me laugh and getting me to be more sociable. Thanks for all the nice things you say about me. I'm sure you'll find that lucky Asian girl one day. To John-Paul and his lovely wife, Michelle, for helping me through life as friends. J-P, you always find a good side to everything I think is going wrong. To
Valerie for bringing me hope. To Anthony for helping me through the tough times of my life and listening to all my complaints. To Jen F. for prodding me on through the social scene when Tom left. And to Rada and Neda for the encouraging words and kindness the two sisters brought me.
I would also like to thank my lab mates for their countless hours of chatter. To Laurence (still can't pronounce her name) Vigeant-Langlois, Yianni (it's Greek to me) Anagnostakis, Lee (your number 2) Winder, Richard (rapid prototyping) Barhydt, Sanjay
(computer god) Vakil, Richard (Nikon) Komfeld, Tom (British) Reynolds, Hayley (bleach blonde) Davison, and Lixia (it's pronounced Lishia) Song for the wonderful times together in the office and nights out on the town.
My time here at MIT would not have been any joy without all the sports teams I had a chance to play on. Thanks to Ray S., Graeme S., Nicole C., Jennifer R., Brian S., Mitch I., Bill B., Megan H., and all the numerous other teammates I had the opportunity to play with.
Thanks to Professor Steven Hall for giving me the opportunity to work with the Unified Engineering course. His mentorship was invaluable along with additional guidance from the other professors (Dan Frey, Winston Markey, Wesley Harris, Ian Waitz, and Paul Lagace). I should also thank the Unified students for putting up with me! They probably don't know it, but I'm sure I learned more from them than they ever took from me.
Finally, I would like to thank the sponsors of my research at NASA Ames Research Center. Thank you Paddy Cashion, Sandy Lozito, Walt Johnson, Diane Carpenter, Paul Soukup, and Laura Colletti.
Table of Contents
1 Introduction 11
1.1 O bjectiv e s... 12
1.2 O verview of T hesis... 13
2 Review of Alerting System Performance 15 2.1 G eneric A lerting System ... 15
2.2 State-Space Representation of Alerting Systems ... 16
2.2.1 State T rajectory ... . 17
2.2.2 H azard Space ... 17
2.2.3 A lert Space ... 18
2.3 Alerting Decision Outcomes ... 19
2.4 Tradeoff Between Missed Detection and False Alarms ... 22
2.5 Role of Uncertainty in the Alerting Outcome ... 25
2.6 System Operating Characteristic Analysis... 28
2.6.1 Probabilistic Trajectories and Probability of Conflict ... 28
2.6.2 Nominal and Avoidance Trajectories... 29
2.6.3 SO C C urves ... 30
2.7 Sum m ary ... ... 37
3 Conflict Detection and Resolution Methods 39 3.1 Conflict Detection and Resolution ... 39
3.2 Survey of Algorithmic Designs ... 44
3.2.1 Current Operational Systems... 44
3.2.1.1 Traffic Alert and Collision Avoidance System (TCAS)... 44
3.2.1.2 Traffic and Collision Alert Device (TCAD)... 48
3.2.1.3 Ground Proximity Warning System (GPWS)... 49
3.2.2 Additional Algorithmic Designs ... 51
3.3 Insights from Survey...52
3.3.1 Variety of Threshold Metrics ... 52
3.3.2 Prevalence of Ad Hoc Approach to Alerting Design... 53
3.3.3 Three Trajectory Projection Methods ... 55
3.3.3.1 Single P ath ... 56
3.3.3.2 W orst C ase ... . . ... 57
3.3.3.3 Probabilistic ... .. . ... 59
3 .4 S um m ary ... 6 1 4 A Unified Approach to Improving Alerting System Performance 63
4.1 Errors in the Trajectory M odel... 63
4.1.1 Working Model (W) vs. "Truth" Model (T) ... 63
4.1.2 Errors and Uncertainties in the Trajectory Model ... 66
4.1.3 Effects of Modeling Errors on Performance Estimates...71
4.2 (W = T) Reducing Trajectory Modeling Errors (Increase Accuracy of Model). 73 4.2.1 (W -+ T) Drive W Toward T - Improve Trajectory Modeling... 76
4.2.1.1 Utilize a Probabilistic Trajectory Model ... 76
4.2.1.2 Utilize Sufficient and Accurate Information of the State T rajectory ... . 76
4.2.1.3 Update the Working Trajectory Model...80
4.2.2 (T - M) Drive T Toward M ... 81
4.2.2.1 Utilize Conformance Boundaries ... 81
4.2.2.2 Lim it O peration ... 84
4.3 Reduce Inherent Uncertainties (Reduce Uncertainty of Future Trajectory)...85
4.3.1 R estrict Flight Path... 88
4.3.2 Establish Protocol (Training, Rules of the Road, Convention)... 89
4.3.3 Introduce Better Equipm ent... 90
4.3.4 Delay Alert (Minimize Size of T at Alert Time)... 91
4.4 Investigate Other Avoidance Maneuvers... 92
4 .5 D esign Issues... . 94
4 .6 Sum m ary ... . 95
5 A Probabilistic Perspective of the Alerting Design Process 97 5.1 A Probabilistic Perspective to the Ad Hoc Approach ... 97
5.2 A N ew D irect A pproach ... 101
5.3 Implications from a Probabilistic Perspective... 102
5.3.1 Global Design vs. Situation-Specific Design ... 103
5.3.2 Relating Performance Measures to Alerting Thresholds ... 114
5.3.3 Using Performance Measures as Alerting Thresholds ... 117
5.3.4 Continuous Update of Trajectory Model W... 119
5.4 Sum m ary ... . 120
6 Probabilistic Analysis of Conflict 123 6.1 T he T rajectory M odel ... 124
6.2 Calculating the Probability of Conflict... 129
6.2.2 Propagation M ethod... 131
6.2.3 Com putational Accuracy ... 136
6.3 Conflict Probability M aps ... 138
6.4 Sum m ary ... 139
7 Example Applications 141 7.1 H orizontal Conflict Exam ples ... 141
7.2 Vertical Conflict Exam ples ... 146
7.3 Sum m ary ... 152
8 A Probabilistic Real-Time Alerting Probe 153 8.1 Alerting Probe Concept... 153
8.2 Prototype Alerting System ... 156
8.3 The Alerting Thresholds ... 158
8.4 Evaluation of Prototype System ... 162
8.5 Sim ulation Studies ... 167
8.6 Discussion ... 169
8.7 Sum m ary ... 170
9 Summary and Conclusions 171 9.1 Sum m ary ... 171
9.1.1 Review of Alerting Systems and Alerting Performance ... 171
9.1.2 Survey of Alerting Approaches ... 171
9.1.3 A Unified Approach for Improving Alerting Performance... 172
9.1.4 Probabilistic Influence in Alerting System Design... 172
9.1.5 M ethodology for Com puting Conflict Probabilities ... 172
9.1.6 Application of M ethodology ... 173
9.1.6.1 Conflict Analysis Tool... 173
9.1.6.2 Real-Tim e Conflict Probe ... 173
9.2 Conclusions ... 174
Appendix A. A Review of Conflict Detection and Resolution Modeling Methods 187
A.1 State Propagation ... 188
A.2 State Dim ensions ... 191
A.3 Conflict Detection... 191
A.4 Conflict Resolution ... 192
A.5 Resolution M aneuvers... 194
A.6 M ultiple Conflicts ... 195
A.7 Other M odel Elem ents ... 196
Appendix B. Statistical Analysis of Global Distributions 201 B. 1 Statistics of Combining 2 Distributions ... 201
B.2 Statistics of Combining M ore Than 2 Distributions ... 204
Appendix C. Conflict Detection Using Line-Volume Intersection 207 C.1 Relative Fram e... 207
C.2 Line-Volum e Intersection... 209
C.2.1 Horizontal Intersection ... 209
Chapter 1
Introduction
As the sky above becomes more congested, new concepts of Air Traffic
Management (ATM) are being proposed to handle the expected growth [RTCA, 1995; Wangermann, 1994; Phillips, 1996, Brudnicki and McFarland, 1997]. To enable more efficient ways and procedures of moving traffic about in the airspace, many methods will require the relaxation of the rigid airway structure and in-trail spacing currently being used to maintain traffic separation. The new concept is based on the idea of reducing restrictions on individual flight paths. Consequently, to handle the increased traffic volume or possible loss of airway structure, automated traffic conflict detection and resolution tools would be required to aid pilots and/or ground controllers in ensuring safe separation at all times.
To predict traffic conflicts, it is necessary to project the future positions of aircraft over time. However, uncertainty is inherent in the prediction of any future event and the same is true in conflict prediction. Due to random processes, there is variability and uncertainty in the aircraft trajectory that make it difficult to precisely determine the aircraft's location at future times. It is this deficiency that produces errors in the determination of conflict and causes problems in the design of an effective alerting system.
The use of a probabilistic approach can be helpful when uncertainty is expected or prevalent. It allows assessment of the likelihood of specific outcomes and provides the end-user with additional information that could be beneficial in the decision-making
process. Probability methods can also be placed in the role of assessing the overall hazard level of the encounter situation and the difficulty of resolving the conflict at hand. By utilizing these properties, the effects of various uncertainty elements in the aircraft trajectory on alerting system performance may be analyzed. Of special interest is the importance of including additional intent information into the alerting scheme.
When aircraft intent is added into the aircraft trajectory prediction, it can
significantly reduce the uncertainty in the estimated future path and hence lower errors in conflict determination. The effects can be analyzed using probability metrics such as the false alarm rate or successful alert probability to examine the benefits of the added intent information in specific situations. However, one should be cautioned that erroneous intent assumptions could also lead to missed detections of conflicts and inaccurate
estimates of hazard. Mistakes such as these occur from incorrect modeling of the aircraft trajectories and can actually lead to additional sources of estimation errors.
1.1 Objectives
There are several major objectives contained within this thesis. One is to explain how uncertainties in trajectory estimation significantly impact and hinder conflict alerting systems. A unifying concept is proposed to explain various methods of improving
prediction and alerting performance in the presence of aircraft trajectory uncertainties. The framework ties together such approaches as improved sensor accuracy, added intent information, path conformance checking, reduced false alerts, and also probabilistic trajectory estimation into a single underlying basis for improving conflict prediction and alerting. In addition, a foundation is laid to explain how probability concepts are already embodied within the general framework of alerting system design.
Finally, this work presents a method used to model, analyze, and compute the likelihood of conflicts in the presence of uncertainties. The approach uses probability density functions to model potential trajectories and utilizes Monte Carlo simulations to calculate the likelihood of violating separation minimums. A technique was developed and refined to perform the calculations in a manner efficient enough to be used as a possible real-time conflict detection and resolution probe.
1.2 Overview of Thesis
To begin, Chapter 2 introduces the relevant terms and definitions used to describe alerting system performance. The notion of uncertainty in the state trajectory estimation and its effects on prediction and alerting is given here in the context of state-space terminology. Also, the tradeoff between false alarms and missed detections is presented using System Operating Characteristic curves.
In Chapter 3, the problem of conflict detection and resolution is formally
introduced. A brief overview of current operational and developmental conflict alerting approaches are discussed. Initial motivation will be provided for the use of the
probabilistic approach as compared to other previous modeling efforts, though the foundation will be further substantiated in subsequent chapters.
Chapter 4 gives a general guideline for improving alerting performance in the presence of uncertainties. It ties together various approaches from two main goals of increasing prediction accuracy and reducing inherent uncertainty. The importance and concept of uncertainties and trajectory modeling errors are also explained in terms of their degrading effects on the alerting system performance.
A probabilistic connection is developed in Chapter 5 from looking at the typical alerting system design approach from a different perspective. The paradigm provides further motivation for utilizing probabilistic trajectory models for conflict alerting and prediction.
Chapter 6 discusses the methodology and tools used in this thesis for the
calculations of the conflict probabilities (Monte Carlo simulations). The basic trajectory model is developed and accuracy in its modeling is discussed.
In Chapter 7, several example conflict encounters are studied utilizing the methodology developed in this thesis. The potential of the method to handle very complicated situations is shown by these examples.
Chapter 8 describes an effort of transforming probabilistic conflict analysis into a real-time alerting system. Issues related to the use of probability and the implementation of real-time conflict probing are discussed. Experience and lessons learned are brought forth.
Chapter 9 provides a final summary and major contributions introduced in this thesis.
Chapter 2
Review of Alerting System Performance
At its root, conflict detection and resolution is a process of determining the existence of a possible hazard and alerting the air traffic controller and/or flight crew.
Accordingly, it is worthwhile to begin by examining the operation of the alerting system in general.
2.1 Generic Alerting System
A hazard alerting system is one of several safety components typically found in complex human-operated systems [Kuchar, 1995]. Its purpose is to monitor potential threats and issue warnings to human operators when undesirable events are predicted to occur. A simplified diagram of a generic alerting system within the context of the entire operating environment is shown below in Figure 2-1.
Information about the situation is measured by sensors and presented to the human operator via various types of displays. The same information or a subset of it can also be fed to an alerting system to help determine the possibility of a hazardous
situation. In many cases, a hazard can be detected by the operator from the displays themselves; however, in other instances, the operator may not be fully aware of the situation or may need additional confirmation to aid in decision making. An alert is
supposedly a prediction that an unsafe state may occur, but reliance is usually still on the human operator to make the final decision. The degree of automation can vary, with
advisories. It is also possible to have an alert fully automated to initiate a resolution, and the operator is only informed of the action.
Operating Procedures
Figure 2-1: Generic Alerting System in Operation with Human Operator [Kuchar, 1995]
2.2 State-Space Representation of Alerting Systems
The use of state-space representation is a way of introducing the concepts and issues associated with alerting system design. The method was developed by Kuchar [1995, 1996] and is based on multivariable control system theory. The following is a brief review from that previous work.
In the approach, the variables x, (t), x2 (t),..., x,, (t) describe the states of the
encounter situation at time t. These states can be thought of as the set of parameters utilized by the alerting system logic to characterize the dynamics of the threat condition. The state vector, x(t), is then defined as:
x(t) = [xI(t) x2(t) --- x1(t)T
(2.1)
where n is the number of elements chosen to describe the situation. At any given time, t, the current state of the system, as known to the alerting logic, is at some particular point identified by x(t) in the n -dimensional state-space X.
2.2.1 State Trajectory
The states of the system will typically change over time during the course of operation. These changes in the state vector occur in accordance with the system
dynamics, the environment, and the inputs from the human controller. The set of values of x(t) over a given time interval is the state trajectory. Figure 2-2 shows an example of
a state trajectory as viewed in a State-Space Diagram.
X2
State-Space
X x(t)
State Trajectory
x(t) = [xI(t) x2(t)]T
Figure 2-2: Example State-Space Diagram 2.2.2 Hazard Space
In certain regions of the state-space X, there are domains where undesirable events can occur. These regions are termed hazard space (as denoted by H). Whenever
alerting system has failed to provide the necessary protection to prevent an unwanted event. An example of hazard space as depicted in a State-Space Diagram is shown in Figure 2-3.
X2
State-Space
Hazard Space
X1
Figure 2-3: Example Hazard Space in State-Space Diagram 2.2.3 Alert Space
The alert space is defined as the set of all state-vectors, x(t), in which the alerting system will warn the operator in order to prevent a possible intrusion into hazard space. By definition, no alerts are generated when x(t) is outside the alert space. The
boundaries of alert space are considered the alerting thresholds and basically define when alerts are given and when they are not. In a given state-space, X, the regions of alert space will be denoted as XA.
In Figure 2-4, an example alert space is shown in a State-Space Diagram. When the state trajectory first enters alert space (point 1), an alert will be given. At this point, the alerting logic has decided that an intrusion into hazard space is likely if nothing is done to warn the human operator (solid line). In other words, the alerting thresholds have been surpassed. By initiating the alert, it is expected that some action will be performed (depicted at point 2) to alter the course of the state trajectory (dashed line) in order to prevent a hazard from taking place. There is usually some delay from point 1 to point 2
as the human operator decides on the appropriate response to take. Because an alert is a precursor warning to avoid a hazard, the alert space should encompass all regions of hazard space. X2 Trajectory , After Alert State-Space Initial Projected Trajectory Al ert Space XA X1
Figure 2-4: Example Alert Space in State-Space Diagram
2.3 Alerting Decision Outcomes
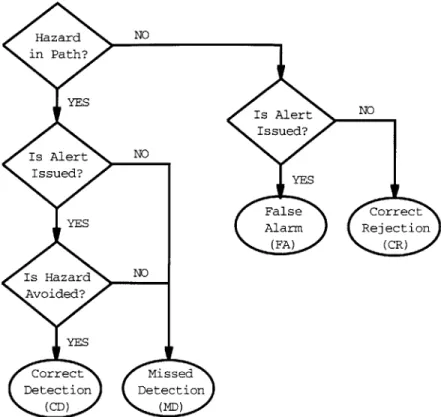
Ideally, an alert correctly notifies when a hazard will occur if nothing is done to alter the current situation of the system. To be more complete, the alert should also allow for absolute resolution of the threat if it is to be considered a safety feature. If both these elements are satisfied, then the alert is termed a correct detection (CD). If, however, the hazard is not prevented (whether or not an alert is given), the outcome would be
considered a missed detection (MD) because the system has failed to provide the intended safe avoidance of the hazard. An alert that is given but was not necessary (because a hazard would not have occurred in the first place) is usually termed afalse alarm (FA). For sake of completeness, normal operation with no threat and correctly indicated by the alerting system will be considered a correct rejection (CR). The complete decision outcome is diagrammed in Figure 2-5.
Figure 2-5: Alerting Decision Outcomes
The corresponding outcomes can be graphically depicted using State-Space Diagrams as shown in Figure 2-6. The points 1 and 2 refer to when the alert is given and when the response action is initiated, respectively. The solid lines are used to indicate the state trajectory which would have occurred had the alert not been given, and the dotted lines refer to the new state trajectory from the response to an alert. Figure 2-6a (correct detection) has been discussed already, and along with Figure 2-6d (correct rejection), represent the two cases of an ideally operating alerting system.
a) Correct Detection
X2
b) Missed Detection (No Alert/Late Alert)
X2 i
2 x(t) 1 2
H H
;pace Alert Space
x1 x
c) False Alarm (Nuisance Alert/Induced Hazard)
X2
EAlert Space% XA
d) Correct Rejection
Figure 2-6: State-Space Diagrams of Alerting Outcomes
X2 X2 X2 x(t) 1.2, A~lert ASpace X
Trouble occurs when either a missed detection or a false alarm is experienced. In the case of a missed detection, an alert is needed (state trajectory will enter hazard space) but the alerting system fails in preventing the hazard from occurring. Sometimes, a missed detection is further sub-divided into two categories as shown in Figure 2-6b: missed detection due to no alert and missed detection due to late alert [Winder and Kuchar, 1999; Haissig, et al. 1999]. The former is most likely due to lack of information of the states of the system (both x(t) or H) or from design errors in the alerting
algorithm. In the late alert case, either the operator is not given enough time to decide and perform the appropriate action, or for some reason, the warning is not heeded or is just ignored.
False alarms, as depicted in Figure 2-6c, occur whenever an alert is given but the state trajectory would not have entered into hazard space without it. A false alarm can also be parsed down further into two sub-categories: false alarm resulting in no hazard (nuisance alert) and false alarm causing induced hazard [Drumm, 1996; Winder and Kuchar, 1999; Haissig, et al. 1999]. Both cases decrease efficiency and increase
workload for the human operators involved. At first glance, it might seem that the former would be of little concern to safety. However, the increased occurrence of such nuisance alerts can directly impact the response of the human operator in actual emergency
situations. This is especially important when quick and decisive action is called for in order to prevent a catastrophic loss of the system (e.g. collision between two aircraft). 2.4 Tradeoff Between Missed Detections and False Alarms
When a state trajectory first enters the alert space (assuming x(t) is coincidental with point 1 in Figure 2-4), an alert is initiated. As stated earlier, the boundaries of this alert space define the alerting threshold of the alerting logic. Since x(t) is only an
estimate of the current state of the threat condition, an element of prediction is inherently
involved in determining the path that x(t) will follow. The decision to alert is based on the logic's prediction that an intrusion into hazard space is likely given this x(t). If the
prediction is wrong, then a false alarm (FA) has occurred. If the prediction is correct, then either the alert prevents the hazard from occurring (CD) or the alert is too late in
avoiding a hazard space incursion (MD). Thus the event of an alert results in one of 3
mutually exclusive outcomes: CD, MID, or FA. The likelihood of any of these events
occurring (given an alert) can be expressed in statistical properties such as the probability
of correct detection, P(CD), missed detection, P(MD), and false alarm, P(FA).
If the alert space is made relatively large, alerts will occur more often during the
operation of the system. This is the conservative approach. It can reduce the number of
missed detections but at the expense of an increased rate of false alarms. If the alert
space is made relatively small, less alerts will occur (fewer false alarms), but at the
expense of increased missed detections from late alerts. Thus, here lies the fundamental
tradeoff between MD and FA in alerting system design: reducing P(MD) will increase
P(FA) while reducing P(FA) will increase P(MD). The result is similar to the problem found in signal detection theory as demonstrated by Kuchar [1995, 1996] in his work on
System Operating Characteristic (SOC) curves. An overview of the SOC technique is
presented in a later section.
The reason a larger alert space will generally increase P(FA) lies in the mere fact
that more states are included in the alert space. This allows for a higher probability that
an alert will be induced whether or not it is needed. There is much more room for error
in the prediction that hazard space will be reached if nothing is done. Take, for example, Figure 2-7a where the alert space is relatively large compared to the hazard space.
state trajectory will not enter into the region of hazard space as compared to the case in Figure 2-7b where the alert space is smaller. Thus, the larger alert space will usually result in a higher rate of false alarms.
X2 x (t) 1 HW Alert Space XA X1
a) Larger Alert Space (More Alerts/Higher Rate of FA/Lower Rate of MD)
X2 A
1
Alert Space X A
b) Smaller Alert Space (Fewer Alerts/Lower Rate of FA/Higher Rate of MD)
Figure 2-7: Effect of Alert Space Size on False Alarms
However, the smaller alert space may end up sacrificing the ability to escape from the hazard (i.e. provide insufficient warning time) and thus lead to a higher rate of missed detections. This tradeoff is the fundamental design challenge which alerting system designers are often faced with.
2.5 Role of Uncertainty in the Alerting Outcome
Due to the nature of prediction, the estimate of future events is inherently uncertain to some extent. As alluded to in the previous section, the path of the state trajectory is usually not known exactly. This leads to a statistical description of the alerting outcomes (e.g. P(CD), P(MD), and P(FA)). Much of this can be attributed to uncertainties with predicting the state trajectory from only the current state, x(t).
Take, for example, Figure 2-8 where three different aircraft encounter scenarios are shown. In each case, the range (r) is 100 nautical miles and the range rate (P) is 566 knots. If the alerting decision is to be based on only these two parameters, then the current state vector x(t) = [r .]T would be identical for each of these three cases - the
alerting algorithm would be unable to tell them apart. However, the outcome from each scenario is decidedly different. In the case of Figure 2-8a, a direct collision would occur, while in the other 2 cases, no real threat is encountered.
The comparison between Figure 2-8a and Figure 2-8b is especially important to note because it shows just how much the predictive path of the vehicle states can come into play even with the same apparent initial conditions. Though the current position and
velocity of each aircraft is the same in these cases, the latter would result in a false alarm if an alert were to occur at the present time.
400 kts 410, 0 400 kts 0 M) -) 0) 0Zi
a) Direct Collision Outcome
289 kts
289 kts
98 nmi
c) No Collision Outcome
Figure 2-8: Example Encounters with the Same State Vector,
x(t) = [r -]T = [100nmi 566kts]T
In the case of Figure 2-8c, the situation appears quite different to the previous two scenarios, but would actually be transparent to an alerting algorithm based on only
relative range and range rate at the current time. Unless some other provision is included to differentiate the scenes (e.g. relative bearing), the alerting algorithm would likely treat all three scenario encounters the same at this particular instant in time. The consequence of this is a higher degree of uncertainty in the alerting decision outcome. This effect can be seen in the state-space representation shown in Figure 2-9 where the state trajectory of the three cases from the previous figure are plotted. In the figure, a hazard is assumed to
b) No Collision Outcome
U0
be a loss of separation of some predefined distance, such as 5 nautical miles or less, between aircraft. [knots] Hazard Space 600 400 200 0 -200 -400 -600 -800 100 r [nmi] x(t)
Figure 2-9: State-Space Representation of Figure 2-8
As shown in the figure, 2 of the 3 scenarios would have incurred a false alarm if the decision was made to alert at x(t). The result would be a high rate of false alarms
due to the inability to predict the outcome of the action from current state vector. Even if the decision to alert is justified, such as in Figure 2-8a, there can be further uncertainties that affect the new state trajectory in response to the alert. These
uncertainties (e.g. response time and avoidance action) would inevitably influence the likelihood that the hazard could be avoided. The outcome would be a direct impact of the correct detection and missed detection (by late alert) rates, P(CD) and P(MD),
respectively.
Further uncertainties, such as those due to stochastic randomness, can enter into the problem as well. In the case of aircraft, this could include fluctuations in speed,
heading, or altitude of each vehicle involved. There may also be course changes not known at the present time that could by initiated by the flight crew to avoid weather or meet performance goals (e.g. time of arrival, fuel savings, flight comfort). The changes may also be inadvertent due to pilot blunders to maintain an expected course of flight. All this leads to uncertainties in the state trajectory which can affect the outcome of each alerting decision.
2.6 System Operating Characteristic Analysis
The approach of the System Operation Characteristic (SOC) method has its roots in signal detection theory. It was developed by Kuchar [1995, 1996] to help analyze and design alerting thresholds by examining the tradeoff between successful alerts and false alarms. Much of the method is based on the use of probabilistic trajectory analysis in the propagation of the state vector.
2.6.1 Probabilistic Trajectories and the Probability of Conflict
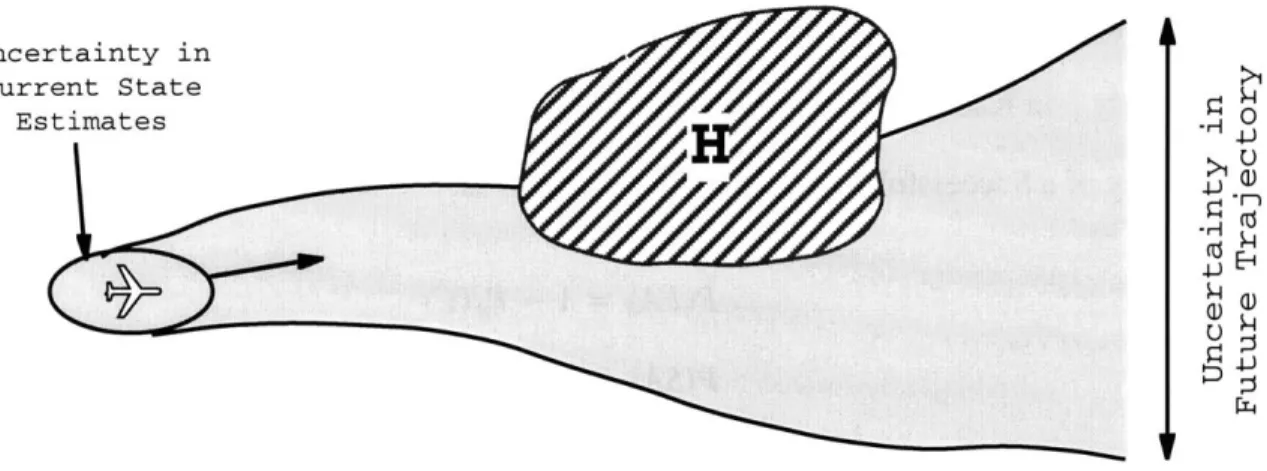
As stated before, the prediction of future events inevitably involves uncertainties, and the same is true of the state trajectory. In general, the path of the true state trajectory is not known exactly, and it can be assumed to be probabilistic and include uncertainties to some degree. The concept is detailed in the following Figure 2-10 where the shaded area represents possible state positions, or uncertainties, in the future of the system. Usually, but not always, the uncertainty in the trajectory will tend to grow with time as it naturally becomes more difficult to predict further into the future.
Current State >1
Estimates . O
Figure 2-10: State Trajectory with Uncertainties
In state-space, the term conflict will refer to the occurrence of an undesirable event (i.e. hazard space incursion of the state vector). In estimating the likelihood of its
occurrence, the term Probability of a Conflict, P(C), will be used.
2.6.2 Nominal and Avoidance Trajectories
To determine if an alert is warranted in a given situation, it is necessary to examine the hypothetical outcomes of the alert / no alert decision. If no alert is issued, the state continues along what will be termed the projected nominal trajectory, denoted as N. Similarly, in response to an alert, there is a different projected path that is taken called the avoidance trajectory, denoted A. Both N and A are, in general, probabilistic due to the uncertainties in the current and projected future states. During an avoidance action, there are many variables which may make it difficult to predict the exact path taken, especially with human involvement (e.g. different response times and actions).
Trajectory A may also include the possibility that no action is taken in response to the alert.
The probability of conflict along N and along A are denoted PN(C) and PA (C), respectively.. In Kuchar [1995], the Probability of a False Alarm, P(FA), and the Probability of a Successful Alert, P(SA), are defined as:
P(FA) = 1 - PN( (2.2)
P(SA) = 1 - PA(C) (2.3)
In the above two equations, both P(FA) and P(SA) are conditional upon an alert being given. Also, P(SA) is specific to a particular avoidance trajectory, A.
2.6.3 SOC Curves
In previous work, Kuchar [1995, 1996] explored the performance tradeoff between false alarms and successful alerts. This technique is based on the System
Operating Characteristic (SOC) Curve which facilitated the visualization of the exchange between the two parameters. In any conflict detection decision, there is usually some probability that the alert is not needed. Additionally, there is some probability that the alert is successful in prevent a conflict. As one varies the time at which the alert is
generated, these probabilities trade off against one another as described by an SOC curve. In order to determine if an alert is successful, it is necessary to consider what resolution action occurs when the alert is given. Some conflict resolution maneuver must be assumed so that it can be determined whether a conflict is ultimately averted by the alert. Thus, a SOC curve is specific to both the encounter geometry and the type of resolution action that is prescribed. In simple terms, a SOC curve is a plot of P(SA) versus P(FA) along a specific nominal path, N, and for a specific avoidance maneuver, A.
The choice of avoidance trajectories for conflict analysis will depend on the performance criteria to be met. The criteria can be safety-based, in which the trajectory is to reflect an aggressive maneuver, or it can be more cost driven, in which the trajectory represents a more strategic maneuver.
A sample SOC plot is shown in Figure 2-11 for a path on a direct collision course to a hazard. The points 1 and 2 correspond to different alerting times, with point 1 being earlier than point 2. If the conflict decision is made while the hazard is far away, (upper right corner of the plot), the probability of a successful alert is likely to be very high
(P(SA) -> 1); but because action is taken so early, the probability of a false alarm is also
high (P(FA) -> 1). With the hazard far in the distance, there is typically too much uncertainty in the nominal N trajectory to alert without knowing if it was really necessary. As the conflict alert decision is delayed and the hazard continues with increasing threat, the probability of successful alerts and false alarms both decrease as shown by the curve. If alerts are delayed too long, the alerts will not be successful
(P(SA) -> 0) and there will be no false alarms as well (P(FA) -* 0).
1.0 1 2 P(SA) 0 0 P (FA) 1.0
The SOC curve shows the tradeoff between P(FA) and P(SA) as a function of the alerting threshold location for a series of decision points along a chosen path. The curve in Figure 2-11 clearly shows the effect of delaying the alert on reducing the chance of a false alarm. The corresponding drop in a successful alert, P(SA), is also evident. The location of the threshold can be examined relative to the desired level of nuisance alerts and safety margin. It is also possible to utilize the SOC curve as part of a preliminary design evaluation for setting the alert threshold.
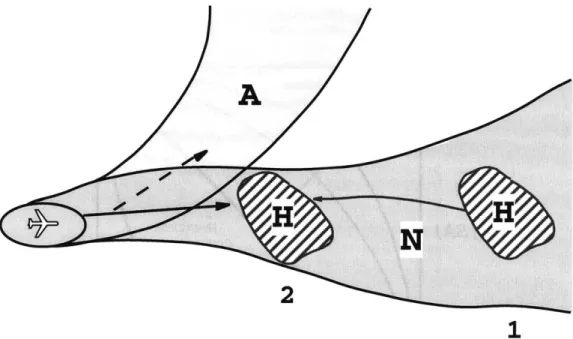
In Figure 2-12, a pictorial perspective on the underlying principle behind the SOC is given. Far away, with the hazard at location 1, there is usually sufficient uncertainty to warrant delaying an alert so that false alarms are not too predominant. However, waiting too long may result in an unavoidable hazard (missed detection). The state-space analogy was explained back in Figure 2-7 with the discussion on the alert space size.
As mentioned earlier, high rates of nuisance alerts can lead to mistrust of a system, and thus, also indirectly impact safety. Deciding when to alert (i.e. threshold placement) is one of the most crucial elements in alerting design. The choice becomes obvious in Figure 2-12 when the avoidance trajectory, A, is superimposed over N. To ensure the alert is successful, it must be issued prior to a high likelihood of conflict along the avoidance trajectory (location 2). In other words, the alert must be in time for the aircraft to avoid the hazard. This appealing concept is captured nicely in SOC plots.
A
H
2
1
Figure 2-12: Delaying the Alert
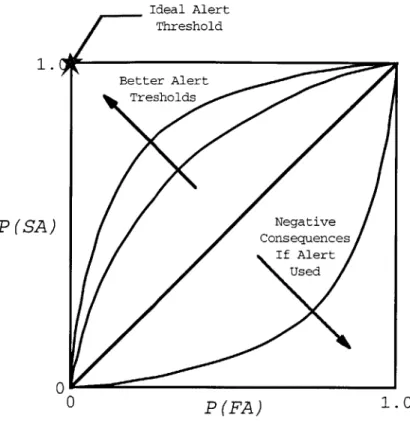
The shape of the SOC plot can provide a lot of information regarding the possible performance of the alerting system. A curve that allows placement of the threshold at the upper left corner (P(FA) = 0, P(SA) = 1) is considered ideal since there would be no false alarms and only successful alerts (see Figure 2-13). Due to uncertainties in the conflict dynamics, however, the SOC curve will generally lie somewhere below this optimal point. The closer a system is able to operate near this optimal point, the more effective the system will be in terms of providing an acceptable level of safety while minimizing unnecessary alarms.
Ideal Alert Threshold 1. Better Alert Tresholds P ( SA) Negative Consequences If Alert Used 0 0 P (FA) 1.0
Figure 2-13: Various Shapes of the SOC Curve
A curve that lies diagonally from the origin (P(FA) = 0, P(SA) = 0) to the upper right corner (P(FA) = 1, P(SA) = 1) represents either a poorly chosen avoidance maneuver for the particular encounter or an inherently difficult situation due to the uncertainties involved. In such circumstances, the alert basically has no effect in altering the outcome of a conflict. The alert is just as likely to produce a conflict as if no alert was given. Thus the more the SOC curve deviates upward from the diagonal, the more likely a better alerting decision can be determined.
It is also possible that an alert can induce a negative consequence in the encounter situation. In this case, the avoidance trajectory incurs a higher likelihood of a conflict that along the nominal trajectory when no alert is given. The resultant SOC curve would deviate below the diagonal as shown in Figure 2-13.
The characteristic bend or drop in P(SA) that is sometimes found in an SOC plot can be largely attributed to the specific avoidance maneuver being examined, but is also influenced by the underlying uncertainties in both the nominal and avoidance trajectories, N and A, as well as that from the hazard, H. In general, if no uncertainties were present and the future trajectories could be predicted with utmost precision, then an ideal alerting system would most likely be possible. A point at the upper left corner would exist provided the alert is given early enough. Different maneuvers would affect the required alert time, though. A 30 degree bank turn maneuver performed by an aircraft may provide an ideal system for a specific encounter if the alert is given prior to 15 seconds prior to predict conflict, while a 1000 feet per minute climb, in the same situation, might need the alert to be given 23 seconds ahead of time. But assuming there are no
uncertainties involved, both maneuvers could provide perfectly ideal alerting thresholds
(P(FA) = 0, P(SA) = 1).
Each of the 4 extreme corners in the SOC diagram represents an absolute
certainty condition. Thus, if no uncertainty is present in the trajectory or position of the aircraft, the state must lie at one of these corner positions. Either a conflict will exist along the nominal trajectory, N, or it does not. Either the conflict can be avoided with the avoidance trajectory, A, or it can not. These 4 extreme conditions are shown in Figure 2-14. Although it is assumed here that the trajectories are known perfectly, it is still
possible for the SOC curve to be at any of the corner positions even with some
uncertainties present in the trajectories. Most likely, however, the locus of points will lie somewhere within the boundaries of the 4 corners.
A
P(SA)
-N
P(FA)
a) No Alert Needed but Alert Causes No Conflict (P(FA) = 1, P(SA) = 1)
A
P(SA)
N
P(FA)
b) Alert Need and Alert Successful (P(FA) = 0, P(SA) = 1)
A
P(SA)
N
P(FA)
c) Alert Needed but Alert Unsuccessful (P(SA) = 0, P(SA) = 0)
A
P(SA)
N
P(FA)
d) No Alert Needed and Alert Induces Conflict (P(FA) = 1, P(SA) = 0) Figure 2-14: Four Corners of the SOC Diagram
Thus the shape of the SOC curve can also serve as a visualization tool to gauge the effects of uncertainties in the encounter scenario. If a high level of uncertainty existed in a trajectory (either N or A), then the curve would tend to diverge from the corner positions. The result could be used to determine if a more severe avoidance option is necessary, or even to consider a different type of maneuver altogether - one that is more robust to the uncertainties involved in the scenario.
2.7 Summary
The use of the state-space representation was shown as a way of presenting the concepts associated with alerting system design. It was used to explain the ideas behind alerting performance and the parameters associated with the different alerting decision outcomes: correction detection, missed detection, false alarm, and correct rejection. Also, the System Operating Characteristic technique was highlighted as a method for examining different performance tradeoffs and provides a framework for analyzing alerting performance in later chapters.
Chapter 3
Conflict Detection and Resolution Methods
3.1 Conflict Detection and Resolution
Methods for maintaining separation between aircraft in the current airspace
system have been built from a foundation of structured routes and evolved procedures. In this framework, humans have been an essential element in this process due to their ability to integrate information and make judgements. However, because failures and
operational errors can occur, automated systems have begun to appear both in the cockpit and on the ground to provide decision support and to serve as traffic conflict alerting systems. These systems use sensor data to predict conflict between aircraft, alert humans to the conflict, and may also provide commands and guidance to resolve the conflict. Together, these automated systems provide a safety net should normal procedures and
controller and pilot actions fail to keep aircraft separated beyond established minimums. Recently, interest has grown into developing more advanced automation tools to detect and resolve traffic conflicts. These tools could make use of more advanced technologies, such as datalink of current aircraft flight plan information, to enhance safety and enable new procedures to improve air traffic flow efficiency.
To begin, it is necessary to have a clear definition of what constitutes a conflict. For the majority of this thesis work, a conflict will refer to a situation in which an aircraft experiences a loss of minimum separation with another aircraft. In other words, the distance between them violates a preset criterion that is considered
undesirable. One example might be a 5 nautical mile horizontal distance between aircraft and a 1000 feet vertical separation (current Air Traffic Control standards). The result is a protected zone or volume of airspace surrounding each aircraft that should not be
infringed upon by another vehicle (see Figure 3-1). The protected zone could also be defined much smaller depending upon the goals of the alerting system (e.g. parallel runway incursions). It could also be specified in terms of parameters other than distance, such as time. In any case, the underlying conflict detection and resolution functions are similar although the specific models and alerting thresholds would likely be different.
5 nmi
1000' 1000'
Figure 3-1: Example Protected Zone Around Aircraft
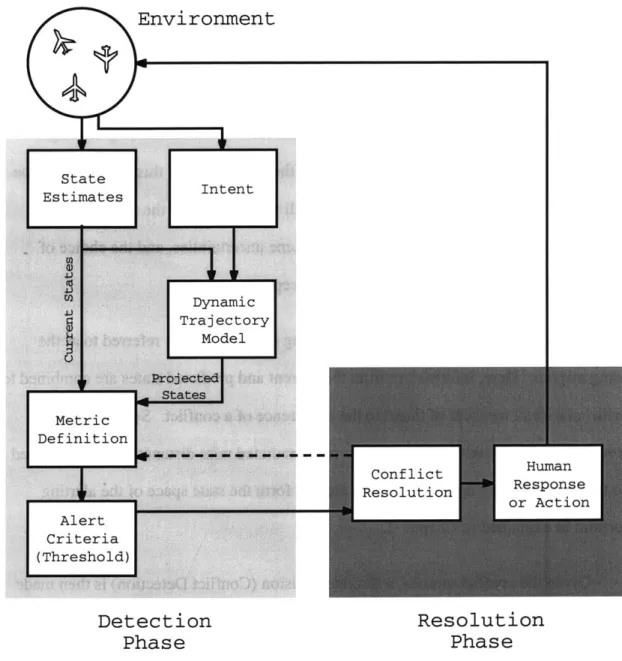
Any traffic management system in which vehicles are monitored and controlled to prevent collisions has certain basic functional requirements. The objective of a conflict avoidance system is to predict the occurrence of a conflict, communicate (alert) the detected conflict to the human operator, and then, in some cases, assist to resolve the conflict situation. These three fundamental processes can be organized into several phases or elements as shown in Figure 3-2.
To begin, the traffic environment must first be monitored and the appropriate aircraft state information must be collected and disseminated using sensors and communication equipment. These states provide an estimate of the current traffic situation (e.g. aircraft positions and velocities). However, due to sensor limitations, the information may not be complete enough to describe the actual situation. For example, a
system may only have access to range and range rate information and unable to determine bearing (recall the state-space example of Figure 2-9). Additionally, there is generally some uncertainty within the values of the available states.
Detection Resolution
Phase Phase
Figure 3-2: Conflict Detection and Resolution Framework
Information regarding the future intent of aircraft may also be available to the alerting algorithm. Such data might include the waypoints in flight plans, level-off altitudes in vertical maneuvers, or commanded heading during turns. The information
can be used to provide additional prediction accuracy to the future trajectories of each aircraft. It is also possible that the intent of an action will not be followed so there is likely some potential uncertainties in the information as well.
Continuing on, a dynamic trajectory model is usually required to project the states into the future in order to predict whether a conflict will occur. This projection may be based solely on the current state information (e.g. a straight-line extrapolation of the current velocity vector) and may include additional intent information (e.g. the flight plan). As shown before in the previous chapter, the importance of this model cannot be understated as it has a direct impact on the overall performance of the system. Any prediction of future events inherently involves some uncertainties, and the choice of dynamic model to estimate future states is no exception.
The parameters used for the actual alerting decision will be referred to as the alerting metrics. Here, information from the current and predicted states are combined to provide an overall measure of threat to the occurrence of a conflict. Some example metrics include the relative range, closure rate, predicted miss distance, or the estimated time to closest point of approach. These metrics form the state space of the alerting algorithm as explained in Chapter 2.
Given the conflict metrics, a discrete decision (Conflict Detection) is then made regarding whether or not to inform the human operator of a threat. Often, this decision is based upon a simple check against specific thesholds (e.g. take action if predicted miss distance is less than 5 nautical miles), but could involve a more complex set of rules. The thresholds may include corrective adjustments or safety buffers to account for
Note, however, that the prediction of a conflict need not always require a notification. A conflict may be predicted, but its occurrence may be too far into the future or too uncertain to be considered a threat at the current time. The decision to alert could also hinge upon user preference, experience, or operational factors. For the
purpose of this thesis work, a conflict is detected once it is both predicted to occur and it has been determined to be appropriate to alert the operator.
In some cases, notification of a conflict is all that is required of the alerting system (the human operator is expected to resolve the conflict independently). In other cases, a Conflict Resolution phase may be initiated. This involves determining an appropriate course of action and transmitting that information to the operator. For example, the system might present to the pilot of an aircraft the target rate of climb or descent necessary to avoid a potential collision with another aircraft. Although conflict resolution is shown as a single block in Figure 3-2, it requires its own set of current state estimates, a resolution maneuver trajectory model, and decision criteria which may be different from those used in the Conflict Detection phase. This simplification in the figure was intended to make the schematic less cluttered without diminishing the meaning of the concepts.
The response of the human to the alert is also critical to the design and efficacy of the alerting system as well. In many instances, the human's response can be included to
some extent within the determination of the resolution maneuver, such as a 5 second delay. However, the human response is inevitably variable and needs to be considered as another source of uncertainty in the overall scheme of the conflict alerting process.
In the framework of Figure 3-2, conflict detection can be thought of as deciding when action should be taken while conflict resolution can be looked upon as determining
how or what action should be performed. In practice, there may not always be a clear separation between alerting and resolution, however. Deciding when action is required may depend on the type of action to be performed; and similarly, the type of action that is required may depend on how early that action begins.
The multitude of various metrics and thresholds and also the interdependence between conflict detection and resolution are factors which make alerting system development challenging and interesting because there are many feasible design
solutions. As will be shown in the next section, there are a number of ways to tackle the problem and develop a feasible solution. A more difficult task is determining the best one.
3.2 Survey of Algorithmic Designs
To provide better insight into different methods of conflict detection and resolution, a literature review of previous research approaches and current operational and developmental systems was performed. A total of over 60 different papers were used and a more detailed discussion can be found in Appendix A. These methods do not represent an exhaustive list by any means, but are believed to encompass a majority of the recent approaches to the conflict detection and resolution problems.
3.2.1 Current Operational Systems
3.2.1.1 Traffic Alert and Collision Avoidance System (TCAS)
The Traffic Alert and Collision Avoidance System (TCAS) has been the standard that many approaches to the conflict detection and resolution problem have been
compared to. The system has been implemented on U.S. jet transports since the early 1990's as concern over the potential of future mid-air collisions grew. The algorithm is
more complicated than will be explained here, so the reader is asked to refer to Ford [1986, 1987], Kuchar [1995], Miller et al. [1994], RTCA [1983], or Williamson [1989] for a more detailed description.
In abbreviated terms, the TCAS logic calculates threat in the horizontal and vertical dimensions separately and alerts if both criteria are met. The algorithm is based on the relative range (r) and range rate (-), and also the relative altitude (h) and altitude rate (h). TCAS uses a two-stage process with a cautionary alert called the Traffic
Advisory (TA) and a warning alert called the Resolution Advisory (RA). RAs provide vertical avoidance commands, but TAs are merely cautions and lack any resolution. The following discussion will focus on RA alerts only.
The TCAS thresholds are actually more complex, but for the most part, can be summarized by what is commonly referred to as the Tau Criterion shown in Equation 3.1.
r - DMOD
. < r(3.1)
-r
r is a threshold parameter with units of time, and DMOD is a buffer distance used to account for slow closure rates, ensuring that aircraft will not drift closer than the DMOD distance without receiving an alert [Williamson, 1989]. Within the alerting logic, these two parameters are varied depending on the altitude and whether or not the aircraft are maneuvering vertically. These values are summarized in Figure 3-3.
In the notation used in the figure, the first value listed for r is the alerting
threshold for the TCAS equipped aircraft if it is level, or is climbing or descending in the same direction as the threat but at a lower rate; else the second value is used.
30,000' MSL
20,000' MSL
10,000' MSL
5 MSL
T = 30/35 sec ZTHR = 800 ft DMOD = 1.1 nmi ALIM = 700 ft
T= 30/35 sec ZTHR = 700 ft
DMOD = 1.1 mni ALIM = 600 ft
T = 22/30 sec ZTHR = 600 ft
DMOD = 0.8 nmi ALIM = 400 ft
T = 20/25 sec ZTHR = 600 ft
DMOD = 0.55 nmi ALIM = 350 ft
ZTHR = 600 ft
2350' AGL
1000' AGL
Ground Altitude
MSL = Mean Sea Level
AGL = Above Ground Level
Figure 3-3: TCAS Version 6.04A RA Logic Parameters
The vertical criterion is a little more complicated, but in essence, also utilizes a Tau Criterion to estimate the time to co-altitude. It includes various buffers and
parameters (ZTHR, ALIM) that are variable depending on the flight altitude and relative vertical separation.
The left side of the Equation 3.1 can also be thought of as an estimate of the time it will take for the range to decrease to a distance, DMOD, between aircraft [Miller et al., 1994]. From this point of view, the TCAS logic is assuming a straight line projection model and DMOD is acting as a buffer to account for possible deviations or sources of error.
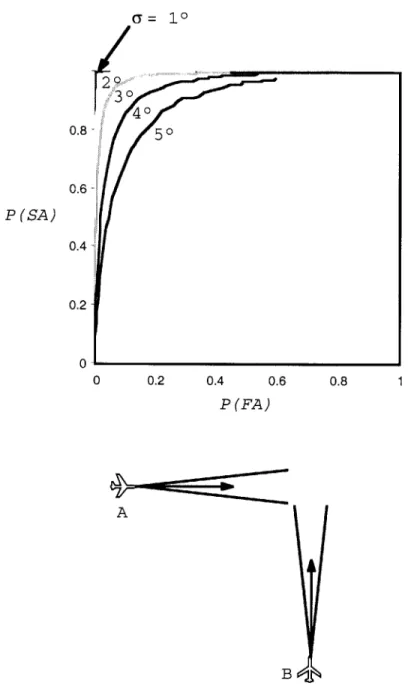
A possible state-space representation of the alerting logic at work is shown in Figure 3-4. Here, the aircraft are assumed to be in level flight (30,000 feet) and traveling
in opposite directions, each with a velocity of 400 knots. For case A, the opposing aircraft are on course for a direct collision; while in case B, the aircraft will miss by 5 nautical miles. A 5 nmi B r-DMOD -r (sec) 100 90 80 -70 60 50 -40 -30 20 10 0-0.0 - - -- T = 30 sec 10.0 20.0 r (nmi)
Figure 3-4: TCAS Example
Notice that for a range greater than about 10 nautical miles, it becomes
increasingly more difficult for the TCAS logic to differentiate between the two cases. The r threshold is 30 seconds for this particular scenario, which is just below the lowest point for which case B would trigger an alert. Trying to extend the warning time of TCAS in its present form would only introduce an increase in false alarms as shown from
![Figure 2-1: Generic Alerting System in Operation with Human Operator [Kuchar, 1995]](https://thumb-eu.123doks.com/thumbv2/123doknet/13913838.449151/15.918.200.728.197.537/figure-generic-alerting-operation-human-operator-kuchar.webp)