Molecular Ecology (2005) 14, 1727–1739 doi: 10.1111/j.1365-294X.2005.02506.x
Blackwell Publishing, Ltd.
Beyond the Mediterranean peninsulas: evidence of central
European glacial refugia for a temperate forest mammal
species, the bank vole (
Clethrionomys glareolus
)
V . D E F F O N T A I N E ,*† R . L I B O I S ,* P . K O T L Í K ,‡§ R . S O M M E R ,¶ C . N I E B E R D I N G ,*† E . P A R A D I S ,†† J . B . S E A R L E§ and J . R . M I C H A U X*†
*Unité de Recherches Zoogéographiques, Université de Liège, B22, 7000 Liège, Belgium, †Centre de Biologie et de Gestion des
Populations (CBGP), UMR 1062, Campus international de Baillarguet, CS 30016, 34988 Montferrier/Lez (Montpellier), France,
‡Institute of Animal Physiology and Genetics Academy of Sciences of the Czech Republic, 277 21, Libechov, Czech Republic,
§Department of Biology, University of York, PO Box 373, York YO10 5YW, UK, ¶Institute for Biodiversity Research, General &
Systematic Zoology, University of Rostock, Universitätsplatz 2, Rostock 18055, Germany, ††Laboratoire de Paléontologie, Institut des
Sciences de l’Evolution (UMR 5554-CNRS), Université Montpellier II, Place E. Bataillon, 34095 Montpellier cedex 05, France
Abstract
This study details the phylogeographic pattern of the bank vole, Clethrionomys glareolus,
a European rodent species strongly associated with forest habitat. We used sequences of 1011 base pairs of the mitochondrial DNA cytochrome b gene from 207 bank voles collected in 62 localities spread throughout its distribution area. Our results reveal the presence of three Mediterranean (Spanish, Italian and Balkan) and three continental (western, eastern and ‘Ural’) phylogroups. The endemic Mediterranean phylogroups did not contribute to the postglacial recolonization of much of the Palaearctic range of species. Instead, the major part of this region was apparently recolonized by bank voles that survived in glacial refugia in central Europe. Moreover, our phylogeographic analyses also reveal differentiated populations of bank voles in the Ural mountains and elsewhere, which carry the mitochon-drial DNA of another related vole species, the ruddy vole (Clethrionomys rutilus). In con-clusion, this study demonstrates a complex phylogeographic history for a forest species in Europe which is sufficiently adaptable that, facing climate change, survives in relict southern and northern habitats. The high level of genetic diversity characterizing vole populations from parts of central Europe also highlights the importance of such regions as a source of intraspecific genetic biodiversity.
Keywords: central Europe, Clethrionomys glareolus, glacial refugia, mitochondrial DNA,
phylo-geography, Quaternary glaciations
Received 23 August 2004; revision received 15 December 2004; accepted 21 January 2005
Introduction
The Quaternary has experienced important climatic changes that deeply modified the distribution range of species within the Palaearctic region (Webb & Bartlein 1992). During the glacial events of the Quaternary in Europe, central regions tended to be steppe-tundra, whereas deciduous forests were generally confined to the Mediterranean peninsulas (Zagwijn 1992; Blondel 1995). For temperate forest mammal species such as the bank voles studied here, it is expected that
species shifted their range according to their habitat, so that they would have survived glacial maxima in the Mediterranean peninsulas. Interglacial and postglacial recolonizations of central and northern Europe could therefore have arisen from these Mediterranean glacial
refugia (Taberlet et al. 1998; Hewitt 1999, 2001; Michaux
et al. 2003). However, southern glacial refugia have not
always been the source of postglacial recolonization of central and northern Europe. Several phylogeographic and palaeontological studies have suggested that some mammal species survived in eastern or northern glacial
refugia: the brown bear Ursus arctos in the Carpathians
(Taberlet & Bouvet 1994; Sommer & Benecke 2004), voles in Correspondence: Valérie Deffontaine, Fax: 534 9962 3345; E-mail:
1728 V . D E F F O N T A I N E E T A L .
Molecular Ecology
central Europe and the Ural mountains (Microtus agrestis
and Microtus oeconomus; Jaarola & Searle 2002; Brunhoff
et al. 2003) and the Norwegian lemming Lemmus lemmus
in periglacial area (Fedorov & Stenseth 2001). However, postglacial recolonization from northern and eastern refugia seems to be associated with animal species adapted to open habitats which were probably less affected than others by the disappearance of forests during the Quaternary Ice Age. Stewart & Lister (2001) have suggested that
forest species (bank vole Clethrionomys glareolus, wood
mouse Apodemus sylvaticus, red squirrel Sciurus vulgaris)
occupied glacial refugia in Belgium and the Norwegian coast on the basis of palaeontological data, but their interpretation of radiocarbon dates is controversial ( J.-M. Cordy, personal communication). Until now, such glacial refugia are suspected to have played a role in the phylo-geographic structure only of Arctic species such as the Norwegian lemming and some species of Alpine–Arctic flora
(Tollefsrud et al. 1998; Fedorov & Stenseth 2001).
The aim of this study is to use phylogeographic and palaeontological approaches to examine if a rodent species strongly associated with forest habitat, the bank vole, sur-vived the glacial periods in ‘northern’ or eastern refugia. The bank vole is common, easy to catch and widespread all over the western Palaearctic region except in the
Medi-terranean biome (Corbet 1978; Fons et al. 1980; Bashenina
1981; Spitzenberger 1999). Moreover, previous studies
(Tegelström 1987; Tegelström et al. 1988; Van Rompaey 1989;
Bilton et al. 1998) have suggested a complex
phylogeo-graphic pattern for this species in Europe. In particular,
the Europe-wide study of Bilton et al. (1998) proposed that
the bank vole may have occupied the northern refugia, although this was based on a small data set (20 specimens, 500 bp mitochondrial DNA sequence). Here, we present a more substantial study in terms of number of specimens and length of sequence to re-examine the question of northern refugia in this species.
Materials and methods
Samples and laboratory procedures
The genetic polymorphism of the mitochondrial cytochrome
b (cyt b) gene was analysed for 153 bank voles trapped in 51
localities. These specimens were obtained from collaborators, museums and the collection of the Zoogeography Research Unit of the University of Liège. Fifty-four additional sequences, mainly from Russia, were downloaded from
the GenBank database (Conroy & Cook 1999; Martin et al.
2000; Iwasa et al. 2002; Wickliffe et al. 2002; Dekonenko
et al. 2003) (Table 1 and Fig. 1).
Total genomic DNA was extracted from ethanol-preserved muscle, liver or spleen as described by Sambrook
et al. (1989). The cyt b gene was amplified using specific
primers designed for the bank vole: LCLE 1 (5′
-ATCAT-CAACCACKCATTTATT-3′) and MCLE 3 (5′
-ATTAT-GCCTGCTATTGGTATG-3′). Amplifications were carried
out following the protocol of Michaux et al. (2003).
Sequen-cing was performed using the external LCLE 1 primer and
an internal LCLE 2 primer (5′
-GGCACAACCCTAGTA-GAATG-3′) that produced unambiguous results. A
sin-gle strand was sequenced using a BigDye Terminator kit (Applied Biosystems) on an ABI Automated Sequencer and using an ET-Dye Terminator kit on a MegaBACE 1000 (Amersham Biosciences). The sequences were aligned using
the ED editor of the must package (Philippe 1993).
Phylogenetic analyses
Phylogenetic reconstructions were performed by a distance method using the neighbour-joining algorithm (NJ) (Saitou & Nei 1987) and using maximum-parsimony criterion (MP)
(Fitch 1971) algorithm implemented in paup version
4.0b10 (Swofford 2000), as well as the maximum-likelihood
criterion (ML) (Felsenstein 1981) implemented in the phyml
program (Guindon & Gascuel 2003). We used modeltest
version 3.0 (Posada & Crandall 1998) to determine the most
suitable model of DNA substitution for the cyt b data set
studied. MP analysis was conducted with the heuristic search algorithm, tree-bisection–reconnection (TBR) swapping and a maximum number of trees constrained to 1000.
Phylogenetic trees were rooted with cyt b sequences from
ruddy voles (Clethrionomys rutilus) and grey-sided voles
(Clethrionomys rufocanus). The robustness of the trees was
assessed by bootstrap resampling (BS) (10 000 random replications for NJ analysis, 1000 for MP and ML analyses; Felsenstein 1985). A Bayesian approach to phylogeny
reconstruction (Yang & Rannala 1997; Huelsenbeck et al.
2001) was also used, implemented in mrbayes version 2.01
(Huelsenbeck et al. 2001). Metropolis-coupled Markov
chain Monte Carlo sampling was performed using four chains run for 1 000 000 iterations and using default model parameters as starting values. Bayesian posterior probab-ilities (BPP) were picked from the 50% majority rule consensus of trees sampled every 20 generations, after removing trees obtained before the chains reached an apparent plateau (‘burn in’ determined by empirical checking of likelihood values).
Phylogeographic analyses
A network was constructed using the median-joining method
(network version 4.1.0.6 program available at
www.fluxus-engineering.com; Bandelt et al. 1999).
Demographic histories of different bank vole phylo-groups were inferred first by a pairwise mismatch distribu-tion analysis between individuals (Rogers & Harpending 1992) computed under a population growth-decline model
P H Y L O G E O G R A P H Y O F T H E B A N K V O L E 1729 Table 1 Map references, geographical locations, sample abbreviations and GenBank Accession numbers of Clethrionomys haplotypes used in this study. Accession numbers with an asterisk were downloaded from the GenBank database (see text for references)
Map. ref. Geographic origin
Total number
of animals Abbreviations
GenBank Accession numbers (for haplotypes only) Bank voles (Clethrionomys glareolus)
1 Britain Kielder 3 Brit1 AJ639662–AJ867972
2 Derbyshire 2 Brit2 AJ639666
3 Gwent 2 Brit3 AJ639665–AJ867971
4 Cambridgeshire 1 Brit4 AJ867970
5 Essex 4 Brit5 AJ867968-969
6 Spain Asturias 4 Sp1 AJ867979
7 Navarre 2 Sp2 AJ639671-695
8 Granollers 3 Sp3 AJ639672
9 France Py Mantet 8 Fr1 AJ639678-691–AJ867980
10 Montpellier 2 Fr2
11 Bourdeilles 2 Fr3 AJ639682-683
12 Saint-Aignan 2 Fr4
13 Belgium Virelles 2 Be1 AJ867965-973
14 Liège 4 Be2 AJ639661
15 Switzerland Evolene 3 Swi AJ639674-675
16 Italy Pietraporzio 1 Ita1 AJ639681
17 Trentino alto Adige 1 Ita2 AJ639692
18 Chiusi della Verna 6 Ita3 AJ639663-664
19 Lucretili mountains 1 Ita4 AJ639667
20 Germany Konstanz 1 Germ1 AF159401*
21 Gera 3 Germ2 AJ867978
22 Parchim 6 Germ3 AJ867974-975-976-977
23 Austria Tirol 12 Aus1 AJ639685-687-688-689-690–696
24 Osttirol 2 Aus2 AJ639676-694
25 Karnten 1 Aus3 AJ639693
26 Salzburg 2 Aus4
27 Slovenia Livek 3 Slo AJ867953
28 Hungary Zala 2 Hung1 AJ867954-955
29 Nagycsany 3 Hung2 AJ639707
30 Montenegro Biogradsko Jezero 3 Mont AJ639706
31 Macedonia Pelister mountains 3 Mac AJ639660-668–670
32 Bulgaria Rhodopi mountains 2 Bulg1 AJ639702
33 Rila mountains 2 Bulg2 AJ639699-700
34 Vitosha 1 Bulg3 AJ639703
35 Balkan mountains 2 Bulg4 AJ639701
36 Elena 1 Bulg5 AJ639705
37 Solnik 2 Bulg6 AJ639704
38 Romania Baile Herculane 3 Ro1 AJ867952-958
39 Timisoara 1 Ro2 AJ867963
40 Moneasa 7 Ro3 AJ867957-962–981
41 Targu Mures 5 Ro4 AJ867950-956–960
42 Zarnesti 4 Ro5
43 Bacau 2 Ro6
44 Maramures 4 Ro7 AJ867951-961
45 Slovakia Kosice 8 Sk AJ867948-949-959-964
46 Ukraine Chernobyl 2 Ukr AF318584-585*
47 Poland Pulawy 1 Po1 AJ639669
48 Bialowieza 4 Po2 AJ639698-708
49 Lituania Alytus 4 Lit1 AJ639684
50 Zemaitijos national park 3 Lit2 AJ639686–AJ867966-967
51 Finland Pieksämäki 1 Fin1 AY185798*
52 Sotkamo 3 Fin2 AF119272*, AF429812-813*
53 Puhos 1 Fin3 AY185796*
54 Kittila 2 Fin4
55 Sweden Batskarsnas 1 Swe AY185800*
56 Russia Nizhniy Novgorod 14 Ru1
AF429798-799-800-801-802-803-804-805-806-807-808-809*, AF367083-084*
57 Samara 11 Ru2
AY062900-901-902-903-904-905-906-907*, AF367080-081–082*
1730 V . D E F F O N T A I N E E T A L .
Molecular Ecology
59 Ural mountains 1 Ru4 AJ639673
60 Omsk 12 Ru5
AF429781-782-783-784-785-786-787-788-789-790*, AF367074-079*
61 Novosibirsk 4 Ru6 AF429810-811*, AF367075-076*
62 Turkey Uludag mountains 1 Turk AJ639697
Ruddy voles Clethrionomys rutilus (Outgroup 1)
Russia Okha 1 Rut AB072224*
Russia Yuzhno-Sakhalinsk 1 Rut AB072223*
Grey–sided vole Clethrionomys rufocanus (Outgroup 2)
Finland Kilpisjärvi 1 Ruf AF429815*
Russia Khabarovsk 1 Ruf AF429816*
Map. ref. Geographic origin
Total number
of animals Abbreviations
GenBank Accession numbers (for haplotypes only)
Table 1 Continued
Fig. 1 Geographic distribution of the bank vole (Clethrionomys glareolus) samples and the genetic phylogroups revealed by cytochrome b gene analyses and palaeontological data (Kowalski 2001; Nadachowski et al. 2003) in this study. The shaded zone corresponds to the distribution range of the bank vole (Corbet 1978; Fons et al. 1980; Bashenina 1981; Spitzenberger 1999).
P H Y L O G E O G R A P H Y O F T H E B A N K V O L E 1731
in dnasp version 4.0 (θ initial = 2, θ final = 200, τ = 5; Rozas
et al. 2003). Multimodal distributions were consistent with
demographic stability, while sudden expansion would generate a unimodal pattern (Slatkin & Hudson 1991). Second, we used a coalescent approach to validate the pat-terns of growing or stable populations revealed by the
mismatch distributions (Emerson et al. 2001). ML was used
to test if the data fit a model of exponentially growing or
stable populations, estimating the parameter θ = Neµ (where
Ne is the effective population size and µ the mutation
rate) and g (the growth rate) (Kuhner et al. 1995; Kuhner
1998). These analyses were performed using the programs,
coalesce and fluctuate from the lamarc package
(http://evolution.genetics.washington.edu/lamarc.html). The two demographic models were compared using a
likelihood-ratio test which follows a χ2 distribution with
one degree of freedom, the null hypothesis being that the populations were stable. The programs were run several times with different numbers of short and long Markov chains to check the consistency of the estimated parameters. The genetic structure of populations was examined
using an analysis of molecular variance (amova) performed
in the arlequin version 2.0 program (Schneider et al. 2000).
amova was conducted at three hierarchical levels of
popu-lations subdivision: among geographically delimited groups (Iberian; Italian; Balkan: Montenegro, Macedonia, Bulgaria, Turkey; western Europe: Britain, France, Belgium, Switzerland, Germany, Austria, Slovenia, Hungary, Slova-kia, Romania; eastern Europe and Russia: Lithuania, Ukraine, Poland, Fennoscandia, Russia; Ural; see Table 1 and Fig. 1), among populations within groups and within populations. The significance of these parameters were estimated by 10 000 permutations of the distance matrix.
Haplotype (h) and nucleotide (π in percentage) diversities
(Nei 1987) and their standard deviations (±SD; Tajima 1993)
were estimated using the dnasp version 4.0 program. The
difference between the two observed values of nucleotide diversity was compared statistically using a randomiza-tion test. The individuals were pooled and then randomly assigned to the two populations. The difference between these random values was stored and this procedure was repeated 1000 times. The observed differences were
com-pared with this random distribution: the P value (p) is
given by the proportion of random values greater than the observed one (using absolute values because the test is two-tailed).
An approximate timing of divergence between the bank vole phylogroups was calculated on the basis of the per-centage of genetic divergence. First, to assess that the
bank vole cyt b sequences evolve in a clock-like way,
relative-rate tests were performed with rrtree version 1.0
(Robinson et al. 1998), which improves the test of Wu &
Li (1985) by taking taxonomic sampling and phylogenetic relationships into account. The relative rate tests were
performed on the proportions of synonymous (Ks) and
nonsynonymous (Ka) substitutions of the Clethrionomys
phylogroups and samples. Second, a matrix of distances
between Clethrionomys sequences generated in paup
ver-sion 4.0b10 was used to calculate mean genetic divergences
(Pmean in percentage K3P) within and between phylogroups.
K3P distances were corrected for ancestral mtDNA
poly-morphism using the formula (Edwards 1997):
Pnet = PAB − 0.5 (PA + PB)
where Pnet is the net genetic distance between phylogroups,
PAB the mean genetic distance in pairwise comparisons of
individuals from A vs. B and PA and PB are mean genetic
distances among individuals within phylogroups. Finally, the separation time between C. rufocanus and the other
Clethrionomys estimated as 4.25 million years Ma (Matson &
Baker 2001) was used as a calibration point.
To compare the genetic findings with subfossil records, spatial and temporal information on the distribution of the bank vole during the Pleistocene was obtained from the database of the project, ‘Holocene History of the European Vertebrate Fauna’ (Benecke 1999).
Results
Pattern of sequence variation
A total of 104 haplotypes (including 80 previously unpublished) was identified among the 207 bank vole specimens. Of the 1011 base pairs sequenced, 268 sites were variable and 197 parsimony informative. The average transitions/transversion ratio (5.5) and base composition (T 28.1%, C 29.2%, A 29.2%, G 13.4%) are in agreement with other data on the cytochrome b gene of small mammals (Conroy & Cook 2000; Michaux et al. 2003; Cook et al. 2004).
Phylogenetic and phylogeographic analyses
NJ and ML analyses were performed using the K3P (K81)
model (Kimura 1981) suggested for the data by the Akaike information criterion (AIC) estimates and the hierarchical likelihood ratio tests (hLRT) in modeltest version 3.0 (Posada & Crandall 1998), with a gamma distribution shape parameter of α = 0.925 (Yang 1996) and a proportion
of invariable sites of I = 0.507. Because the K3P model was
not available in phyml, the TN93 model (close to the K3P
model in the three substitution types; Tamura & Nei 1993) was used for ML analysis. For comparison, the NJ and ML analyses were also conducted with few simpler substitution
models (JC; Jukes & Cantor 1969; K2P; Kimura 1980) as
modeltest does not always guarantee the best model and as more parameter-rich models do not always produce better trees (Brunhoff et al. 2003). The NJ reconstruction of
1732 V . D E F F O N T A I N E E T A L .
phylogenetic relationships between haplotypes is shown in Fig. 2, the MP (one most parsimonious tree, number of parsimony steps = 441, consistency index = 0.663, retention index = 0.869), ML and Bayesian trees showing identical
topologies. All other substitution models tested in the
distance and ML analyses (JC, K2P) provided the same tree
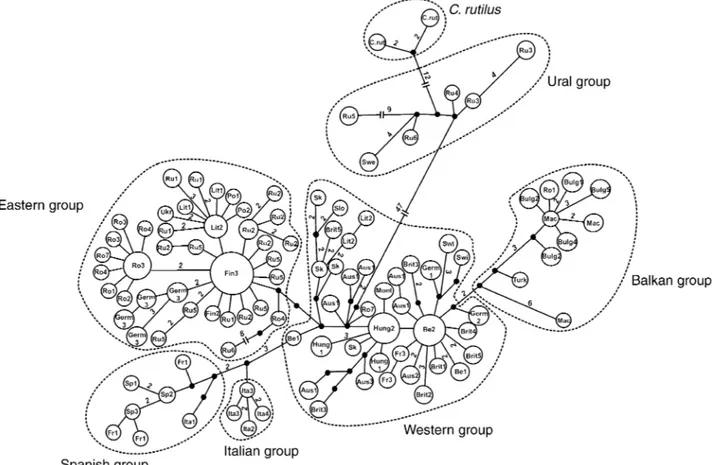
topologies and branch lengths. The bank voles split into two major groups: a Ural group including animals from northern Sweden, the Ural Mountains and the Russian region of Novosibirsk (BS: ≈ 88%, BPP: 0.89) and a large group including the other bank voles. Moreover, the Ural group was related to one of the outgroup species (the ruddy vole, BS: 100%, BPP: 1.00). The other bank vole haplotypes are separated into three peninsular and two continental phylogroups: the Spanish group made up of animals from Spain, southern France and one individual from western Italy (BS: ≈ 62%, BPP: < 0.3), the Italian group with animals exclusively from Italy (BS: ≈ 85%, BPP: 1.00), the Balkan group including animals from the Balkans, Turkey and one individual from southern Romania (BS: ≈ 63%, BPP: 1.00), the western group covering Britain, Belgium, central France, a part of Germany and Lithuania, Austria, Switzerland, Slovakia, Hungary, parts of Romania, and Montenegro (BS: ≈ 48%, BPP: 0.99), and finally, the eastern group, which ranges from Poland to Novosibirsk (BS: ≈ 56%, BPP: 0.96) (Figs 1 and 2). The median-joining tree also generated these five European bank vole phylogroups, although with less differentiation (Fig. 3). The eastern group shows star-like topology, suggesting exponential growth of populations from a small numbers of individuals. The Ural as well as ruddy vole haplotypes formed a group distinct from the main European phylogroups (distance = 47 mutations).
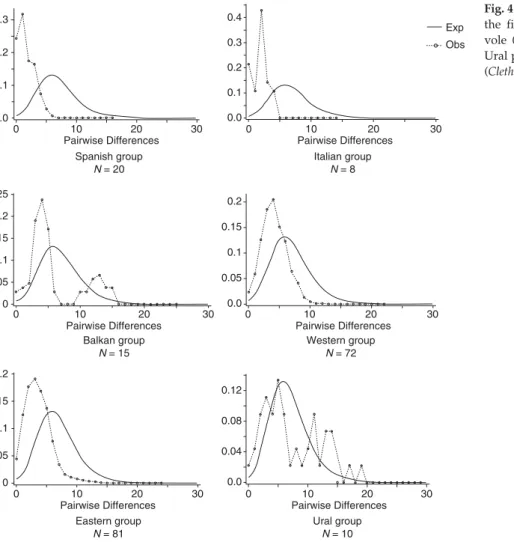
The mismatch distribution (Fig. 4) and the coalescence tests (Table 2) also suggested varied demographic histories for the bank vole phylogroups. The eastern and western groups both presented a bell-shaped distribution suggest-ing a sudden expansion of these populations. The coales-cence analyses confirmed the mismatch distributions as they rejected the null hypothesis of a stable population for these two continental groups (positive g values, P < 0.001 and P = 0.004 for the western and eastern phylogroups, respectively). On the other hand, the populations from the Balkan and Ural phylogroups showed a more heterogene-ous mismatch distribution suggesting long-term stability. No signature of population stability was clearly obtained Fig. 2Neighbour-joining tree of the 108 Clethrionomys mtDNA
haplo-types. Bootstrap values (%) obtained by the NJ, MP and ML analyses as well as Bayesian probabilities are shown in grey shading for the major phylogroups. See Table 1 for the haplotype designations.
Bank vole phylogroups Sample size Log likelihood χ2 P value Stable population model Exponential change model Spanish 20 −0.115 1.802 3.83 0.050 Italian 8 −0.001 0.053 0.11 0.741 Balkan 15 0.022 0.057 0.07 0.793 Western 72 0.053 16.700 29.29 < 0.001 Eastern 81 0.112 4.370 8.52 0.004 Ural 10 0.048 0.122 0.15 0.700
Table 2 Results of the coalescence analysis on the six phylogroups of bank vole (Clethrionomys glareolus)
P H Y L O G E O G R A P H Y O F T H E B A N K V O L E 1733
for the Spanish and Italian phylogroups. However, the coalescence test suggests that the Spanish group has undergone expansion (P = 0.05).
Population structure and genetic diversities
Population structure analyses reinforced the genetic pattern found with the different phylogenetic reconstructions. The amova showed that the majority of the total mtDNA variation (56.15%) was distributed among geographical groups whereas a low percentage (9.19%) was observed among populations within the groups (Table 3). Moreover, the ϕ statistic suggests a low level of gene flow between
populations (ϕST = 0.653, P < 0.001). In contrast, the genetic
divergence among phylogroups was low (max 1.15% K3P
genetic distance, excepted for the Ural group which shows
≈ 10% K3P distance from other phylogroups) (Table 4).
To assess whether population genetic diversity was high within the potential glacial refugia, the western and eastern phylogroups were divided into geographically delimited subgroups represented by a minimum of eight individuals (see Table 5). Nucleotide and haplotype diversities were calculated for each of these subgroups as well as for the Mediterranean phylogroups. Spanish and Italian phylo-groups display low nucleotide and haplotype diversity values (P < 0.05; Table 5). On the other hand, the central European subgroup of the western phylogroup displays significantly higher level of nucleotide diversity (π = Fig. 3 Median-joining tree of the bank vole (Clethrionomys glareolus) and ruddy vole (Clethrionomys rutilus) mtDNA haplotypes. Numbers of mutations (greater than one) between haplotypes are indicated on branches. See Table 1 for the haplotype designations.
Table 3 Analyses of molecular variance based on mtDNA data from geographical groups of bank vole (Clethrionomys glareolus)
Source of variation
Variance components
Percentage of
variation P value ϕ statistics
Among groups 1.659 56.15 < 0.001 ϕCT = 0.561
Among populations/groups 0.271 9.19 < 0.001 ϕSC = 0.209
1734 V . D E F F O N T A I N E E T A L .
0.74 ± 0.05%) than the other continental subgroups (P < 0.05).
Divergence time
The relative rate tests indicated that rates of evolution (both
Ks and Ka) for cytochrome b were not significantly
hetero-geneous between the different Clethrionomys phylogroups
and samples. Correcting for ancestral mtDNA
polymorph-ism, the mean K3P distance between C. rufocanus and
all the other Clethrionomys is 15.30 ± 0.87% K3P (95% CI:
14.66–15.94% K3P) (Table 4). Assuming a separation time
between the two species of 4.25 Ma, the molecular
clock rate was estimated at 3.6% K3P distance per My. This
estimate is similar to those observed in rodents of the genus
Apodemus (Apodemus sylvaticus and Apodemus flavicollis;
Fig. 4 Mismatch distribution analysis for the five major phylogroups of the bank vole (Clethrionomys glareolus) and for the Ural phylogroup linked to the ruddy vole (Clethrionomys rutilus).
Table 4 Genetic divergences within and between the main phylogroups of bank voles (Clethrionomys glareolus) and between bank vole, ruddy vole (Clethrionomys rutilus) and grey-sided vole (Clethrionomys rufocanus) (%K3P). Mean genetic distances (Pmean) are given below the diagonal, corrected genetic distances (Pnet) above the diagonal and intralineage genetic distances in bold
Spanish Italian Balkan Western Eastern Ural C. rutilus C. rufocanus
Spanish 0.21 0.62 0.93 1.15 1.12 10.36 10.49 14.27 Italian 0.81 0.18 0.96 1.05 0.94 10.62 10.69 14.78 Balkan 1.34 1.36 0.62 0.95 1.06 11.39 11.45 15.52 Western 1.66 1.45 1.66 0.81 0.66 10.62 10.71 15.49 Eastern 1.47 1.28 1.62 1.31 0.50 10.56 10.75 14.42 Ural 10.83 11.07 12.06 11.39 11.17 0.73 1.95 15.93 C. rutilus 10.79 10.98 11.96 11.31 11.20 2.51 0.40 16.69 C. rufocanus 15.72 16.22 17.18 17.24 16.02 17.64 18.23 2.70
P H Y L O G E O G R A P H Y O F T H E B A N K V O L E 1735
Michaux et al. 2003, 2004). Therefore, the separation time between the Ural phylogroup and the others is estimated to be 2.98 Ma (95% CI: 2.88–3.07 Ma) and that between the European phylogroups of bank vole to 0.27 Ma (95% CI: 0.25–0.30 Ma).
Discussion
A phylogeographic history associated with Pleistocene
glaciations
One of the greatest interests of phylogeography is associating a genetic pattern with major environmental changes. In this way, contraction and expansion of species’ ranges during Pleistocene glacial events has been shown to explain the intraspecific genetic pattern of many European species (Hewitt 1996, 1999). Our molecular clock analyses estimate that the major European phylogroups of bank voles differentiated during the late Pleistocene (0.30–0.25 Mya) and thus preceded the last glacial cycle (Williams et al. 1998). The fragmentation of forests during glaciations would have favoured differentiation in bank voles. As palaeontological data showed that bank voles were present in Europe since at least the middle Pleistocene (1.2 Ma) (Bauchau & Chaline 1987), the low level of genetic diver-gence among the main European phylogroups could be explained by extinction of ancestral lineages during one of the main middle or late Quaternary glaciations. Alternatively, we cannot exclude the possibility that ancestral bank vole populations have experienced an mtDNA selective sweep leading to the invasion of a positively selected mtDNA group (Maynard-Smith & Haigh 1974; Avise 2000). It might appear that selective effects have played a role in the history of bank vole lineages from the evidence of ruddy vole mtDNA capture by the Ural phylogroup. However,
such capture could also result from differences in the size of the two vole populations (Rhymer & Simberloff 1996). Distinguishing such historical extinction is beyond the scope of the present study. Whatever the process that caused the loss of ancient mtDNA polymorphism, this extinction must have been followed by recent intraspecific genetic differentiation that generated the shallow topology of our phylogenetic reconstructions (Fig. 2).
Endemism in the classical southern glacial refugia
The Mediterranean peninsulas (Iberia, Italy and the Balkans) are classically recognized as major glacial refugia in Europe for temperate species during the Ice Age (Taberletet al. 1998; Hewitt 1999). Our phylogeographic analyses
reveal mtDNA phylogroups of bank vole in these three regions (Figs 1 and 2). As fossil remains of bank voles have been reported from southern Europe (Spain and Italy) during the late glacial maximum (Fig. 1; Kowalski 2001), it seems likely that the Mediterranean peninsulas played a role as glacial refugia for this species.
One generally expects that populations of temperate species surviving in Mediterranean refugia during the Quaternary display high genetic variability (Hewitt 1999; Michaux et al. 2003). This is not observed for the Spanish and Italian phylogroups in comparison with that from the Balkans (Table 5). The low nucleotide and haplotype diversities characterizing the first two phylogroups could be associated with population fragmentation followed by severe population bottlenecks during the glaciations. Indeed, the topology of the phylogenetic reconstructions suggests that Spanish and Italian phylogroups appeared after a fragmentation of a larger Mediterranean population during the late Pleistocene. After that, gene flow between Spanish and Italian populations would have been reduced Table 5 Genetic variability observed within the main genetic phylogroups of bank vole (Clethrionomys glareolus)
Phylogroups and
their subgroups Sample size
Number of haplotypes Nucleotide diversity π (± SD percentage) Haplotype diversity (h, ± SD) Spanish 20 8 0.21 ± 0.05 0.758 ± 0.08 Italian 8 4 0.18 ± 0.04 0.786 ± 0.11 Balkan 15 12 0.6 ± 0.14 0.971 ± 0.03 Western phylogroup 72 45 0.50 ± 0.04 0.977 ± 0.01
Western subgroup 1 (central Europe) 38 25 0.74 ± 0.05 0.977 ± 0.01
Western subgroup 2 (France, Belgium, 27 19 0.42 ± 0.07 0.946 ± 0.03
Britain, Germany, Lithuania)
Eastern 81 44 0.45 ± 0.04 0.956 ± 0.02
Eastern subgroup 1 (Germany, 18 10 0.5 ± 0.07 0.915 ± 0.04
Poland, Lithuania, Ukraine)
Eastern subgroup 2 (Romania) 20 13 0.26 ± 0.05 0.911 ± 0.05
Eastern subgroup 3 (Novgorod, Samara) 25 16 0.37 ± 0.04 0.947 ± 0.03
Eastern subgroup 4 (Omsk, Novosibirsk) 14 10 0.35 ± 0.11 0.945 ± 0.05
1736 V . D E F F O N T A I N E E T A L .
by the presence of geographical barriers (the Pyrenees and the Alps), leading to an allopatric differentiation during the last glacial periods. The crash in Spanish and Italian bank vole populations could be also related to arid and cold climatic events during the late Quaternary in these regions (Petit et al. 2003), as well as to recent anthropologic disturbances (evolution from forest to agricultural land-scapes, increasing desertification, etc.) (Groves & Di Castri 1991; Gitay et al. 2002). In contrast, stable and more diver-sified bank vole populations persisted in the Balkans, thanks to the presence of a varied topography and humid conditions that created long-term suitable habitats for many temperate species (Tzedakis et al. 2002). The bank vole sampled from western Turkey was genetically very similar to those from the Balkans suggesting recent contact between these populations during the last glaciation when the Marmara Sea was dry land (Aksu et al. 1999).
Beyond the Mediterranean peninsulas: central European
glacial refugia
The high endemism of the Mediterranean bank vole phylogroups strongly suggests that they did not contribute to the postglacial recolonization of central and northern Europe, in agreement with the conclusions of Bilton et al. (1998). The major part of this region was rather recolonized by bank vole phylogroups surviving the last glaciations in other glacial refugia. Indeed, the two other phylogroups (Western and Eastern) were subjected to a recent popu-lation expansion (Fig. 3, Table 2) and presently cover most of the bank vole distribution range (Fig. 1). As predicted by the expansion/contraction model (Nichols & Hewitt 1994; Ibrahim et al. 1996), the analysis of nucleotide diversity (Table 5) suggests that the central European regions (Austria, Hungary, Slovakia and Romania) acted as glacial refugia for the western bank vole group. Indeed, these populations are characterized by a genetic diversity that is significantly higher (P < 0.05) than the other western and eastern subgroups. However, as a large ice cap covered Austria during the Last Glacial Maximum (LGM), glacial refugia were most likely located in the river systems present near the Alps or in the Carpathian mountains and the Hungarian plain. Indeed, (i) bone remains of bank vole dated to the coldest epoch of the LGM (21 000–18 000 years bp) were found in the northern Polish Carpathians and in northern Moldova (Fig. 1) (Nadachowski et al. 2003); (ii) during the LGM, the southern slope of the Carpathians but also Hungary were covered with patches of mixed coniferous and deciduous forests instead of a uniform steppe-tundra landscape (Berger 1992; Willis et al. 2000; K. Neumann, personal communication). The western phylo-group also spreads into the western Balkan region (Montenegro), but this population seems to display low genetic diversity (one haplotype is shared by three
individuals). More samples from this region as well as the Carpathians and the Hungarian plain are essential to confirm the hypothesis of a central European glacial refugium for the western phylogroup.
Genetic diversity values in the eastern phylogroup do not provide evidence for a particular region as a glacial ref-ugium (Table 5). Nevertheless, a recent genetic study on the Puumala viruses of Russian bank voles (Dekonenko
et al. 2003) hypothesized a European glacial refugium in
areas thought to have been forested during the LGM, in the regions of eastern Romania, western Azov Sea and the Crimea (Zagwijn 1992; Blondel 1995; Jaarola & Searle 2002). However, it seems unlikely that the eastern phylo-group of bank vole survived glacial cycles in central Europe unless it experienced a drastic reduction in the effective population size, as suggested by its low level of nucleotide diversity value (π = 0.26 ± 0.05%) within this region. Therefore, glacial refugia for this phylogroup should be sought in more eastern regions.
Up to now, central European glacial refugia were pro-posed for mammals adapted to open habitat such as the root vole (Brunhoff et al. 2003) and the field vole (Jaarola & Searle 2002) (see Introduction). The present genetic study, as well as fossil remains, indicates that a temperate forest species such as the bank vole was also able to survive in central European regions during glacial periods. This could be explained by its resistance to cold environments, a fact supported by past and present ecological observa-tions: (i) the succession of small mammal fossils in Belgium shows that the bank vole was the most abundant forest rodent during the last cold stadials of the late glacial Dryas I, II, III (Cordy 1991); (ii) the current range distribu-tion of the bank vole includes coniferous forests and cold environments (e.g. Fennoscandia; Reichhoff 1984), where populations have developed survival strategies such as tracking rocky microhabitats during winter (Karlsson 1987). Compared to other forest rodents (Apodemus sylvaticus,
Apodemus flavicollis; Michaux et al. 2003, 2004), the bank
voles would not have followed the dwindling forest cover during the glacial advances. Therefore, bank vole popula-tions would have survived the Quaternary glaciapopula-tions in cryptic ‘northern’ forests. This led to the present complex phylogeographic pattern including multiple glacial refugia situated in central Europe, in the Mediterranean peninsulas and maybe in more eastern regions. Moreover, the presence of the bank vole in more northern glacial refugia would explain the fact that this species was one of the earliest mammals to colonize northern regions at the end of the last glaciation (Tegelström 1987; Jaarola et al. 1999).
The Ural phylogroup
Our study clearly demonstrates the existence of a third continental bank vole mtDNA lineage that ranges from
P H Y L O G E O G R A P H Y O F T H E B A N K V O L E 1737 northern Sweden to central Siberia, centred on the Ural
mountains. This phylogroup is clearly related to haplotypes of ruddy vole and is characterized by very different demo-graphic history, genetic diversity and genetic divergence as compared to the other bank vole phylogroups (Figs 2, 3 and 4; Tables 3, 4 and 5). It also appears that the separation time between the Ural phylogroup and the other European phylogroups dates back to the mid-Pliocene (2.98 Mya). Tegelström (1987) explained the existence of this particular phylogroup as the introgression of ruddy vole mtDNA into bank vole, about 30 000–60 000 years bp, during their post-glacial recolonization of Scandinavia. This phylogeographic group of Ural bank voles should be explored further by a wider geographic sampling with complementary analyses using nuclear markers and a comparison with the phylogeographic patterns of the ruddy vole. Moreover, a comparative phylogeographic study between the two vole species and the Puumala hantavirus, currently underway, will probably give useful information concerning the evolutionary history of these different vole phylogroups.
Conclusion
Phylogeographic advances tend towards an increasing complexity and a multiplication of models explaining the impact of climatic changes on the genetic diversity of species. This study suggests the existence of multiple continental refugia for a forest rodent and the adaptability of a species that, facing climate changes, survives by tracking in situ relict habitats. This does not exclude the importance of Mediterranean regions as hotspots of genetic biodiversity and, in the case of the bank vole, as a source of endemic lineages. However, attention should be paid in the future to more northern and eastern regions with mountain ranges or valley systems as potential refugia for European forest species. As for the Mediterranean regions, the conservation of their high levels of genetic diversity should become a priority for biodiversity management programs.
Acknowledgements
We thank Prof J. Chaline, Prof A. Nadachowski, M.C. Fontaine, S. Zimmerman, Dr J. Britton-Davidian, Prof H. Henttonen, S. Piry and Dr S. Baird for their help or comments on the manuscript. We thank all persons who provided tissue samples of bank voles: F. Catzeflis, L. Choleva, P. De Mendoça, C. Feliu, M.G. Filippucci, J. Goüy de Bellocq, H. Henttonen, G. Horvath, X. Lambin, E. Magnanou, D. Peshev, M.G. Ramalhinho, R. Rosoux, J. Uhlíková, V. Vohralík. We thank Dr J. Niemimaa and L. Popa for their help during the collecting trip in Romania. This work was funded by the French Institute of Biodiversity (IFB). V. Deffontaine is sup-ported by a Belgian research fellowship from the FRIA (Fonds pour la Formation et la Recherche dans l’Industrie et dans l’Agri-culture) and J.R. Michaux from the FNRS (Fonds National pour la
Recherche Scientifique). The UK postdoctoral fellowship of P. Kotlík was awarded by the Royal Society and sponsored by NATO. His work at LibEchov is funded by the Czech Science Foundation (grant mo. 2061051 PO32) and by the Academy of Sciences of the Czech Republic (grant mo. AVOZ 50450515).
References
Aksu AE, Hiscott RN, Yasar D (1999) Oscillating Quaternary water levels of the Marmara Sea and vigorous outflow into the Aegean Sea from the Marmara Sea–Black Sea drainage corridor. Marine Geology, 153, 275–302.
Avise JC (2000) Phylogeography: The History and Formation of Species. Harvard University Press, Cambridge.
Bandelt H-J, Forster P, Röhl A (1999) Median-joining networks for inferring intraspecific phylogenies. Molecular Biology and Evolu-tion, 16, 37–48.
Bashenina NV (1981) Bank Vole. Nauka Publishers, Moscow. Bauchau V, Chaline J (1987) Variabilité de la troisième molaire
inférieure de Clethrionomys glareolus (Arvicolidae, Rodentia) et sa signification évolutive. Mammalia, 51, 587–598.
Benecke N (1999) The project, ‘The Holocene history of the Euro-pean vertebrate fauna’. Archäologie in Eurasien, 6, 151–161. Berger A (1992) Le climat de la Terre. Un Passé Pour Quel Avenir? De
Boeck-Wesmael, Bruxelles.
Bilton DT, Mirol PM, Mascheretti S et al. (1998) Mediterranean Europe as an area of endemism for small mammals rather than a source for northwards postglacial colonization. Proceedings of the Royal Society of London. Series B, Biological Sciences, 265, 1219–1226. Blondel J (1995) Biogéographie: Approche Écologique et Évolutive.
Editions Masson, Paris.
Brunhoff C, Galbreath KE, Fedorov VB, Cook JA, Jaarola M (2003) Holarctic phylogeography of the root vole (Microtus oeconomus): implications for late Quaternary biogeography of high latitudes. Molecular Ecology, 12, 957–968.
Conroy CJ, Cook JA (1999) MtDNA evidence for repeated pulses of speciation within arvicoline and murid rodents. Journal of Mammalian Evolution, 6, 221–245.
Conroy CJ, Cook JA (2000) Phylogeography of a postglacial colonizer: Microtus longicaudus (Rodentia: Muridae). Molecular Ecology, 9, 165–175.
Cook JA, Runck AM, Conroy CJ (2004) Historical biogeography at the crossroads of the northern continents: molecular phylo-genetics of red-backed voles (Rodentia: Arvicolinae). Molecular Phylogenetics and Evolution, 30, 767–777.
Corbet GB (1978) Mammals of the Palaearctic Region: A Taxonomic Review. British Museum (Natural History), London.
Cordy JM (1991) Palaeoecology of the late Glacial and early post-glacial of Belgium and neighbouring areas. In: The Late Glacial in Northwest Europe: Human Adaptation and Environmental Change at the End of the Pleistocene (eds Barton N, Roberts AJ, Roe DA), pp. 40–47. Council for British Archaeology, London.
Dekonenko A, Yakimenko V, Ivanov A et al. (2003) Genetic simi-larity of puumala viruses found in Finland and western Siberia and of the mitochondrial DNA of their rodent hosts suggests a common evolutionary origin. Infection, Genetics and Evolution, 3, 245–247.
Edwards SV (1997) Relevance of microevolutionary processes to higher level molecular systematics. In: Avian Molecular Evolution and Systematics (ed. Mindel PP), pp. 251–278. Academic Press, New York.
1738 V . D E F F O N T A I N E E T A L .
Emerson BC, Paradis E, Thébaud C (2001) Revealing the demo-graphic histories of species using DNA sequences. Trends in Ecology & Evolution, 16, 707–716.
Fedorov VB, Stenseth NC (2001) Glacial survival of the Norwegian lemming (Lemmus lemmus) in Scandinavia: inference from mitochondrial DNA variation. Proceedings of the Royal Society of London. Series B, Biological Sciences, 268, 809–814.
Felsenstein J (1981) Evolutionary tree from DNA sequences: a maximum-likelihood approach. Journal of Molecular Evolution, 17, 368–376.
Felsenstein J (1985) Confidence limits on phylogenies: an approach using the bootstrap. Evolution, 39, 783–791.
Fitch WM (1971) Towards defining the course of evolution: mini-mum change for a specific tree topology. Systematic Zoology, 20, 406–416.
Fons R, Libois R, Saint Girons MC (1980) Les micromammifères dans le département des Pyrénées-Orientales. Essai de répar-tition altitudinale en liaison avec les étages de végétation. Vie and Milieu, 30, 285–299.
Gitay H, Suárez A, Watson RT, Dokken DJ, eds. (2002) Climatic Change and Biodiversity. IPCC, Geneva.
Groves RH, Di Castri F (1991) Biogeography of Mediterranean Inva-sions. Cambridge University Press, Cambridge.
Guindon S, Gascuel O (2003) A simple, fast, and accurate algo-rithm to estimate large phylogenies by maximum likelihood. Systematic Biology, 52, 696–704.
Hewitt GM (1996) Some genetic consequences of ice ages, and their role in divergence and speciation. Biological Journal of the Linnean Society, 58, 247–276.
Hewitt GM (1999) Postglacial recolonization of European biota. Biological Journal of the Linnean Society, 68, 87–112.
Hewitt GM (2001) Speciation, hybrid zones and phylogeography — or seeing genes in space and time. Molecular Ecology, 10, 537– 549.
Huelsenbeck JP, Ronquist F, Nielsen R, Bollback JP (2001) Bayesian inference of phylogeny and its impact on evolutionary biology. Science, 294, 2310–2314.
Ibrahim KM, Nichols RA, Hewitt GM (1996) Spatial patterns of genetic variation generated by different forms of dispersal during range expansion. Heredity, 77, 282–291.
Iwasa MA, Kartavstseva IV, Dobrotvorsky AK, Panov VV, Suzuki H (2002) Local differentiation of Clethrionomys rutilus in north-eastern Asia inferred from mitochondrial gene sequences. Mammalian Biology, 67, 157–166.
Jaarola M, Searle JB (2002) Phylogeography of field voles (Microtus agrestis) in Eurasia inferred from mitochondrial DNA sequences. Molecular Ecology, 11, 2613–2621.
Jaarola M, Tegelström H, Fredga K (1999) Colonization history in Fennoscandian rodents. Biological Journal of the Linnean Society, 68, 113–127.
Jukes TH, Cantor CR (1969) Evolution of protein molecules. In: Mammalian Protein Metabolism (ed. Munro HN), pp. 21–132. Academic Press, New York.
Karlsson AF (1987) Over-winter survival in a boreal population of the bank vole, Clethrionomys glareolus. Canadian Journal of Zoology, 66, 1835–1840.
Kimura M (1980) A simple method for estimating evolutionary rate of base substitution through comparative studies of nucle-otide sequences. Journal of Molecular Evolution, 16, 111–120. Kimura M (1981) Estimation of evolutionary distances between
homologous nucleotide sequences. Proceedings of the National Academy of Sciences of the United States of America, 78, 454–458.
Kowalski K (2001) Pleistocene rodents of Europe. Folia Quater-naria, 72, 1–389.
Kuhner MK (1998) Maximum likelihood estimation of population growth rates based on the coalescent. Genetics, 149, 429–434. Kuhner MK, Yamato J, Felsenstein J (1995) Estimating effective
population size and mutation rate from sequence data using Metropolis-Hastings sampling. Genetics, 140, 1421–1430. Martin Y, Gerlach G, Schlotterer C, Meyer A (2000) Molecular
phylogeny of European muroid rodents based on cytochrome b sequences. Molecular Phylogenetics and Evolution, 16, 37–47. Matson CW, Baker RJ (2001) DNA sequence variation in the
mito-chondrial control region of red-backed voles (Clethrionomys). Molecular Biology and Evolution, 18, 1494–1501.
Maynard-Smith J, Haigh J (1974) The hitch-hiking effect of a favourable gene. Genetical Research, 23, 23–35.
Michaux JR, Libois R, Paradis E, Filippucci MG (2004) Phylogeo-graphic history of the yellow-necked fieldmouse (Apodemus flavicollis) in Europe and in the Near and Middle East. Molecular Phylogenetics and Evolution, 32, 788–798.
Michaux JR, Magnanou E, Paradis E, Nieberding C, Libois R (2003) Mitochondrial phylogeography of the wood mouse (Apodemus sylvaticus) in the western Palaearctic region. Molecular Ecology, 12, 685–697.
Nadachowski A, Miêkina B, Garapich A (2003) Rodents (Rodentia). In: Oblasowa Cave. Human Activity, Stratigraphy and Palaeoenviron-ment (eds Valde-Nowak P, Nadachowski A, Madeyska T), p. 176. Institute of Archacology and Ethnology, Polish Academy of Sciences, Krakow.
Nei M (1987) Molecular Evolutionary Genetics. Columbia University Press, New York.
Nichols RA, Hewitt GM (1994) The genetic consequences of long distance dispersal during colonisation. Heredity, 72, 312–317. Petit RJ, Aguinagalde I, de Beaulieu JL et al. (2003) Glacial refugia:
hotspots but not melting pots of genetic diversity. Science, 300, 1563–1565.
Philippe H (1993) must: a computer package of management utilities for sequences and trees. Nucleic Acids Research, 21, 5264–5272.
Posada D, Crandall KA (1998) modeltest: testing the model of DNA substitution. Bioinformatics, 14, 817–818.
Reichhof J (1984) Les Mammifères. Editions Solar, Paris.
Rhymer JM, Simberloff D (1996) Extinction by hybridisation and introgression. Annual Review of Ecology and Systematics, 27, 83– 109.
Robinson M, Gouy M, Gautier C, Mouchiroud D (1998) Sensitivity of the relative-rate test to taxonomic sampling. Molecular Biology and Evolution, 15, 1091–1098.
Rogers AR, Harpending H (1992) Population growth makes waves in the distribution of pairwise genetic difference. Molecular Biology and Evolution, 9, 552–569.
Rozas J, Sánchez-DelBarrio JC, Messeguer X, Rozas R (2003) dnaSP, DNA polymorphism analyses by the coalescent and other methods. Bioinformatics, 19, 2496–2497.
Saitou N, Nei M (1987) The neighbor-joining method: a new method for reconstructing phylogenetic trees. Molecular Biology and Evolution, 4, 406–425.
Sambrook J, Fritsch EF, Maniatis T (1989) Molecular Cloning: A Lab-oratory Manual. Cold Spring Harbor LabLab-oratory Press, New York. Schneider S, Roessli D, Excoffier L (2000) ARLEQUIN Version 2.0: a software for population genetics data analysis. Genetics and Biometry Laboratory, Department of Anthropology University of Geneva, Switzerland.
P H Y L O G E O G R A P H Y O F T H E B A N K V O L E 1739 Slatkin M, Hudson RR (1991) Pairwise comparisons of
mitochon-drial DNA sequences in stable and exponentially growing populations. Genetics, 129, 555–562.
Sommer R, Benecke N (2004) The recolonisation of Europe by brown bears Ursus arctos Linnaeus, 1758 after the Last Glacial Maximum. Mammal Review, 34, in press.
Spitzenberger F (1999) Clethrionomys glareolus. In: The Atlas of European Mammals (eds Mitchell-Jones AJ, Amori G, Bogdanowicz W et al.), pp. 212–213. Academic Press, London.
Stewart JR, Lister AM (2001) Cryptic northern refugia and the origins of the modern biota. Trends in Ecology & Evolution, 16, 608–613.
Swofford DL (2000) PAUP*: Phylogenetic Analysis Using Parsimony
(*and Other Methods). version 4.0. Sinauer Associates, Sunderland, Massachusetts.
Taberlet P, Bouvet J (1994) Mitochondrial DNA polymorphism, phylogeography, and conservation genetics of the brown bear Ursus arctos in Europe. Proceedings of the Royal Society of London. Series B, Biological Sciences, 255, 195–200.
Taberlet P, Fumagalli L, Wust-Saucy AG, Cosson JF (1998) Com-parative phylogeography and postglacial colonization routes in Europe. Molecular Ecology, 7, 453–464.
Tajima F (1993) Measurement of DNA polymorphism. In: Mechanisms of Molecular Evolution (ed. Takahata N, Clark AG), pp. 37–59. Sinauer Associates, Sunderland, Massachusetts. Tamura K, Nei M (1993) Estimation of the number of nucleotide
substitutions in the control region of mitochondrial DNA in humans and chimpanzees. Molecular Biology and Evolution, 10, 512–526.
Tegelström H (1987) Transfer of mitochondrial DNA from the northern red-backed vole (Clethrionomys rutilus) to the bank vole (Clethrionomys glareolus). Journal of Molecular Evolution, 24, 218–227.
Tegelström H, Wyöni P-I, Gelter H, Jaarola M (1988) Concordant divergence in proteins and mitochondrial DNA between two vole species in the genus, Clethrionomys. Biochemical Genetics, 26, 223–237.
Tollefsrud MM, Bachman K, Jakobsen KS, Brockmann C (1998) Glacial survival does not matter-II: RAPD phylogeography of Nordic Saxifraga cespitosa. Molecular Ecology, 7, 1217–1232. Tzedakis PC, Lawson IT, Frogley MR, Hewitt GM, Preece RC
(2002) Buffered tree population changes in a Quaternary refugium: evolutionary implications. Science, 297, 2044–2047.
Van Rompaey J (1989) Variation and differentiation of mitochondrial DNA in Clethrionomys glareolus Schreber, 1780, Apodemus sylvaticus Linnaeus, 1758, and Apodemus flavicollis Melchior, 1834 (Mammalia: Rodentia) in western Europe. PhD Thesis, University of Anvers.
Webb T III, Bartlein PJ (1992) Global changes during the last 3 million years: climatic controls and biotic responses. Annual Reviews of Ecology and Systematic, 23, 141–173.
Wickliffe JK, Chesser RK, Rodgers BE, Baker RJ (2002) Assessing the genotoxicity of chronic environmental irradiation by using mitochondrial DNA heteroplasmy in the bank vole (Clethriono-mys glareolus) at Chornobyl, Ukraine. Environmental Toxicology and Chemistry, 21, 1249–1254.
Williams M, Dunkerley D, De Deckker P, Kershaw P, Chappel J (1998) Quaternary Environments. Oxford University Press, New York.
Willis KJ, Rudner E, Sümegi P (2000) The full-glacial forests of cen-tral and southeastern Europe. Quaternary Research, 53, 203–213. Wu C-I, Li WH (1985) Evidence for higher rates of nucleotide substitutions in rodents than in man. Proceedings of the National Academy of Sciences of the United States of America, 82, 1741–1745. Yang Z (1996) Among-site rate variation and its impact on
phylo-genetic analyses. Trends in Ecology & Evolution, 11, 367–371. Yang Z, Rannala B (1997) Bayesian phylogenetic inference using
DNA sequences: a Markov chain Monte Carlo method. Molecu-lar Biology and Evolution, 14, 717–724.
Zagwijn WH (1992) Migration of vegetation during the Quater-nary in Europe. Courier Forschungsinstitut Senckenberg, 153, 9– 20.
This work forms part of a PhD thesis performed by Valérie Deffontaine on the phylogeography of the bank vole under the direction of Dr Johan R. Michaux and Prof Roland Libois. This research is also a part of a larger study on the phylogeography of European forest mammal species developed by Drs J.R. Michaux and R. Libois. Research interests of Dr Petr Kotlík include the location and relative importance of glacial refugia in the western Palaearctic. In collaboration with V. Deffontaine and J.R. Michaux, he has begun to study the phylogeography of the bank vole while a postdoctoral fellow in the group of Jeremy B. Searle at the University of York.