HAL Id: hal-01059051
https://hal.archives-ouvertes.fr/hal-01059051
Submitted on 29 Aug 2014
HAL is a multi-disciplinary open access
archive for the deposit and dissemination of sci-entific research documents, whether they are pub-lished or not. The documents may come from teaching and research institutions in France or abroad, or from public or private research centers.
L’archive ouverte pluridisciplinaire HAL, est destinée au dépôt et à la diffusion de documents scientifiques de niveau recherche, publiés ou non, émanant des établissements d’enseignement et de recherche français ou étrangers, des laboratoires publics ou privés.
discrimination of forest landscape types in French
Guiana
I. Fayad, N. Baghdadi, V. Gond, Jean-Stéphane Bailly, N. Barbier,
Mohammad El Hajj, F. Fabre
To cite this version:
I. Fayad, N. Baghdadi, V. Gond, Jean-Stéphane Bailly, N. Barbier, et al.. Coupling potential of ICESat/GLAS and SRTM for the discrimination of forest landscape types in French Guiana. Inter-national Journal of Applied Earth Observation and Geoinformation, Elsevier, 2014, 33 (1), p. 21 - p. 31. �10.1016/j.jag.2014.04.005�. �hal-01059051�
Coupling potential of ICESat/GLAS and SRTM for the
discrimination of forest landscape types in French Guiana
I. Fayad 1,*, N. Baghdadi 1, V. Gond 2, J.S. Bailly 3, N. Barbier 4, M. El Hajj 5 and F. Fabre 6
1
IRSTEA, UMR TETIS, 500 rue François Breton, 34093 Montpellier cedex 5, France *Email: Ibrahim.fayad@teledetection.fr
² CIRAD, UPR B&SEF, 34398 Montpellier, France 3
AgroParisTech, UMR LISAH-TETIS, 34090 Montpellier, France 4
IRD, UMP AMAP, 34000 Montpellier, France 5
NOVELTIS, 31670 Labège, France 6
EADS – Astrium, 31402 Toulouse, France
Abstract
The Shuttle Radar Topography Mission (SRTM) has produced the most accurate nearly global elevation dataset to date. Over vegetated areas, the measured SRTM elevations are the result of a complex interaction between radar waves and tree crowns. In this study, waveforms acquired by the Geoscience Laser Altimeter System (GLAS) were combined with SRTM elevations to discriminate the five forest landscape types (LTs) in French Guiana. Two differences were calculated: (1) penetration depth, defined as the GLAS highest elevations minus the SRTM elevations, and (2) the GLAS centroid elevations minus the SRTM elevations. The results show that these differences were similar for the five LTs, and they increased as a function of the GLAS canopy height and of the SRTM roughness index. Next, a Random Forest (RF) classifier was used to analyze the coupling potential of GLAS and SRTM in the discrimination of forest landscape types in French Guiana. The parameters used
difference between the GLAS highest elevations and the SRTM elevations and the difference between the GLAS centroid elevations and the SRTM elevations. Discrimination of the five forest landscape types in French Guiana was possible, with an overall classification accuracy of 81.3% and a kappa coefficient of 0.75. All forest LTs were well classified with an accuracy varying from 78.4% to 97.5%.
Finally, differences of near coincident GLAS waveforms, one from the wet season and one from the dry season, were analyzed. The results showed that the open forest LT (LT12), in some locations, contains trees that lose leaves during the dry season. These trees allow LT12 to be easily discriminated from the other LTs that retain their leaves using the following three criteria: (1) difference between the GLAS centroid elevations and the SRTM elevations, (2) ratio of top energy in the wet season to top energy in the dry season, or (3) ratio of ground energy in the wet season to ground energy in the dry season.
Keywords: SRTM DEM; ICESat/GLAS; Tropical forest; French Guiana
1. Introduction
The assessment of forest landscape types and the monitoring of their dynamics are essential requirements for the sustainable management of forest resources, and the relevance of remote sensing in the creation of forest landscape databases is very apparent (e.g., Gond et al., 2011; Bartholomé et al., 2004; Mayaux et al., 2004). Forest landscape classification also plays a major role in the methods for estimating forest aboveground biomass (AGB), which has become a serious challenge in the past few decades for scientists studying the global conservation of carbon sinks. Indeed, many studies have found that AGB estimation models are more relevant when including forest types (Zheng et al., 2004; Chave et al., 2005; Ni-Meister et al., 2010; Mitchard et al., 2012; Addo-Fordjour and Rahmad, 2013). Zheng et al. (2004) found that the coupling of tree metrics acquired from field measurements and various
indices derived from Landsat 7 ETM± substantially improved AGB estimates when separating hardwood from pine forests. Chave et al. (2005) tested several models for AGB estimation in old growth, dry, moist, wet, montane and mangrove forests. Their results indicated that one of the most important factors for AGB estimation is forest type. The results also indicated that the best predictive models were forest-type dependent. Ni-Meister et al. (2010) developed an AGB estimation model that uses a fusion of LiDAR and optical sensors (to provide the vegetation type) in conifer/softwood and deciduous/hardwood forests. Their results indicated that vegetation-type-dependent models provide better AGB estimates in comparison to vegetation-type-independent models. Mitchard et al. (2012) found a ±25% uncertainty in the estimation of AGB in Lope National Park (Gabon) using LiDAR data and a vegetation structures map extracted from radar images. Finally, Addo-Fordjour and Rahmad (2013) developed AGB estimation models for different species of lianas. Their results indicated that forest type has a significant influence on the allometric relationships used in AGB estimation, which led to forest-type-specific equations.
Currently, land and forest cover classifications over large areas are made using high temporal frequency data provided by moderate spatial resolution sensors with a spatial resolution ranging from a few hundred meters (MODIS) to one kilometer (VEGETATION/SPOT). Nevertheless, the characterization and quantification of broad-scale forest land cover remains a major challenge for remote sensing scientists (Harding et al., 2001). Mayaux et al. (2004) produced a land-cover map of Africa using the spectral response and the temporal profile of the vegetation cover. In their study, radar data and thermal sensors were also used for specific land-cover classes. In the Guiana Shield, Gond et al. (2011) interpreted 33 remotely sensed landscape types (LTs) using VEGETATION/SPOT. Five of the 33 classes occupied 78% of the forests in the area. The method used by Gond et al. (2011) used a multivariate analysis of remote sensing data, field observations and environmental data. However, due to LiDAR’s
ability to provide detailed information on the vertical structure of forests (canopy height, tree crown, etc.) in comparison to optical sensors, LiDAR appears to be one of the most applicable remote sensing techniques for forest monitoring (Dubayah and Drake, 2000; Hudak et al., 2008; Duong et al. 2009). Conversely, optical sensors provide extensive coverage of forests on the horizontal plane but are less sensitive to forest vertical structure variations (Ali et al., 2008). Generally, to better classify forest structures, canopy information on both the horizontal and vertical planes are required. In fact, studies that use LiDAR datasets in conjunction with optical data show better classification accuracy of forest structures (Mundt et al., 2006; Dalponte et al., 2008; Ali et al., 2008). Indeed, in Mundt et al. (2006), the fusion of LiDAR and multispectral data provided an increase in the detection of sagebrush by 15% in comparison to using multispectral data alone. Dalponte et al. (2008) used a fusion of LiDAR and hyperspectral data to classify complex forest areas with more than 20 tree species, with several similar tree species and with no preordered spatial distribution of trees. In their study, an increase of up to 9% in the classification accuracy was noted when adding LiDAR data. Finally, Ali et al. (2008) fused LiDAR and multispectral data for the classification of three Eucalyptus types. Their results indicated an increase of 23% in the classification accuracy when using LiDAR data.
Our study uses the interaction between the Shuttle Radar Topography Mission (SRTM) data and vegetation in the five forest landscape types in French Guiana to assess the potential of the SRTM to identify these five forest types. This was accomplished by comparing SRTM
elevations with elevations extracted from NASA’s Geoscience Laser Altimeter System
(GLAS) full waveform data, namely, the highest (most likely canopy top) and centroid (distance-weighted average) elevations.
Comparisons between the GLAS and SRTM elevations have been investigated in numerous studies, mainly for studying the SRTM penetration levels over different landscape types and
using different elevation levels within the GLAS waveforms (highest, centroid and lowest) (e.g., Bhang et al., 2007; Rodriguez et al., 2006; Hofton et al., 2006; Becek, 2008; and Carabajal and Harding, 2008). Calculating the bias (the difference between the SRTM elevations and the GLAS centroid elevations), Bhang et al. (2007) found that elevation bias is dependent on the landscape type and the terrain relief. Bias increased from -1.5 m for bare terrain to -1 m for agricultural areas and 0.9 m for forested areas. Rodriguez et al. (2006) compared the SRTM elevations with field measurements in different regions around the globe and found an elevation bias between the SRTM and field measurements that varied with each location. In their study, they compared the difference between the SRTM and the Land, Vegetation, and Ice Sensor (LVIS) canopy top elevations across five different regions in the USA (Maine, Maryland, Massachusetts, New Hampshire, and Costa Rica) and found a maximum elevation bias difference of 54% between two regions (Costa Rica and Maryland). Becek (2008) found a linear relationship between the magnitude of the elevation bias of the SRTM in comparison to reference field data and the percentage of tree cover. The bias increased from 4.8 m for 0% tree cover to 11 m for 100% tree cover. Carabajal and Harding (2006) compared the highest, centroid and lowest GLAS elevations with the SRTM for different regions around the world (Amazon, Africa, Asia, Australia, and Western USA) and found different elevation biases (difference between GLAS highest and SRTM) that varied with region (a maximum difference of 16.6 m was found between Australia and Western USA).
In addition, bias appeared to be correlated with the GLAS waveform extent and the roughness index (bias increases with increasing waveform extent and roughness index). The GLAS waveform extent represents the distance between the laser signal start and the signal end. In vegetated areas, laser signal start corresponds to the highest canopy surface large enough to yield a return signal. Signal end corresponds to the lowest detected ground elevation. In
vegetated areas, roughness represents the combined effect of topographic relief (top of canopy) and the interaction of the C-band microwaves with the vegetation (Carabajal and Harding, 2006).
Seasonal changes in the GLAS signal over different forest types have also been studied. Duong et al. (2009) used the differences between overlapping pairs of GLAS footprints in different seasons (winter and summer) to differentiate between different forest structures. Their study showed promising results for identifying conifer, deciduous and mixed conifer/deciduous forests.
The objective of this study was to analyze the potential for forest landscape type mapping using the coupling of GLAS and SRTM data in French Guiana. First, the penetration depth of the SRTM radar wave corresponding to the difference between the GLAS highest elevations and the SRTM elevations, as well as the difference between the GLAS centroid elevations and the SRTM elevations, was analyzed over the different forest landscape types obtained in the study of Gond et al. (2011). Next, the behavior of these two variables was studied for the different LTs as a function of the GLAS canopy height and the SRTM roughness index. The classification potential for the five forest landscape types (LTs) using the coupling of GLAS and SRTM was assessed using the Random Forest algorithm. This classification was conducted using the penetration depth, the difference between the GLAS centroid elevations and the SRTM elevations, the GLAS canopy height and the SRTM roughness index. Finally, using the changes in the GLAS signal in different seasons, the potential for LT discrimination using these changes was studied. A description of the dataset is presented in section II, followed by the processing of the GLAS waveforms and the methodology used to assess the potential of GLAS and SRTM in the discrimination of forest landscape types in section III. The results and discussion are given in section IV, and, finally, the conclusion is given in section V.
2. Dataset description 2.1 Study area
French Guiana is situated on the northern coast of the South American continent, bordering the Atlantic Ocean as well as Brazil and Suriname (Figure 1.a). French Guiana’s area is approximately 83,534 km2, and forest occupies approximately 80,820 km2 or approximately 96.75% of its total size. The terrain is mostly low-lying, rising occasionally to small hills and mountains, with an altitude ranging from 0 to 851 m. In addition, 67.8% of its slopes are lower than five degrees, 24.0% are between five and ten degrees and 8.2% are higher than ten degrees (derived from the SRTM elevations). Dense tropical forests predominate outside the coastal plain and cover more than four-fifths of the land area. Other vegetation types also exist, such as savannas and agricultural crops. French Guiana has an equatorial climate with two main seasons, the dry season, from August to December, and the rainy or wet season, from December to June.
INSERT FIGURE 1 HERE
2.2. ICESat/GLAS
LiDAR data were acquired from the GLAS on board the Ice, Cloud, and Land Elevation Satellite (ICESat) between 2003 and 2009. The GLAS laser footprints have a nearly circular shape of approximately 70 m in diameter and a footprint spacing of approximately 170 m along their track. The data were acquired during 18 missions using three on-board lasers with orbit cycles repeating between 57 and 197 days. Over French Guiana, GLAS data acquisition time coincides with the wet (Feb-March and May-June) and dry (October-November) seasons.
The horizontal geolocation error of the ground footprints is less than 5 m, on average, for all ICESat missions (http://nsidc.org/data/icesat/laser_op_periods.html). Several studies (e.g., Carabajal and Harding, 2006; Huang et al., 2011) have estimated the vertical accuracy of the GLAS to be between 0 and 3.2 cm over flat surfaces, on average.
From the 15 data products available from the ICESat GLAS, the GLA01 and GLA14 data products were used in this study. The GLA01 comprises the full waveform data, and GLA14 comprises the global land surface altimetry data. Over flat terrain, the waveforms acquired over vegetated areas are bimodal distributions, with the first peak representing reflections from the canopy top and the last peak representing the ground (Figure 2). To exclude unreliable GLAS data (i.e., data affected by atmospheric conditions, clouds, etc.), several filters were applied. (1) Signals with high noise were removed when the signal to noise ratio was higher than 15 (e.g., Carabajal and Harding, 2006; Chen 2010; and Lee et al., 2011). This filter removed 36.4% of the data. (2) The GLAS waveforms with delays from either saturation or atmospheric forward scattering were removed (14.1% of the data). Only cloudless waveforms were kept using the cloud detection flag (FRir_qaFlag = 15). This filter removed 32.4% of the data. Saturated signals were identified using the GLAS flag (SatNdx > 0). (3) The waveforms with a centroid elevation significantly higher or lower than the corresponding SRTM elevation were removed (|SRTM - GLAS| > 100 m) (Baghdadi et al., 2013). This filter removed 2% of the data. (4) The GLAS footprints with SRTM values higher than the GLAS canopy top elevation and lower than the GLAS ground elevation were also removed, which accounted for 33.4% of the data. Both the FRir_qaFlag and SatNdx flags were found in the GLA14 product. From the original database of 101312 footprints, 12238 footprints that satisfied the 4 filters conditions were kept (Figure 1.a). Finally, the GLAS data referenced to the TOPEX/Poseidon were converted to WGS84 by subtracting 70 cm from the elevation
values. The conversion between the two ellipsoids also depends on latitude; however, as this change is smaller than the horizontal accuracy of the GLAS, it was omitted
INSERT FIGURE 2 HERE
2.3 SRTM DEM
The Shuttle Radar Topography Mission (SRTM) acquired a digital elevation model of the
earth’s surface on a nearly global scale (50o
S to 60oN). The vertical accuracy of the SRTM 90
m DEM is 16 m with a 20 m horizontal accuracy
(http://www2.jpl.nasa.gov/srtm/datafinaldescriptions.html). In this study, the SRTM 90 m DEM currently available for French Guiana was used. Over French Guiana, Bourgine and Baghdadi (2005) found that the accuracy of the SRTM DEM was approximately 10 m (standard deviation of error).
The SRTM data are available as orthometric heights, with WGS84 as the horizontal datum and the Earth Gravitational Model (EGM96) geoid as the vertical datum. To compare the ICESat/GLAS and SRTM elevations, the SRTM geoidal heights were converted to ellipsoidal heights by adding the EGM96 geoidal undulations. The geoidal undulations are available on a 0.1x0.1-degree grid interpolated onto the pixel coordinates. The SRTM dataset was interpolated onto each ICESat/GLAS footprint using bilinear interpolation.
2.4 French Guiana landscape classes
The forest landscape classes in French Guiana were defined in a study carried out by Gond et al. (2011). The method Gond et al. (2011) used was based on the analysis of one year of daily data from the VEGETATION/SPOT sensor. This dataset has a spatial resolution of 1 km with a geometric accuracy of vegetation data on a day-to-day basis between 300 and 465 m for the
absolute location and from 325 to 625 m for multi-temporal superimposition (Sylvander etal.,2000). The dataset was then analyzed with the ISODATA unsupervised classification scheme. The results were pixel clusters called remotely sensed landscape classes (RSLC). The RSLC comprise 33 classes combined into 12 landscape types (LTs) (Table 1). In this study, only LTs 8 to 12 were studied because 93% of the ICESat/GLAS footprints over French Guiana correspond primarily to these five LTs.
LT8 represents dense, closed-canopy forest with small crowns of the same canopy height and small gaps mixed with regular canopies with well-developed crowns of almost the same canopy height without large gaps interlaced with flooded savannas (10%). LT9 is a closed canopy forest dominated by well-developed crowns of almost the same canopy height without large gaps. LT10 is an irregular- and disrupted-canopy forest where the trees have very different heights and different crown diameters with large gaps mixed with closed-canopy forest dominated by well-developed crowns at almost the same elevation without large gaps. LT10 is also interlaced with liana forests. LT11 is similar to LT10 with more liana forest and non-forest land covers. LT12 is an open forest associated with wetlands and bamboo thickets. The dataset was already geo-referenced using the WGS84 geodesic system, so no further transformations were needed.
INSERT TABLE 1 HERE
3. Materials and methods 3.1 Methodology
To assess the potential of the GLAS and SRTM data to discriminate the five main forest landscape types in French Guiana, the difference between the GLAS highest elevations and the SRTM elevations was investigated, as well as the difference between the GLAS centroid
elevations and the SRTM elevations. Figure 1b shows the profile of the GLAS (highest and centroid) and the SRTM elevations along the track from A to B (Figure 1b). First, the differences between the GLAS (highest and centroid) and SRTM elevations were analyzed for each forest landscape type. Next, because of the influence of canopy height (Hc) and the roughness index (R) on the penetration depth of the SRTM radar wave in the canopy, the differences between the GLAS and SRTM elevations were studied according to the classes of canopy height and the roughness index. Four canopy height classes (Hc < 10 m, 10 m ≤ Hc <
20 m, 20 m ≤ Hc < 30 m, and Hc ≥ 30 m) and three roughness index classes (R < 5 m, 5 m ≤ R < 10 m, R ≥ 10 m) were chosen for each forest landscape type.
To analyze the potential for discrimination of the five main forest landscape types (LTs) using the coupling of the GLAS and SRTM data, a classification of the GLAS footprints based on the Random Forest algorithm was conducted using the penetration depth, the difference between the GLAS centroid elevations and the SRTM elevations, the GLAS canopy height and the SRTM roughness index.
Several classifiers, such as CART (Classification And Regression Trees), SVM (Support Vector Machines), logistic regression, and the Random Forest classifier, were tested in this study. However, Random Forest represents the statistical mode of many classification and regression trees (CART); hence, it is a more robust model than a single tree (Breiman, 2001). In addition, Random Forest does not over-fit, even if more trees are added, it always converges, it produces error estimates of the predictions and of the importance of the variables, and it handles weak explanatory variables. The variable importance index it produces is very important, as it allows an understanding of the relative values of the predictors used in the classification and therefore removes unnecessary predictors. Variable importance is based on two measures (Liaw and Wiener, 2002). The first is a measure of accuracy obtained by quantifying the mean squared error increase in the model by the
removal of a variable. The other importance measure is the Gini index, which quantifies the degree to which a variable produces terminal nodes in the classification forest. Finally, the Random Forest classifier is less sensitive to outliers and noise (the 10 m vertical accuracy of the SRTM data in our case) in comparison to other classification routines (Breiman, 2001). The Random Forest (RF) algorithm is also known to be a powerful classification method that is becoming widely used by the remote sensing community for land-cover classification (e.g., Rodriguez-Galiano et al., 2012; Immitzer et al., 2012; and, Kankare et al., 2013). RF is designed to produce accurate and robust predications without over-fitting the data while being insensitive to outliers and noise in comparison to single classifiers (Breiman 2001). Random Forest is called an ensemble classifier because it uses a tree-based classifier multiple times and aggregates the results. However, each tree is grown using a randomized subset of predictors. The final prediction decision is based on a voting system of all the predictions from the decision trees that have been created. Furthermore, because of the inability to
examine the decision trees directly, Random Forest is considered more of a “black box”
approach. However, several metrics are available to aid in the interpretation, one of which is the variable importance, which is evaluated based on the increase in the error in the prediction when removing a certain variable.
Finally, a comparison between the GLAS waveforms acquired at the same location in the dry and wet seasons was carried out to analyze its potential in the discrimination between the different forest LTs. The overlapping GLAS footprints, one from the wet season and one from the dry season, were compared against their corresponding SRTM elevations. However, to quantify the changes between the dry-wet season pairs, further processing of the waveforms was required. The first step was to obtain the waveform pairs. This was based on the geographic coordinates of each footprint (ellipse center) found in the GLA14 product. Two footprints from the wet/dry seasons, according to Duong et al. (2009), were considered a pair
if the distance between their centers was equal to or less than the sum of the footprints’ radii divided by 2 (the two footprints were partly overlapping). Next, due to the different intensity returns caused by the laser output and/or different atmospheric conditions, the waveform pairs were normalized to enable comparison between them (Duong et al., 2009). The normalization procedure requires the division of each received bin voltage (Vi) by the total energy of the waveform Vt, where ∑ , with N being the number of waveform bins (544 or 1000 bins, depending on the GLAS mission). Finally, due to technicalities with the receiver, the recording of a pair of waveforms did not start at the same local time, even if they were similar in structure, thus producing a time lag, and hence, a shifting operation was needed. According to Hofton and Blair (2002), the shift operation can be performed on the complete waveform. The time shift needed to match a pair of coincident waveforms was determined by the maximum of the cross correlation ̂ defined by (m=1,...,2N-1):
̂ { ∑ ̂ (1)
Ww and Wd represent the normalized signals from the wet and dry season, respectively. The results of the shifting algorithm are shown in Figure 3. As illustrated in Figure 3, two waveforms recorded in different seasons (wet and dry) and at approximately the same location do not match. The waveform from the dry season was shifted 43 ns to the right of the waveform from the wet season. Therefore, using the cross-correlation technique described above, it was possible to match them for further comparisons. The flowchart summarizing the processing of the SRTM and GLAS data is shown in Figure 4.
INSERT FIGURE 3 HERE INSERT FIGURE 4 HERE
3.2 GLAS waveform processing
To conduct a full comparison between the GLAS and SRTM elevations, several parameters needed to be extracted from the GLAS waveforms: signal start and end, ground peak position, highest, centroid and lowest elevations, and tree heights.
GLAS’s signal start and end are defined as the first and last locations where the waveform
intensity exceeds a certain threshold level (n.σb, where σb is the standard deviation of the background noise) above the mean background noise (µb) (e.g., Chen, 2010; Lefsky et al.,
2005). Both µb and σb are found in the GLA14 product. However, there are no consistent
optimal thresholds that can be used for all study areas (Chen, 2010). Different thresholds have been used in different studies, including 3σb in Sun et al. 2008, 3.5σb in Xing et al. 2010, 4σb
in Lefsky et al. 2005 and 4.5σb in Baghdadi et al. 2013. In this study, a threshold of 4.5σb
was used. The difference between the signal end and signal start is called the waveform extent. The ground peak is identified using either the last peak (e.g., Sun et al., 2008; Xing et al., 2010) or the strongest in amplitude between the last two peaks (e.g., Rosette et al., 2008; and Hofton et al., 2002). After close examination of the GLAS waveforms in French Guiana, the ground peak was identified using the Gaussian peak representing the highest amplitude from the last two peaks.
The GLAS product only provides the centroid elevation in a footprint. To estimate the highest and lowest elevations, the following approach was used. First, the position of the centroid within the waveform over the relative time axis was determined. Then, to determine the highest elevation, the difference between the position of the centroid and the signal start was added to the centroid elevation. Similarly, the lowest elevation was determined by subtracting the difference between the position of the centroid and the ground peak from the centroid elevation. The lowest elevation is less accurate than the top elevation because the identification of the ground peak is more error prone than the identification of the signal start.
3.3 Canopy height and roughness index estimations
The GLAS canopy heights (Hc) were estimated using the most commonly used method in areas of low relief, introduced by Lefsky et al. (2005), which uses the difference between the signal start (Hs) and the ground peak (Hg).
Hc = Hg – Hs (2)
The roughness index (R), according to Carabajal and Harding (2006), was defined as the standard deviation of the values of the SRTM elevation data in a 3x3 window.
4. Results and discussion
In this section, we analyze the possibility for the discrimination of the different forest landscape types using the GLAS and SRTM data. First, in section 4.1, the discrimination potential for the different forest LTs is analyzed using the SRTM penetration in the canopies (GLAS highest - SRTM). Then, section 4.2 analyzes the discrimination potential according to two added parameters, canopy height (Hc) and the roughness index (R). The differences between the GLAS and SRTM elevations are grouped for each LT into four canopy height classes and three roughness index classes. Next, in section 4.3, all the parameters (Hc, R and the differences between the GLAS and SRTM elevations) are used in the Random Forest classifier to classify the GLAS footprints into the five different forest LTs. Finally, section 4.4 uses the variation in the GLAS waveforms captured from two seasons (wet and dry) to classify the different forest LTs.
4.1 Global analysis of the differences between the GLAS and SRTM elevations
Several studies, such as Bhang et al. (2007), Rodriguez et al. (2006), and Hofton et al. (2006),
elevation) is affected by the type of surface it interacts with (forest, agricultural areas, etc.). In this section, the differences between the GLAS (highest and centroid) and SRTM elevations are tested for each forest landscape type (LT) to ascertain the potential of the SRTM to discriminate between these five LTs.
Table 2 shows that using either the penetration depth of the SRTM radar signal or the difference between the GLAS centroid elevations and the SRTM elevations alone is not sufficient for discriminating the five forest landscape types (LTs). Indeed, penetration is similar for LT8 and LT10 (approximately 11.0 m) and for LT9 and LT11 (12.5 m). However, the characterization of these two classes (LT8 and LT10) is very different in terms of structure. LT8 is closed, regular canopy, and LT10 is composed of high canopy with large emergent trees making it very irregular. Moreover, forest LT12 has a slightly lower penetration, with an average of 9.3 m. The difference between the GLAS centroid elevations and the SRTM elevations is also of the same order for LT8, LT9, LT10 and LT11 (approximately -5 m) and is lower for LT12 (-7.1 m). The same order of penetration for all LTs can be attributed, according to Carabajal and Harding (2006), to the following reasons: (1) the penetration of the SRTM varies with canopy height, which is not the same for all forest LTs, and (2) the roughness index plays a major role in the variability of the SRTM penetration. In the next section, the differences between the GLAS and SRTM elevations will be analyzed according to the GLAS canopy height (Hc) and the SRTM roughness index (R) to investigate if the use of additional metrics improves the discrimination between the different forest LTs.
INSERT TABLE 2 HERE
Section 4.1 showed that it was impossible to discriminate the five forest landscape types using the differences between the GLAS and SRTM elevations alone. According to some studies, other variables, such as canopy height (Hc) and the roughness index (R), might contribute to the variability in the SRTM signal’s penetration depth. Carabajal and Harding (2006), Bhang et al. (2007), and Huang et al. (2011) studied the penetration depth of the SRTM as a function of canopy height, and their results showed that penetration depth is dependent on canopy height (increases with an increase in Hc). Carabajal and Harding (2006) and Bhang et al. (2007) also studied the behavior of penetration depth as a function of the roughness index, which appear to be positively correlated. To better analyze the effect of canopy height and roughness index on the discrimination of different LTs, the GLAS footprints were regrouped for each LT, first into four canopy height classes and then into three roughness index classes.
4.2.1 Differences between the GLAS and SRTM according to Hc
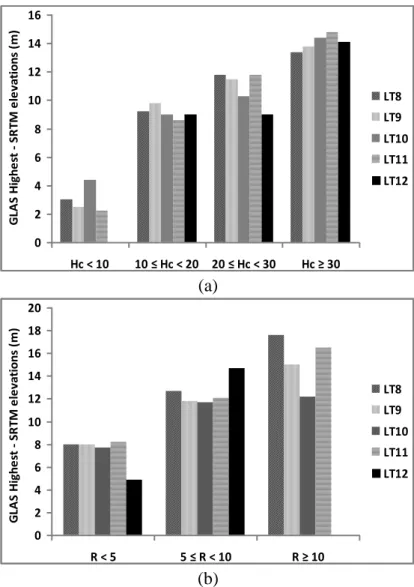
The results indicate that the discrimination of the five forest LTs is not possible using only canopy height in the analysis of the difference between the GLAS highest elevations and the SRTM elevations (same penetration of the SRTM signal for the five forest LTs in each Hc class). Figure 5a shows that the difference between the GLAS highest elevations and the SRTM elevations increased with increasing Hc. This difference increased in LT8, LT9, LT11 and LT12 from approximately 3 m when Hc was less than 10 m to approximately 14 m when Hc was greater than 30 m. LT10 showed an increase in the SRTM penetration from 4.4 m when Hc < 10 m to approximately 14 m when Hc > 30 m. This slightly higher SRTM penetration for LT10 with Hc < 10 m was due to the mean canopy height being greater than that in the other LTs (8.5 m versus 5.5 m). The increase in the SRTM penetration with the increase in canopy height was due to the C-band phase center (the position of the dominant backscattering level), which, on average, becomes increasingly biased below the canopy top
with increasing waveform extent (Becek, 2008). These results comply with the study by Carabajal and Harding (2006). Similar findings were observed in the analysis of the difference between the GLAS centroid elevations and the SRTM elevations according to Hc. Figures 6a and 6b show, respectively, the spatial distributions of the canopy height (Hc) and the penetration percentage (penetration depth divided by canopy height) in French Guiana. Figure 6a shows that over the coastal area, canopy heights tend to be no higher than 20 m (mangrove forest). The highest canopies are concentrated in the center of French Guiana, with heights mostly above 30 m. In the south of French Guiana, canopy heights are shorter, ranging between 20 and 30 m, and are mostly classified as LT11 and LT12. Figure 6b shows that the penetration percentage is the highest (> 30%) in the center of French Guiana, which mostly contains classes LT8, LT9 and LT10. For the coastal area and the south of French Guiana (mostly LT11 and LT12), the lowest penetration percentage (< 30%) was observed.
4.2.2 Differences between the GLAS and SRTM according to R
In addition, the results also show that it is possible to discriminate LT10 from LT8, LT9 and LT11 when R > 10 m (no available data for LT12 with R > 10 m). It is also possible to discriminate LT12 from the other classes when R < 5 m. This ability to discriminate LT12 from the other LTs is due to the fact that LT12 is structurally different from the other LTs (open forest with shorter canopy heights, on average). Figure 5b, which represents the difference between the GLAS highest elevations and the SRTM elevations as a function of the roughness index, shows that LT12 presents the lowest SRTM penetration when R is less than 5 m (4.9 m versus ~8 m for the other LTs). This can be explained by the denser and relatively shorter canopy forest represented within the fragmented horizontal structure of LT12 in comparison to other forest LTs. Furthermore, the difference between the GLAS highest elevations and the SRTM elevations increased significantly with increasing R for all forest
LTs. For LT8, LT9 and LT11, the mean difference between the GLAS highest elevations and the SRTM elevations increased as a function of R from approximately 8 m when R was less than 5 m to approximately 16 m when R was greater than 10 m. For LT10, the average difference between the GLAS highest elevations and the SRTM elevations increased from approximately 8 m when R was less than 5 m to approximately 12 m when R was greater than 10 m. This is most likely due to the irregular heights of the canopies in this forest LT (high forest with disrupted canopy). Moreover, the average difference between the GLAS centroid elevations and the SRTM elevations showed low dependency on the roughness index, with an average between -4 m and -7 m for different R classes and forest LTs.
The spatial distribution of the roughness index presented in Figure 6c shows that the lowest roughness index values were observed on the coastal area, ranging mostly below 5 m, where they are attributed mostly to LT8 (very regular canopy roof). Low to moderate roughness index values, ranging between 0 and 10 m, were located in the south, where they are attributed to LT11 and LT12. The center of French Guiana presents the highest values of the roughness index (> 10 m).
In conclusion, these results confirm that the discrimination between the five forest LTs requires the combination of several variables. Using the difference between the GLAS and SRTM elevations, it was not possible to classify the different LTs as a function of Hc because of the effects of the roughness index. The same thing applies when attempting to classify different LTs as a function of R because of the effects of canopy height.
INSERT FIGURE 5 HERE INSERT FIGURE 6 HERE
The Random Forest (RF) classification was performed using the differences between the GLAS (highest and centroid) and the SRTM elevations, the GLAS canopy height, and the SRTM roughness index to analyze the discrimination between the different forest LTs. The results show that all forest LTs were well classified with good accuracy, according to the map by Gond et al. (2011). The Random Forest classification results summarized in Table 3 show an overall accuracy of 83.3% (kappa coefficient of 0.75). Moreover, the producer’s accuracies ranged between 78.4% (LT11) and 97.5% (LT12), and the user’s accuracies ranged between 77.3% (LT9) and 96.3% (LT12). The results show that the coupling between the GLAS and SRTM elevations allows better distinction between forests that are quite different (LT8, LT10, and LT12), and the most misclassifications were observed between LT9 and LT11 (approximately 12%).
The observed misclassifications between LT9 and LT11 could be explained by their similar characteristics and proximity and by the LT spatial distribution map used as a reference in our analysis (Gond et al., 2011), which has a sample size of 1 square-kilometer, whereas the GLAS footprints are, at most, 100 m in diameter. This difference in spatial scale could have had an effect on the classification results.
Our dataset contained forest LTs with uneven sample counts (LT9 represents more than 58% of the total dataset). The use of a dataset with uneven class sizes will result in a classifier biased towards the majority class (Huang et al., 2005). Therefore, a random under-sampling technique is often used (Kotsiantis et al., 2003). This technique balances the dataset by removing samples randomly from the majority class. However, the elimination of samples from a class could eliminate useful samples. Thus, it is recommended that the majority class be under-sampled into several subsets (Liu et al., 2009). Then, the classifier is trained and validated using each of the subsets, and the results of all the classifiers are averaged. In this study, the majority class LT9 was under-sampled into four subsets (each with 1788 points).
After the sub-setting, the subsets were each randomly divided into 90% training and 10% validation data samples. The prediction error based on a 10-fold cross-validation was estimated to validate the generalization performance of the Random Forest algorithm. The importance of the variables used in the Random Forest algorithm was also assessed. The results show that the difference between the GLAS highest elevations and the SRTM elevations was the most important variable, followed by canopy height and the roughness index. The difference between the GLAS centroid and the SRTM showed the lowest importance.
The influence of the size of the training dataset on the behavior of the Random Forest classifier was subsequently assessed using three cases: (1) only 20 samples were used for each
forest LT (the draw of the 20 random samples for each LT was repeated 100 times), (2) 243 samples were used for each forest LT, corresponding to the lowest class size in our dataset (LT12), and (3) all samples available in our dataset were used with uneven class sizes between the LTs, with 243 samples from LT12 and 7151 samples from LT9. The results show that RF has a low sensitivity to the training dataset size reduction, with an overall classification accuracy slightly lower for the case with 20 samples for each LT (case 1) in comparison to the other two cases (approximately 78.0% for case 1 and 84% for cases 2 and 3). The kappa coefficient was also of the same order for the three cases, with values of approximately 0.7 for cases 1 and 3 and 0.8 for case 2. In addition, the producer’s and user’s accuracies were similar for all forest LTs, except for LT10 and LT11, where the accuracies were lower by approximately 20% for case 1 in comparison to cases 2 and 3 (approximately 64% for case 1 and 84% for cases 2 and 3). This result shows that LT10 and LT11 most likely have high intra-class variability, and for this reason, it is necessary to use a larger number of training samples for these forest LTs (Rodriguez-Galiano et al., 2012).
Finally, to ensure that RF is not over-fitting, an additional test was carried out. First, for each of the three cases described above, the explanatory variables (differences between the GLAS and SRTM elevations, the roughness index, and canopy height) were randomly permuted. Then, the classifier was trained and tested on the new dataset. Next, the predictions obtained from the 1000 datasets resulting from the permutation allowed the calculation of the 95% confidence interval for the different elements in a confusion matrix. The results show that at a
95% confidence interval, the user’s and producer’s accuracies were less than 25%, except for
LT9 in case 3, where the user’s and producer’s accuracies were approximately 54%, and 91%, respectively. Classifiers trained with unequal class sizes have a tendency to classify the
majority of the samples in the majority class to lower the classifier’s error rate (Liu et al.,
2009). In this study, LT9 contains approximately 58% of all the samples, so the classifier, in order to obtain the lowest classification error rate, classified most of the samples in LT9. The classification results are shown in Figure 7.
INSERT TABLE 3 HERE INSERT FIGURE 7 HERE
4.4. Effect of the GLAS acquisition season
A study by Duong et al. (2009) demonstrated the potential to classify broad-leaved, mixed and needle-leaved trees using GLAS footprint pairs taken from two seasons (dry and wet seasons). Two waveforms, one from the dry season and one from the wet season, were considered a pair if the distance between the footprint centers was less than or equal to the sum of their radii divided by 2. In this section, waveform pairs from the wet (December to June) and dry (August to December) seasons are compared to show the potential for discriminating different forest LTs using five criteria: (1) difference between the GLAS
highest elevations and the SRTM elevations, (2) difference between the GLAS centroid elevations and the SRTM elevations, (3) penetration percentage in each season, (4) ratio of the canopy top energy in the wet season to the canopy top energy in the dry season, and (5) ratio of the ground energy in the wet season to the ground energy in the dry season. The canopy top energy is defined by Duong et al. (2009) as the energy from signal start to end from the vegetated part of the canopy, and the ground energy corresponds to the energy from the ground peak.
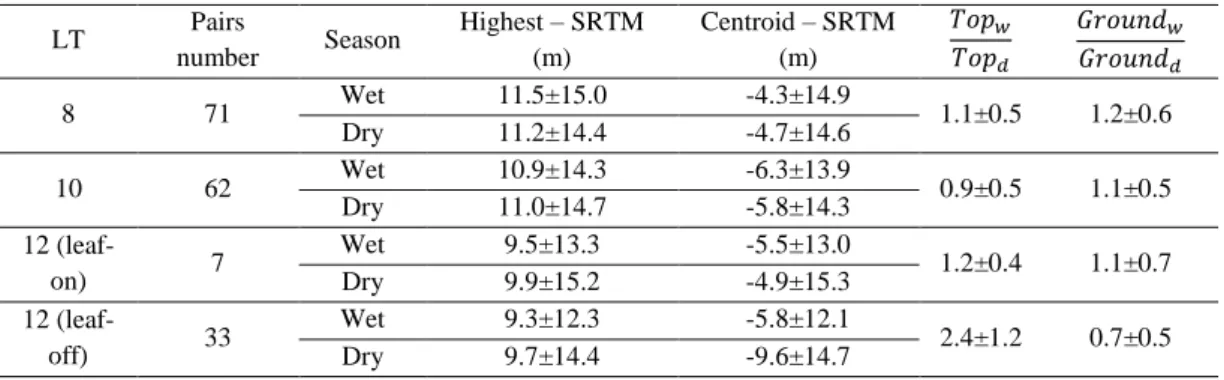
The analysis of the difference between the GLAS (highest and centroid) and the SRTM elevations, conducted separately for the GLAS footprints acquired during the wet and the dry seasons, showed similar differences for both seasons (Table 4). The difference between the GLAS highest elevations and the SRTM elevations for all LTs varied from 9.1 to 12.3 m in the wet season and from 9.6 to 12.9 m in the dry season. The difference between the GLAS centroid elevations and the SRTM elevations varied between -3.1 and -6.7 m in the wet season and between -4.7 and -7.7 m in the dry season. This slight difference between the two seasons could be due to some trees losing leaves in the dry season, meaning the GLAS waveform penetrates more into the canopy in the dry season compared to the same canopy in the wet season.
The waveform pairs were next separated into two categories. The first, called leaf-on corresponds to the waveforms without changes between the two seasons (trees with leaves in both seasons). The second category, called leaf-off, represents trees that shed their leaves in the dry season. Leaf-off trees were identified from the GLAS waveform pairs that showed changes in the amplitudes of the canopy top and ground peaks from one season to another (the distance between footprint pairs should be lower than half the sum of their radii). The threshold was set to be half of the reference top and ground peaks. In general, when trees shed their leaves in the dry season, the GLAS waveform reflections from the ground are more
prominent. This causes an increase in the amplitude of the ground peak with a decrease in the amplitude of the canopy top in comparison to the waveforms from the wet season. In total, 71 waveform pairs were identified for LT8 (all leaf-on), 62 pairs for LT10 (all leaf-on), and 70 pairs from LT12 (7 leaf-on and 33 leaf-off) (Table 5).
The ratio of the energies from the canopy tops in the wet and dry seasons
, as well as
the ratio of the energies from the ground in both seasons
, were calculated (Table
5). On average, the largest change was detected in the leaf-off pairs of LT12, with a
of
2.4, as opposed to 1.1 for LT8, 0.9 for LT10, and 1.2 for the leaf-on LT12. Moreover, Table 5 shows that the ratio
is similar for LT8, LT10 and the leaf-on LT12, with a value of
approximately 1.1. A lower ratio value was obtained for the leaf-off LT12 (0.7) because canopies in the leaf-off class of LT12 appear to shed their leaves in the dry season, allowing a greater reflection from the ground surface. Table 5 also quantifies the changes in the waveform centroid elevations in comparison with the SRTM. For the pairs in LT8, LT10 and the leaf-on LT12, the difference between the GLAS centroid elevations and the SRTM elevations is similar for the data in both the dry and wet seasons, with values between -4.3 and -6.3 m for the wet season and between -4.7 and -5.8 m for the dry season. Conversely, this difference increases for the leaf-off pairs of LT12, from -5.8 m in the wet season to -9.6 m in the dry season. This difference means that the GLAS is able to penetrate the forest to a deeper depth in the dry season if the forest characteristics (leaves) change between the seasons. In conclusion, LT12, a deciduous forest type, could efficiently be discriminated based on the seasonal variation of the GLAS signal. Pennec et al. (2011) found that in comparison to other LT types, LT12 has the highest enhanced vegetation index (EVI) all year round. This high EVI could be caused by under-canopy activity. This result is very important because it shows the utility of multi-season LiDAR data for mapping forest types that lose
their leaves in the dry season, which is not possible with the optical imagery typically used. Figure 8 shows the locations of the leaf-on and leaf-off pairs in French Guiana, revealing that the majority of the leaf-off pairs are located in the same area in the south of French Guiana.
INSERT TABLE 4 HERE INSERT TABLE 5 HERE INSERT FIGURE 8 HERE
5. Conclusion
In this study, the coupling of the GLAS LiDAR and the SRTM DEM elevations (GLAS highest - SRTM and GLAS centroid - SRTM) was assessed for its potential to discriminate different forest landscape types in French Guiana. A dataset of 12238 GLAS elevations calculated from GLAS waveforms, namely, the highest and centroid elevations was compared to SRTM elevations. Based on the VEGETATION-SPOT-derived forest landscape types from Gond et al. (2011), GLAS footprints and their corresponding SRTM elevations were analyzed according to the five forest landscape types.
The results show that the mean differences between the GLAS and SRTM elevations were of the same order for all forest landscape types (LTs). Furthermore, these differences increased as a function of GLAS canopy height and SRTM roughness index in all forest landscape types (LT). Hence, discrimination between the different forest LTs requires other variables in addition to the differences between the GLAS and SRTM elevations, such as canopy height and the roughness index.
A classification based on the Random Forest algorithm using the differences between the GLAS and SRTM elevations, as well as canopy height and the roughness index, was conducted. All forest LTs were well classified with accuracies between 78.4% and 97.5%.
Furthermore, the classification was achieved with an overall accuracy of 81.3% (kappa coefficient of 0.75).
Coincident GLAS footprints, one from the wet season and one from the dry season, were analyzed to study their potential for discriminating different forest LTs according to the changes occurring between the GLAS waveforms pairs. The results show that the open forest LT (LT12), which is known to be mostly deciduous, was discriminable from other forest LTs using one of the following three criteria: (1) difference between the GLAS centroid elevations and the SRTM elevations, (2) ratio of energy from the canopy top in the wet season to energy from the canopy top in the dry season, or (3) ratio of ground energy in the wet season to ground energy in the dry season.
The results of this study show that discrimination between different forest landscape types is possible using the SRTM and GLAS data. Moreover, the results indicate that LiDAR data allow a better characterization for certain forest types in comparison to optical images. Indeed, in our study (section 4.4), multi-season LiDAR data were capable of distinguishing forest types that lose their leaves in the dry season (LT12).
Finally, the SRTM and GLAS data could be used in conjunction with other remote sensing data (radar or optical data) to produce more accurate land-cover maps of large areas with a better resolution in comparison to current land-cover maps.
Acknowledgments
The authors wish to thank the National Snow and Ice Data Center (NSDIC) for the distribution of the ICESat/GLAS data.
Addo-Fordjour, P., and Rahmad, Z.B., 2013. Mixed Species Allometric Models for Estimating above-Ground Liana Biomass in Tropical Primary and Secondary Forests, Ghana,
ISRN Forestry.
Baghdadi, N., le Maire, G., Fayad, I., Bailly, J.S., Nouvellon, Y., Lemos, C., and Hakamada, R., 2013. Testing different methods of forest height and aboveground biomass estimations from ICESat/GLAS data in Eucalyptus plantations in Brazil. IEEE- JSTARS, in press.
Bartholomé, E., Belward, A., Beuchle, R., Eva, H., Fritz, S., Hartley, A., Mayaux, P., Stibig, H.J., 2004. Global land cover for the year 2000, land cover classification produced with data acquired in 2000 from the VEGETATION instrument, onboard the SPOT-4 satellite, 1/25.500.000 scale map. In: European Commission, LB-55-03-099-ENC
Becek, K., 2008. Investigation of elevation bias of the SRTM C- and X-Band digital elevation models. The International Archives of the Photogrammetry, Remote Sensing and Spatial
Information Sciences, XXXVII, B1.
Bhang, K.J., Schwartz, F.W., and Braun, A., 2007. Verification of the vertical error in C-band SRTM DEM using ICESat and Landsat-7, Otter Tail County, MN. IEEE-GRSE, 45, 36-44.
Bourgine, B., and Baghdadi, N., 2005. Assessment of C-band SRTM DEM in a dense equatorial forest zone. Comptes Rendus Geoscience, 337, 1225-1234.
Breiman, L., 2001. Random forest, Machine Learning, 45, 1, 5–32.
Carabajal, C., and Harding, D.J., 2006. SRTM C-band and ICESat laser altimetry elevations comparisons as a function of tree cover and relief. Photogrammetric Engineering & Remote
Sensing, 72, 3, 287-298.
Chave, J., Andalo, C., Brown, S., Cairns, M. A., Chambers, J. Q., Eamus, D., and Yamakura, T., 2005. Tree allometry and improved estimation of carbon stocks and balance in tropical forests. Oecologia, 145(1), 87-99.
Chen, Q., 2010. Retrieving vegetation height of forests and woodlands over mountainous areas in the Pacific Coast region using satellite laser altimetry. Remote Sensing of
Environment, 114, 1610–1627.
Dalponte, M., Bruzzone, L., and Gianelle, D. 2008. Fusion of hyperspectral and lidar remote sensing data for classification of complex forest areas. IEEE Trans.Geoscience and Remote
Sensing, 46(5), 1416-1427
Duong V.H., Lindenbergh, R., Pfeifer, N., and Vosselman, G., 2008. Single and two epoch analysis of ICESat full waveform data over forested areas. International Journal of Remote
Sensing, 29, 1453-1473.
Gond, V., Freycon, V., Molino, Jean-François., Brunaux, O., Ingrassia, F., Joubert, P., Pekel, J. F., Prévost, Marie-Françoise., Thierron, V., Trombe, P. J., Sabatier, Daniel., 2011. Broad-scale spatial pattern of forest landscape types in the Guiana Shield. International Journal of
Applied Earth Observation and Geoinformation, 13, 357-367.
Harding, D.J., Lefsky, M., Parker, GG., and Blair, J.B., 2001. Laser altimeter canopy height profiles. Method and validation for closed canopy, broadleaf forests. Remote Sensing of
Environment, 76, 283–297.
Hofton, M.A., and Blair, J. B., 2002. Laser altimeter return pulse correlation: A method for detecting surface topographic change. Journal of Geodynamics, 34, 477-489.
Hofton, M., Dubayah, R., Blair, J.B., and Rabine, D., 2006. Validation of SRTM elevations over vegetated and non-vegetated terrain using medium footprint LiDAR. Photogrammetric
Engineering & Remote Sensing, 72, 279-285.
Dubayah, R., Drake, J. 2000. LIDAR remote sensing for forestry. Journal of Forestry, 98, 44-46.
Huang, Y.M., and Du, S.X., 2005. Weighted support vector machine for classification with uneven training class sizes. Proceedings of 2005 International Conference on Machine Learning and Cybernetics, 7, 4365-4369.
Huang, X., Xie, H., Liang, T., and Yi, D., 2011. Estimating vertical error of SRTM and map-based DEMs using ICESat altimetry data in the eastern Tibetan Plateau. International Journal
of Remote Sensing, 32, 5177-5196.
Hudak, A. T., Crookston, N. L., Evans, J. S., Hall, D. E., & Falkowski, M. J., 2008. Nearest neighbor imputation of species-level, plot-scale forest structure attributes from LiDAR data.
Remote Sensing of Environment, 112, 2232–2245.
Immitzer, M., Atzberger, C., and Koukal, T., 2012. Tree Species Classification with Random Forest Using Very High Spatial Resolution 8-Band WorldView-2 Satellite Data. Remote
Sensing, 4, 2661-2693.
Kankare, V., Vastaranta, M., Holopainen, M., Räty, M., Yu, X., Hyyppä, J., Hyyppä, H., Alho, P., and Viitala, R., 2013. Retrieval of Forest Aboveground Biomass and Stem Volume with Airborne Scanning LiDAR. Remote Sensing, 5, 2257-2274.
Kotsiantis, S., and Pintelas, P., 2003. Mixture of Expert Agents for Handling Imbalanced Data Sets. Annals of Mathematics Computing & TeleInformatics, 1, 46-55.
Lee, S., Ni-Meister, W., Yang, W., and Chen, Q., 2011. Physically based vertical vegetation structure retrieval from ICESat data: Validation using LVIS in White Mountain National Forest, New Hampshire, USA. Remote Sensing of Environment, 115, 2776–2785.
Lefsky, M.A., Cohen, W.B., Parker, G.G., and Harding, D.J., 2002. LIDAR remote sensing for ecosystem studies. BioScience, 52(1), 19–30
Lefsky, M.A., Harding, D.J., Keller, M., Cohen, W.B., Carabajal, C., Del Born Espirito-Santo, F.B., Hunter, M.O., and Oliveira, R., 2005. Estimates of forest canopy height and aboveground biomass using ICESat. Geophysical Research Letters, 32, L22S02.
Liaw, A., and Wiener, M., 2002. Classification and Regression by randomForest. R news,
2(3), 18-22.
Liu, X.U., Wu, J., and Zhou, Z.H., 2009. Exploratory Undersampling for Class-Imbalance Learning. IEEE Transactions on Systems, Man, and Cybernetics, Part B, 2, 539-550.
Mayaux, P., Bartholome, E., Fritz, S., and Belward, A., 2004. New land-cover map of Africa for the year 2000. Journal of Biogeography, 31, 861–877.
Mitchard, E. T. A., Saatchi, S. S., White, L. J. T., Abernethy, K. A., Jeffery, K. J., Lewis, S.L., Meir, P.. 2012. Mapping tropical forest biomass with radar and spaceborne LiDAR in Lopé National Park, Gabon: overcoming problems of high biomass and persistent cloud. Biogeosciences, 9(1).
Mundt, J. T., Streutker, D. R., & Glenn, N. F. 2006. Mapping sagebrush distribution using fusion of hyperspectral and lidar classifications. Photogrammetric Engineering & Remote
Sensing, 72, 47-54.
Ni-Meister, W., S. Lee, A. H. Strahler, C. E. Woodcock, C. Schaaf, T. Yao, K. J. Ranson, G. Sun, and J. B. Blair, 2010. Assessing general relationships between aboveground biomass and vegetation structure parameters for improved carbon estimate from lidar remote sensing, J.
Geophys. Res., 115, G00E11
Pennec, P., Gond, V., and Sabatier, D., 2011. Characterization of tropical forests phenology in French Guiana using MODIS time-series. Remote Sensing Letters, 2 (4), 337–345
Rodríguez, E., Morris, C.S., and Belz, J.E., 2006. A Global Assessment of the SRTM Performance. Photogrammetric Engineering & Remote Sensing, 72, 249-260.
Rodriguez-Galiano, V.F., Ghimire, B., Rogan, J., Chica-Olmo, M., and Rigol-Sanchez, J.P., 2012. An assessment of the effectiveness of a random forest classifier for land-cover classification. ISPRS Journal of Photogrammetry and Remote Sensing, 67, 93-104.
Sun, G., Ranson, K.J., Kimes, D.S., Blair, J.B., and Kovacs, K., 2008. Forest vertical structure from GLAS: An evaluation using LVIS and SRTM data. Remote Sensing of Environment, 112, 107–117.
Sylvander, S., Henry, P., Bastien-Thiry, C., Meunier, F., and Fuster, D., 2000. VEGETATION geometrical image quality. VEGETATION-2000 Symposium, Belgirate
Williams, R.J., Zerihun, A., Montagu, K.D., and Hoffman, M., Hutley, L.B., Chen, X., 2005 Allometry for estimating aboveground tree biomass in tropical and subtropical eucalypt woodlands: towards general predictive equations. Australian Journal of Botany, 53, 607–619.
Xing, Y., de Gier, A., Zhang, J., and Wang, L., 2008. An improved method for estimating forest canopy height using ICESat-GLAS full waveform data over sloping terrain: A case study in Chinghai Mountains, China. International Journal of Applied Earth Observation and Rosette, A., North, P. R. J., and Suarez, J. C. Satellite Lidar estimation of stemwood volume., a method using waveform decomposition. The Photogrammetric Journal of Finland, 21, 76-85.
Zheng, D., Rademacher, J., Chen, J., Crow, T., Bresee, M., Le Moine, J., & Ryu, S. R., 2004. Estimating aboveground biomass using Landsat 7 ETM± data across a managed landscape in northern Wisconsin, USA. Remote Sensing of Environment, 93(3), 402-411.
Figures
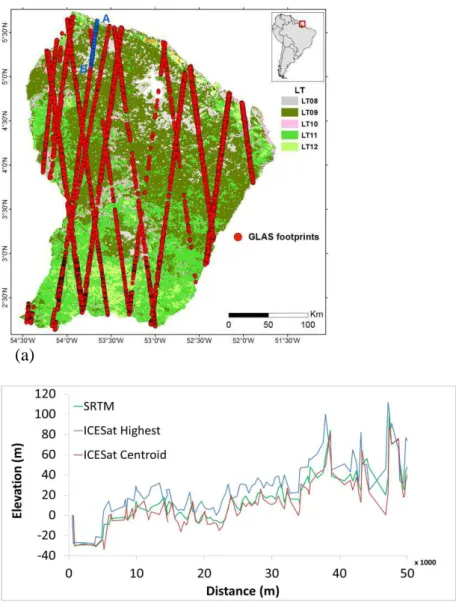
Figure 1. Location of ICESat/GLAS tracks over our study site (a) and ICESat/GLAS highest, centroid and SRTM elevations along a profile track (A to B) across the study site (b). Central
coordinates of French Guiana are 5°15’N and 52°55’W.
(a)
Figure 2. A typical GLAS waveform acquired over a vegetated area on a flat terrain.
Figure 3. Typical GLAS waveform acquired during the wet season (grey) used as a reference for the shifting of the same waveform acquired during the dry (dashed), and the shifted waveform from the dry season (black).
Figure 5. Differences between GLAS elevations (highest and centroid) and SRTM elevations for each forest landscape type (LT) according to four canopy height (Hc) classes (a) and three roughness index (R) classes (b). Only statistics with a count greater than 20 were used.
(a)
(b)
Figure 6. Spatial distribution of canopy heights (a), penetration percentage (b), and roughness index (c) over French Guiana.
0 2 4 6 8 10 12 14 16 Hc < 10 Hc < Hc < Hc G L A S H igh e st SR T M e le va ti o n s (m ) LT8 LT9 LT10 LT11 LT12 0 2 4 6 8 10 12 14 16 18 20 R < 5 5 R < R G L A S H igh e st SR T M e le va ti o n s (m ) LT8 LT9 LT10 LT11 LT12
(a)
(b)
(c)
Figure 7. Classification of GLAS footprints into five forest landscape types using Random Forest algorithm.
Tables
Table 1. Landscape types (LT) in the study area according to Gond et al. (2011), with DCF, RCF and ICF representing the percentage of dense canopy forests, regular canopy forests and irregular canopy forests, respectively.
LT code Landscape type RSLC code DCF RCF ICF
1 Permanent/temporary water body 2 to 13, 27, 29, 31, 33 - - -
2 Agriculture settlement / city 32 - - -
3 Grassland / Savanna 28, 30 - - -
4 Tree / Savanna 25, 26 - - -
5 Woodland savanna / Dry forest 23, 24 - - -
6 Flooded forest / Montane thicket 16, 17 - - -
7 Swamp / Montane bog 14, 15 - - -
8 Low dense forest / Included savanna 18 44.1 32.7 6.4 9 High forest with regular canopy 19 9.0 56.9 26.2 10 High forest with disrupted canopy 20 33.5 49.6 3.5
11 Mixed high and open forest 21 3.9 27.9 45.4
12 Open forest / Euterpe palm forest 22 5.5 18.5 27.0
Table 2. Statistics (mean ± standard deviation) of the difference between GLAS highest and SRTM elevations for each of the five forest landscape types (LT).
LT Highest – SRTM (m) Centroid – SRTM (m) Count
8 11.0±12.3 -4.2±12.1 1421
9 12.2±13.0 -5.0±13.1 7151
10 11.0±9.4 -5.5±11.4 1195
11 12.8±12.2 -5.1±12.0 2228
12 9.3±7.4 -7.1±7.2 243
Table 3. Random Forest classification results for the five forest landscape types. Reference Classes
Classified Classes LT8 LT9 LT10 LT11 LT12 Classification overall Producer’s accuracy (Omission error) LT8 1166 79 53 123 0 1421 82.1% LT9 78 1382 58 267 3 1788 77.3% LT10 52 77 966 99 1 1195 80.8% LT11 100 221 66 1839 2 2228 82.5% LT12 0 3 1 5 234 243 96.3% Truth overall 1396 1762 1144 2333 240 6875 User’s accuracy (Commission error) 83.5% 78.4% 84.4% 78.8% 97.5% Overall classification accuracy = 81.3% and kappa κ = 0.75
Table 4. Statistics (mean ± standard deviation) of the difference between GLAS (highest and centroid) and SRTM elevations for each of the forest landscape type (LT) in each season.
Wet season
LT Highest – SRTM (m) Centroid – SRTM (m) Count
8 11.4±12.1 -3.1±11.1 430 9 11.8±12.7 -4.7±12.7 1885 10 10.9±9.8 -5.3±9.4 374 11 12.3±11.7 -4.8±11.7 584 12 9.1±7.5 -6.7±8.0 152 Dry season
LT Highest – SRTM (m) Centroid – SRTM (m) Count
8 10.9±12.4 -4.7±12.4 991
9 12.3±13.0 -5.1±13.2 5266
10 10.9±10.3 -6.0±11.1 821
11 12.9±12.4 -5.2±12.1 1644
12 9.6±7.4 -7.7±5.4 91
Table 5. Comparison between wet and dry seasons for different forest LTs (no data for LT9 and LT11). Topw and Topd represent the energy of the signal reflected from the canopy top for the wet and dry seasons, respectively. Groundw and Groundd represent the energy of the signal reflected from the ground for the wet and dry seasons, respectively.
LT Pairs number Season Highest – SRTM (m) Centroid – SRTM (m) 8 71 Wet 11.5±15.0 -4.3±14.9 1.1±0.5 1.2±0.6 Dry 11.2±14.4 -4.7±14.6 10 62 Wet 10.9±14.3 -6.3±13.9 0.9±0.5 1.1±0.5 Dry 11.0±14.7 -5.8±14.3 12 (leaf-on) 7 Wet 9.5±13.3 -5.5±13.0 1.2±0.4 1.1±0.7 Dry 9.9±15.2 -4.9±15.3 12 (leaf-off) 33 Wet 9.3±12.3 -5.8±12.1 2.4±1.2 0.7±0.5 Dry 9.7±14.4 -9.6±14.7