Publisher’s version / Version de l'éditeur:
Analytical Chemistry, 82, 9, pp. 3899-3904, 2010-05-01
READ THESE TERMS AND CONDITIONS CAREFULLY BEFORE USING THIS WEBSITE. https://nrc-publications.canada.ca/eng/copyright
Vous avez des questions? Nous pouvons vous aider. Pour communiquer directement avec un auteur, consultez la première page de la revue dans laquelle son article a été publié afin de trouver ses coordonnées. Si vous n’arrivez pas à les repérer, communiquez avec nous à PublicationsArchive-ArchivesPublications@nrc-cnrc.gc.ca.
Questions? Contact the NRC Publications Archive team at
PublicationsArchive-ArchivesPublications@nrc-cnrc.gc.ca. If you wish to email the authors directly, please see the first page of the publication for their contact information.
NRC Publications Archive
Archives des publications du CNRC
This publication could be one of several versions: author’s original, accepted manuscript or the publisher’s version. / La version de cette publication peut être l’une des suivantes : la version prépublication de l’auteur, la version acceptée du manuscrit ou la version de l’éditeur.
For the publisher’s version, please access the DOI link below./ Pour consulter la version de l’éditeur, utilisez le lien DOI ci-dessous.
https://doi.org/10.1021/ac1004376
Access and use of this website and the material on it are subject to the Terms and Conditions set forth at
UV photochemical vapor generation sample introduction for
determination of Ni, Fe, and Se in biological tissue by isotope dilution
ICPMS
Zheng, Chengbin; Yang, Lu; Sturgeon, Ralph E.; Hou, Xiandeng
https://publications-cnrc.canada.ca/fra/droits
L’accès à ce site Web et l’utilisation de son contenu sont assujettis aux conditions présentées dans le site
LISEZ CES CONDITIONS ATTENTIVEMENT AVANT D’UTILISER CE SITE WEB.
NRC Publications Record / Notice d'Archives des publications de CNRC:
https://nrc-publications.canada.ca/eng/view/object/?id=5d1c0ee5-c873-4fb8-afd1-466243b28d7c
https://publications-cnrc.canada.ca/fra/voir/objet/?id=5d1c0ee5-c873-4fb8-afd1-466243b28d7c
UV Photochemical Vapor Generation Sample
Introduction for Determination of Ni, Fe, and Se in
Biological Tissue by Isotope Dilution ICPMS
Chengbin Zheng,†,‡Lu Yang,*,†Ralph E. Sturgeon,†and Xiandeng Hou*,‡
Institute for National Measurement Standards, National Research Council Canada, Ottawa, Ontario, Canada, K1A 0R6, and College of Chemistry, Sichuan University, Chengdu, Sichuan, 610064 P.R. China
A novel, sensitive method is described for the accurate determination of Ni, Se, and Fe in biological tissues by isotope dilution inductively coupled plasma mass spec-trometry (ID ICPMS) based on sample introduction arising from online UV photochemical vapor generation (UV-PVG). Volatile species of Ni, Se, and Fe were liberated from a formic acid medium following exposure to a UV source. Sensitivities were enhanced 27- to 355-fold compared to those obtained using pneumatic nebulization sample introduction. Although precision was slightly degraded (a factor of 2) with ultraviolet photochemical mediated vapor generation (UV-PVG), limits of detection (LODs) of 0.18, 1.7, and 1.0 pg g-1for Ni, Se, and Fe,
respectively, based on an external calibration, provided 28-, 150-, and 29-fold improvements over that realized with conventional pneumatic solution nebulization. Method validation was demonstrated by determination of Ni, Se, and Fe in biological tissue certified reference materials (CRMs) TORT-2 and DORM-3. Concentra-tions of 2.33 ( 0.03, 5.80 ( 0.28, and 109 ( 2 µg g-1(1SD,n ) 4) and 1.31 ( 0.04, 3.35 ( 0.18, and
353 ( 5 µg g-1 (1SD, n ) 4) for Ni, Se, and Fe,
respectively were obtained in TORT-2 and DORM-3, in good agreement with certified values.
Following its commercial availability in 1983, use of inductively coupled plasma mass spectrometry (ICPMS) has increased exponentially, with applications spanning such diverse fields as nanotechnology, human health, environmental sciences, and geosciences.1Delivery of rapid multielement data combined with
isotope specific information, minimal interferences, and excellent detection power has provided this technique with unparalleled performance for the determination of the majority of elements across the Periodic Table at trace and ultratrace concentrations. Despite such attributes, as with the majority of atomic spectro-scopic techniques, sample introduction remains a frequent impedi-ment to optimum performance.2 Correspondingly, ICPMS has
been coupled with a variety of sample introduction techniques,
including gas chromatography, laser ablation, electrothermal vaporization, and vapor generation. These alternative approaches are often used to avoid or alleviate difficult sample preparation processes and spectral or matrix interferences or further enhance sensitivity and detection power by increasing sample introduction efficiency beyond the typical 2-5% associated with conventional pneumatic solution nebulization.
Among these, vapor generation may be considered the most mature in that it has had a long historical association with atomic spectroscopy, starting with the pioneering work of Holak who, 40 years ago, used Zn/HCl to generate volatile AsH3for detection
by atomic absorption spectrometry.3 Although, shortly after
this, the more modern usage of sodium tetrahydroborate for hydride generation (HG) was introduced by Braman4for this
purpose, there remains today a number of serious impediments to the further evolution of this conventional HG system,5
including blank limited detection limits arising from contamina-tion from the NaBH4reagent, the instability of its solutions,
interferences from transition and noble metals, limited ap-plicable concentration range and limited element scope, non-uniform response from different species of a given element, slow reaction rates, and generation of new isobaric interfer-ences as HCl is the most frequently used acidic medium (e.g.,
75ArCl+interferes with monoisotopic75As).
As a consequence of the above, vapor generation of trace metals remains a fascinating topic, with recent successes in expanding the scope of elemental coverage6and the introduction
of ultraviolet photochemical mediated vapor generation (UV-PVG), a promising new technique for generation of volatile species of a number of elements, including mercury7-11and the conventional
hydride forming elements12-16as well as iodine,17iron,18nickel,19,20
* Corresponding author. E-mail: Lu.Yang@nrc-cnrc.gc.ca (L.Y.); houxd@ scu.edu.cn (X.H.).
†National Research Council Canada. ‡
Sichuan University.
(1) Hill, S. Inductively Coupled Plasma Spectrometry and its Applications, 2nd ed.; Blackwell Publishing: Oxford, UK, 2007, pp 98-121.
(2) Browner, R. F.; Boorn, A. W. Anal. Chem. 1984, 56, 875A–888A.
(3) Holak, W. Anal. Chem. 1969, 41, 1712–1713. (4) Braman, R. S. Anal. Chem. 1971, 43, 1462–1467. (5) D’Ulivo, A. Spectrochim. Acta, Part B 2004, 59, 793–825. (6) Sturgeon, R. E.; Mester, Z. Appl. Spectrosc. 2002, 56, 202A–213A. (7) Zheng, C. B.; Li, Y.; He, Y. H.; Ma, Q.; Hou, X. D. J. Anal. At. Spectrom.
2005, 20, 746–750.
(8) Yin, Y. M.; Liang, J.; Yang, L. M.; Wang, Q. Q. J. Anal. At. Spectrom. 2007,
22, 330–334.
(9) Yin, Y. G.; Liu, J. F.; He, B.; Gao, E. L.; Jiang, G. B. J. Anal. At. Spectrom.
2007, 22, 822–826.
(10) Bendl, R. F.; Madden, J. T.; Regan, A. L.; Fitzgerald, N. Talanta 2006, 68, 1366–1370.
(11) Vieira, M. A.; Ribeiro, A. S.; Curtius, A. J.; Sturgeon, R. E. Anal. Bioanal.
Chem.2007, 837–847.
(12) Guo, X. M.; Sturgeon, R. E.; Mester, Z.; Gardner, G. J. Appl. Organomet.
Chem.2003, 17, 575–579.
Anal. Chem. 2010, 82, 3899–3904
Co,21 and several other transition and noble metals.22 This
technique retains the principle advantages of conventional chemi-cal VG but further provides for simpler reactions, expanded elemental coverage, greener analytical chemistry, and cost-effectiveness.
Despite increased interest in UV-PVG over the past several years,23applications to real sample analyses remain limited. The
purpose of this work was to explore the further potential advantages of PVG as a sample introduction technique when coupled with the high accuracy and precision offered by quanti-tation using isotope dilution mass spectrometry (ID-MS). ID-MS is considered to be a primary ratio method of the highest metrological quality24for trace analysis. Calibration techniques
based on ID provide for enhanced accuracy and precision because, among other features, a ratio, rather than an absolute intensity measurement, is used for quantitation of analyte concentration.25
To our knowledge, this is the first report of use of UV-PVG coupled with ID-MS for quantitative analysis. The determination of Ni, Se, and Fe, in particular, serves as an example of applications requiring high detection power (for Se) and minimization of isobaric interferences (for Fe and Se), as well as highlights the novel capability of achieving highly efficient vapor generation of transition metals (Fe and Ni). In this regard, the expansion of UV-PVG as a viable sample introduction technique becomes firmly established.
EXPERIMENTAL SECTION
Instrumentation. A Perkin-Elmer SCIEX (Thornhill, Ontario,
Canada) ELAN6000 ICPMS fitted with a quartz torch and alumina sample injector tube was used. The instrument was equipped with a Gem Tip cross-flow nebulizer and a corrosion resistant double pass Rytons spray chamber mounted outside the torch box and maintained at room temperature. Optimization of the ELAN6000 was performed as recommended by the manufacturer; figures of merit for sample introduction performed in this mode were compared with those obtained using vapor generation sample introduction. Optimization of detection conditions for vapor generation were undertaken independently. Operating condi-tions are summarized in Table 1. Cold plasma condicondi-tions were used for detection of Fe with both modes of sample introduction.
A Milestone Inc. (Shelton, CT) Ethos EZ Microwave Labstation was used for closed vessel high pressure sample dissolution. Evaporation of samples was conducted with a Digiprep Jr block heater (SCP Science, Quebec, Canada).
A schematic of the UV-PVG system interfaced to the ICPMS is shown in Figure 1. The photoreactor consisted of a 17 W low pressure mercury grid lamp (Analamp, Anaheim, CA) fitted with a 5 mL internal volume quartz tube (25 cm × 2.5 mm i.d. approximately 1.5 m in length) fashioned to overlay the grid pattern so as to provide maximum exposure of the sample solution to the most intense discharge regions of the lamp. For conven-ience of operation, the photoreactor was then enclosed in aluminum foil to both protect the operator from exposure to UV and minimize ozone formation. For this purpose, a continuous 2 L min-1flow of Ar was introduced to the reactor; this had the
added benefit of also helping to regulate the temperature. Once pumped through the reactor, the irradiated sample solution was then directed to a tandem set of two gas-liquid separators (GLS). The Ar sample gas channel from the ELAN6000 served as the carrier gas for the UV-PVG system and was connected to the inlet of the first GLS (taken from a Tekran Instruments Series 2600 automated water analysis system, Toronto, Canada) followed by a subsequent smaller GLS (10 mL volume) maintained at 0 °C by immersion in an ice bath to ensure that no liquid droplets derived from condensation of water vapor were transported to the ICP. The generated analyte vapors were directed from the outlet of the second GLS to the ICPMS via a 0.5 m length of Teflon lined Tygon tubing (0.25 in o.d.) to a gas introduction adaptor mounted on the torch holder.
A miniplus 2 peristaltic pump (Gilson, Middleton, WI) provided sample solution flow rates of 4.5 and 2.5 mL min-1for operation
with the hot and cold plasmas, respectively.
Reagents and Solutions. Nitric acid was purified in-house
prior to use by sub-boiling distillation of reagent grade feedstock in a quartz still. High purity deionized water (DIW) was obtained from a NanoPure mixed bed ion exchange system fed with reverse osmosis domestic feedwater (Barnstead/Thermolyne Corp, Iowa). High purity formic acid (88%) was obtained from GFS Chemicals Inc. (Powell, OH). Environmental grade ammonia (20-22%, v/v) and hydrogen peroxide were purchased from Anachemia Science (Montreal, Canada).
(13) Guo, X. M.; Sturgeon, R. E.; Mester, Z.; Gardner, G. J. Anal. Chem. 2003,
75, 2092–2099.
(14) Wang, Q. Q.; Liang, J.; Qiu, J. H.; Huang, B. L. J. Anal. At. Spectrom. 2004,
19, 715–716.
(15) Sun, Y. C.; Chang, Y. C.; Su, C. K. Anal. Chem. 2006, 78, 2640–2645. (16) McSheehy, S.; Guo, X.; Sturgeon, R. E.; Mester, Z. J. Anal. At. Spectrom.
2005, 20, 709–716.
(17) Grinberg, P.; Sturgeon, R. E. Spectrochim. Acta, Part B 2009, 64, 235– 241.
(18) Zheng, C. B.; Sturgeon, R. E.; Brophy, C. S.; He, S. P.; Hou, X. D. Anal.
Chem.2010, 82, 2996-3001.
(19) Zheng, C. B.; Sturgeon, R. E.; Hou, X. D. J. Anal. At. Spectrom. 2009, 24, 1452–1458.
(20) Guo, X. M.; Sturgeon, R. E.; Mester, Z.; Gardner, G. J. Appl. Organomet.
Chem.2004, 18, 205–211.
(21) Grinberg, P.; Mester, Z.; Sturgeon, R. E.; Ferretti, A. J. Anal. At. Spectrom.
2008, 23, 583–587.
(22) Guo, X. M.; Sturgeon, R. E.; Mester, Z.; Gardner, G. J. Anal. Chem. 2004,
76, 2401–2405.
(23) He, Y.; Hou, X.; Zheng, C.; Sturgeon, R. E. Anal. Bioanal. Chem. 2007,
388, 769–774.
(24) Quinn, T. J. Metrologia 1997, 34, 61–65.
(25) Heumann, K. G. Mass Spectrom. Rev. 1992, 60, 41–67.
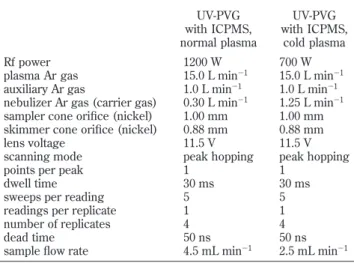
Table 1. Experimental Conditions UV-PVG with ICPMS, normal plasma UV-PVG with ICPMS, cold plasma Rf power 1200 W 700 W
plasma Ar gas 15.0 L min-1 15.0 L min-1
auxiliary Ar gas 1.0 L min-1 1.0 L min-1
nebulizer Ar gas (carrier gas) 0.30 L min-1 1.25 L min-1
sampler cone orifice (nickel) 1.00 mm 1.00 mm skimmer cone orifice (nickel) 0.88 mm 0.88 mm
lens voltage 11.5 V 11.5 V
scanning mode peak hopping peak hopping
points per peak 1 1
dwell time 30 ms 30 ms
sweeps per reading 5 5
readings per replicate 1 1
number of replicates 4 4
dead time 50 ns 50 ns
sample flow rate 4.5 mL min-1 2.5 mL min-1
Natural abundance Ni, Fe, and Se stock solutions of 2000 µg g-1were prepared by dissolution of 0.2 g masses of the high
purity metals (Johnson, Matthey & Co. Limited, London, UK) in a few milliliters of HNO3. Working standards containing
12.75, 22.98, and 21.16 µg g-1for Ni, Fe, and Se, respectively,
were used for reverse spike isotope dilution of enriched spike solutions and were prepared by dilution of the stock with DIW containing 2% HNO3.
Enriched isotopes (as metals or oxides with an isotopic enrichment >88%) were purchased from the Oak Ridge National Laboratory. Enriched stock solutions were prepared by dissolution of metals or oxides in HCl or HNO3. Working spike solutions of
2.33, 55, and 2.3 µg g-1for 61Ni,57Fe, and82Se, respectively,
were prepared by dilution with 2% HNO3 solution. National
Research Council Canada (NRCC, Ottawa, Canada) biological tissue CRMs TORT-2 (lobster hepatopancreas) and DORM-3 (dogfish muscle) were used for method validation.
Sample Preparation and Analysis Procedure. Sample
preparation was undertaken in a class-100 clean room. For determination of Ni, Fe, and Se in TORT-2 and DORM-3, 0.25 g subsamples of each CRM were weighed into precleaned Teflon vessels. Appropriate amounts of enriched spikes (resulting in ratios of60Ni/61Ni,56Fe/57Fe, and78Se/82Se near 1 for the final
solution), 8 mL of HNO3, and 0.5 mL of H2O2were then added.
Three sample blanks (spiked with 10% of the amount of enriched spikes used in the samples) were processed along with samples. The sealed vessels were heated in a Milestone microwave oven operated under the following conditions: 10 min at 50 °C and 500 W; 10 min at 140 °C and 500 W; 15 min at 180 °C and 550 W, and 30 min at 210 °C and 600 W. After cooling, the caps were removed and the digests were trans-ferred to precleaned 50 mL volume polyethylene tubes and evaporated in a block heater at 85 °C to about 1.5 mL. A 0.50 mL aliquot of each digest was then pipetted into clean 30 mL plastic bottles and diluted to 25 mL with 15% (v/v) formic acid for determination of Se. The remaining digests were further evaporated at 85 °C to dryness to remove all HNO3 which
reduces vapor generation efficiencies for Ni and Fe.18,19The
final residues were treated with 7.5 mL of formic acid, heated at 85 °C for 15 min, and diluted to 50 mL with DIW for determination of Ni. For determination of Fe, 10 mL aliquots of the above solution
were pipetted into clean 50 mL vials, to which 33.5 mL of concen-trated high purity formic acid were added. Following addition of 15 mL of aqueous ammonia to each vial, the contents were diluted to 50 mL with DIW, resulting in a final concentration of 60% (v/v) formic acid and a pH of 3 prior to online UV-PVG ICPMS.
For reverse ID, four replicate solutions were prepared by accurately weighing 0.1 g of each spike solution used for the samples into precleaned polyethylene screw-capped bottles to which known masses of natural abundance Ni, Fe, and Se standard solutions were added to result in ratios of60Ni/61Ni,56Fe/57Fe,
and 78Se/82Se near 1. For measurement of Ni and Se, the
contents of each bottle were diluted to 100 mL with 15% (v/v) formic acid. For measurement of Fe, 10 mL of the reverse ID solution was pipetted into a clean 50 mL vial and subsequently treated in the same manner as described above for digests of the biological samples, resulting in a solution containing 60% formic acid at pH 3.
The samples and four reverse spike ID calibration samples were subjected to online UV-PVG with ID ICPMS detection on the same day in an effort to achieve optimum results. Intensities measured from a 15% formic acid solution of Ni and Se and a 60% formic acid solution of Fe at pH 3 were subtracted from all samples for determination of isotope ratios. Mass bias correction was implemented on the basis of the IUPAC natural abundance ratios for60Ni/61Ni,56Fe/57Fe, and78Se/82Se divided by their mean
value determined in the natural abundance standards.
Safety considerations: Nickel tetracarbonyl, iron pentacarbonyl,
and selenium carbonyl and selenium hydride produced by PVG are toxic. Proper ventilation and personal protective equipment should be employed for all manipulations.
RESULTS AND DISCUSSION
Optimization of UV-PVG for ICPMS Detection: Hot Plasma Conditions. Nickel and Se were determined under normal plasma
conditions. Optimization of the ELAN6000 was first performed as recommended by the manufacturer using the standard liquid sample introduction system. The plasma was then extinguished, and the spray chamber and nebulizer assembly was replaced with the transfer line and its adaptor for online UV-PVG. The final optimization of ELAN6000 lens voltage and rf power for dry plasma conditions was quickly performed by monitoring the analyte Figure 1. Schematic of online UV-PVG ICPMS system.
intensities at60Ni and78Se using a 1 ng g-1solution of standard
in 15% formic acid. A lens voltage of 11.5 V and rf forward power of 1250 W were selected for the final measurements to maintain relatively high sensitivities for both elements.
The argon carrier gas flow rate through the GLS, which also served as the sample gas for the plasma, the formic acid concentration, and the sample flow rate through the UV-PVG system, comprised the three basic parameters which determined analyte generation and transport efficiency to the ICPMS. The effect of Ar carrier gas flow rate is presented in Figure 2a. Optimum sensitivities were obtained for Ni and Se at flow rates of 0.28-0.30 and 0.28-0.32 L min-1, respectively. Sensitivities decreased at both
lower and higher values, a consequence of the convolved effects of optimal depth of sampling in the plasma, analyte gas/liquid partitioning efficiency, and dilution. A compromise of 0.30 L min-1
was chosen for all subsequent measurements.
The effect of formic acid concentration on response from Se and Ni is shown in Figure 2b. Optimum sensitivity is obtained for Se at a formic acid concentration of 15% whereas that for Ni continues to increase over the tested range. A formic acid concentration of 15% was selected for all subsequent measurements in order to obtain best response for Se, considering that this was the analyte likely present at the lowest concentrations in the test samples.
The effect of sample introduction flow rate in the range of 3-5.5 mL min-1was investigated, as shown in Figure 2c. This
parameter primarily determines the residence time of the solution in the PVG reactor and the efficiency of the radical induced generation reaction. Optimum sensitivity is obtained for Ni at a flow rate of 4.5 mL min-1with response decreasing at both lower and
higher values whereas for Se this parameter had little effect on response over the tested range. The kinetics of alkylation and/or carbonylation of Se and carbonylation of Ni are different, with that for generation of Ni(CO)4being significantly slower.19A flow rate
of 4.5 mL min-1was selected for all subsequent measurements.
Optimization of UV-PVG System with ICPMS: Cold Plasma Conditions. Interference from40Ar16O+on the major56Fe isotope
prohibited its use for determination of trace Fe under normal plasma conditions; Fe was, thus, determined using a “cold plasma”. Optimization of the ELAN6000 for cold plasma conditions was first performed using pneumatic nebulization of a 5 ng g-1solution of a Co standard in 2% HNO
3. The x-y
position, rf power, lens voltage, and sample gas flow rate were varied to achieve optimum sensitivity for 59Co+ and lowest
intensity for40Ar16O+. The plasma was then extinguished, and
the spray chamber and nebulizer assembly was replaced with the transfer line and its adaptor for online UV-PVG. Final optimization of Ar carrier gas for dry, cold plasma conditions was quickly performed by monitoring the intensities at59Co+
and40Ar16O+using a 5 ng g-1solution of Co standard in 15%
formic acid to obtain the highest sensitivity for59Co+and lowest
response at40Ar16O+. Although the vapor generation efficiency
for Co was very low, the signal intensity was adequate for optimization. The final operating conditions for the dry, cold plasma are presented in Table 1.
Earlier studies18have shown that the pH of the sample solution
has a significant effect on the UV-PVG efficiency for Fe; thus, the effects of formic acid concentration, pH, and sample flow rate on response were investigated. As shown in Figure 3a, optimum sensitivity was obtained in a range of 60-80% (v/v) formic acid; a concentration of 60% was selected for subsequent measurements. The effect of sample pH is presented in Figure 3b, from which it is evident that a pH (adjusted with either aqueous ammonia or NaOH) in the range of 2.5-4 is optimal, in agreement with earlier findings.18A pH of 3 was selected for subsequent measurements.
The influence of sample flow on Fe response is shown in Figure 3c; optimum sensitivity is obtained at 2.1 mL min-1, with intensity
decreasing at both lower and higher flows. This reflects the balance between the lower flux of analyte atoms available for Figure 2. Effect of carrier gas flow, formic acid concentration, and sample flow rate on response from 1 ng/g solutions of (a) 15% formic acid and 4.5 mL min-1sample flow rate; (b) 0.30 L min-1Ar gas flow and 4.5 mL min-1sample flow rate; (c) 0.30 L min-1Ar gas flow and 15% formic
acid: 9,60Ni; 2,78Se.
reaction at low flow rates coupled with both the reduced solution residence time in the reactor limiting generation efficiency of the volatile product and the efficiency of its subsequent gas-liquid separation. This is noticeable consider-ing the observation that the signal intensity decreases faster than the simple decrease in residence (irradiation) time in the reactor as the flow rate increases. A flow rate of 2.5 mL min-1
was selected for all subsequent measurements in an effort to provide good sensitivity for Fe coupled with a relatively shorter time for sample uptake and rinsing.
Analytical Performance. The analytical performance of online
UV-PVG ICPMS was compared to that for conventional pneumatic introduction of liquid samples from the viewpoint of limit of detection (LOD, based on an external calibration), sensitivity, and precision. Standard solutions of 5 ng g-1for Ni and Se and 25
ng g-1for Fe in 2% HNO
3or 15% formic acid for Ni and Se and
60% formic acid at pH 3 for Fe matrixes, respectively, were characterized under two conditions. Sample introduction with pneumatic nebulization was performed at 1 mL min-1. Data
are summarized in Table 2. Significant improvements are notable: 27-, 355-, and 34-fold enhancements in sensitivity were obtained for60Ni, 78Se, and56Fe, respectively, using vapor generation
compared to that using pneumatic liquid introduction. Sub-stantial improvements of 28-, 150-, and 29-fold in LOD are evident for60Ni,78Se, and56Fe, respectively, using online
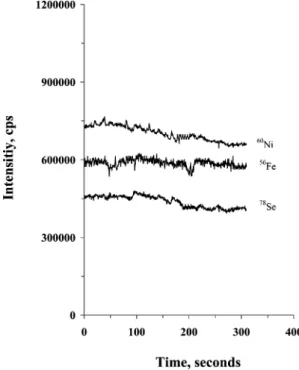
UV-PVG, making the present technique suitable for ultratrace determination of these metals in environmental samples. As evident from Figure 4 and summarized in Table 2, relatively stable steady-state signals can be obtained with vapor generation sample introduction, yielding precisions (expressed as RSD) of 2.9-3.4%. These are about 2- to 3-fold poorer than those obtained using solution nebulization, which may be considered as the “gold standard” for comparison. It is anticipated that physical improve-ments to the PVG generator, currently in progress, will lead to enhancements in this figure of merit. These performance en-hancements can be realized for several reasons, foremost being the high efficiency of vapor generation and sample introduction compared to pneumatic nebulization. On the basis of the enhance-ments in sensitivity and accounting for the differences in sample introduction rates, efficiencies on the order of 40 and 30% are estimated for Ni and Fe (assuming a 2% efficiency for the standard nebulizer-spray chamber configuration). For Se, an estimate of the possible effect of the presence of excess carbon in the plasma leading to resonance enhanced ionization needs to be accounted for. Drawing from an enhancement factor of 6, presented in the study by Gammelgaard and Jons,26yields a generation efficiency
of 26%. These estimates are in reasonable agreement with those presented in earlier studies13,18,19 when accounting for the
compromise conditions used herein. Additionally, the higher (26) Gammelgaard, B.; Jons, O. J. Anal. At. Spectrom. 1999, 14, 867–874. Figure 3. Effect of formic acid concentration, pH, and sample flow rate on56Fe response from 25 ng g-1solutions of Fe. (a) pH 2.0 and 2.5
mL min-1sample flow rate; (b) 60% formic acid and 2.5 mL min-1sample flow rate; (c): pH 3.0 and 60% formic acid.
Table 2. Figures of Merit
direct ICPMS detection online UV-PVG ICPMS detection enhancement factor
60Ni sensitivity (cps/ng g-1) 6600 180000 27 78Se sensitivity (cps/ng g-1) 230 82000 355 56Fe sensitivity (cps/ng g-1) 700 24000 34 60Ni: LOD 5 pg g-1 0.18 pg g-1 28 78Se: LOD 260 pg g-1 1.7 pg g-1 150 56Fe: LOD 29 pg g-1 1.0 pg g-1 29 precision:60Ni (@5 ng g-1Ni, n ) 5, 1SD), % RSD 1.2 2.9 0.41 precision:78Se (@5 ng g-1Se, n ) 5, 1SD), % RSD 1.7 3.1 0.50 precision:56Fe (@25 ng g-1Fe, n ) 5, 1SD) % RSD 1.5 3.4 0.44
sample flow rate used for PVG enhances the flux of analyte vapor to the plasma. Finally, the comparatively dry plasma conditions arising with PVG sample introduction may provide for higher analyte ionization efficiencies, leading to enhanced sensitivities. Lastly, the presence of carbon in the plasma due to photolysis of the formic acid may provide for selective enhancement in the degree of ionization of Se.26
Sample throughput for the current system is relatively low, primarily as a consequence of the residence time needed for photochemical conversion of the ionic analytes to their alkylated/ carbonylated volatile species. The internal volume of the quartz reactor is approximately 5 mL, with the result that a 60 s irradiation time was used under optimum conditions for Ni and Se whereas a 2 min exposure was required for Fe. With the need to both rinse the internal volume of the reactor prior to introduction of the next sample and pump for a sufficient period of time to obtain equilibration of the response, the overall sample processing time was approximately 7 min (2.5 min with direct liquid introduction), providing a throughput of 8 samples per hour.
Quantitation of Ni, Fe, and Se in TORT-2 and DORM-3.
Determination of Ni, Fe, and Se in biological samples was undertaken using ID (with reverse ID calibration). The following equation was used for the quantitation of Ni, Fe, and Se in TORT-2 and DORM-3:27 C ) Cz· my w · mx· mz my′· Ay- By· Rn Bxz· Rn- Axz· Bxz· Rn′- Axz Ay- By· Rn′ - Cb (1) where C is the blank corrected concentration (µg g-1) of analyte
in the sample; Czis the concentration (µg g-1) of primary assay
standard; myis the mass (g) of spike used to prepare the blend
solution of sample and spike; mx is the mass (g) of sample
used; w is dry mass correction factor; mzis the mass (g) of
primary assay standard; my′ is the mass (g) of spike used to
prepare the blend solution of spike and primary assay standard solution for reverse ID; Ayis the abundance of the reference
isotope in the spike; Byis the abundance of the spike isotope
in the spike; Axzis the abundance of the reference isotope in
the sample or primary assay standard; Bxzis the abundance of
the spike isotope in the sample or primary assay standard; Rn
is the measured reference/spike isotope ratio (mass bias corrected) in the blend solution of sample and spike; Rn′is the
measured reference/spike isotope ratio (mass bias corrected) in the blend solution of spike and primary assay standard, and Cb
is the analyte concentration (µg g-1) in the blank normalized to
sample mass mxand is obtained using the first term in eq 1.
Ratios of60Ni/61Ni, 56Fe/57Fe, and 78Se/82Se measured in
unspiked TORT-2 and DORM-3 agreed with expected natural abundance values for these ratios, confirming the absence of detectable polyatomic interferences of 44Ca16O+, 25 Mg35Cl+, 23Na37Cl+, 24 Mg37Cl+, 45Sc16O+, 40Ar16O+, 40Ca16O+, 41K16O+, 40Ar16O1H+,40Ar38Ar+,41K37Cl+, and40Ar42Ca+on60Ni,61Ni,56Fe, 57Fe,78Se, and82Se isotopes arising from sample matrixes when
UV-PVG was used. Ni, Se, and Fe concentrations of 2.33 ± 0.03, 5.80 ± 0.28, and 109 ± 2 µg g-1(1SD, n ) 4) and 1.31 ± 0.04,
3.35 ± 0.18, and 353 ± 5 µg g-1(1SD, n ) 4) were obtained in
TORT-2 and DORM-3, respectively, in good agreement with certified values of 2.50 ± 0.19, 5.63 ± 0.67, and 105 ± 13 µg g-1
(U, k ) 2) and 1.28 ± 0.24, 3.3 (information value) and 347 ± 20 µg g-1(U, k ) 2), respectively. Precisions of 1.3, 4.9, and
2.2% RSD and of 3.1, 5.4, and 1.5% RSD for Ni, Se, and Fe were obtained in TORT-2 and DORM-3, respectively.
Method LODs using ID, evaluated from procedural blanks, and normalized to a nominal test mass of 0.25 g of sample were calculated to be 0.005, 0.031, and 0.027 µg g-1for Ni, Se, and Fe, respectively,
providing about 10-fold improvements over that realized with conventional pneumatic solution nebulization for ID calibration. CONCLUSION
A novel and sensitive approach to the determination of Ni, Se, and Fe has been validated using online UV-PVG for sample introduction with ICPMS. Compared to pneumatic sample intro-duction, significant enhancements in sensitivities ranging from 27- to 355-fold were realized coupled to improvements in LODs of 28- to 150-fold for Ni, Se, and Fe. This is the first application incorporating online UV-PVG with ID calibration for detection by ICPMS. Sufficiently low detection limits (5-31 ng g-1, normalized
to 0.25 g of dry sample weight) are well-suited for quantitation of these metals in environmental samples.
ACKNOWLEDGMENT
C.B.Z. and X.D.H. thank the National Natural Science Founda-tion of China (Grant Nos. 20835003 and 20805032) and NRCC for financial support for C.B.Z. while in Canada.
Received for review February 17, 2010. Accepted March 23, 2010.
AC1004376 (27) Yang, L.; Sturgeon, R. E. J. Anal. At. Spectrom. 2009, 24, 1327–1335.
Figure 4. Steady-state responses from60Ni,78Se, and56Fe using a
5 ng g-1solution for Ni and Se and a 25 ng g-1solution for Fe under
optimized experimental conditions: 15% formic acid for Ni and Se and 60% formic acid at pH 3 for Fe, respectively.