MITLibraries
Document Services Ph: 617.253.5668 Fax: 617.253.1690 Email: [email protected] http://libraries.mit.edu/docsDISCLAIMER OF QUALITY
Due to the condition of the original material, there are unavoidable
flaws in this reproduction. We have made every effort possible to
provide you with the best copy available. If you are dissatisfied with
this product and find it unusable, please contact Document Services as
soon as possible.
Thank you.
Some pages in the original document contain pictures,
graphics, or text that is illegible.
ACOUSTIC RESPONSES FROM PRIMARY VESTIBULAR NEURONS by
Michael Patrick McCue
B.S.E.E, Massachusetts Institute of Technology (1981)
M.S.E.E., Massachusetts Institute of Technology (1983)
M.D., Harvard Medical School (1993)
SUBMITtED TO THE HARVARD/M.I.T. DIVISION OF HEALTH SCIENCES & TECHNOLOGY
IN PARTIAL FULFILLMENT OF THE REQUIREMENTS FOR THE DEGREE OF
DOCTOR OF SCIENCE at the
MASSACHUSETTS INSTITUTE OF TECHNOLOGY
SEPTEMBER 1993
©
Massachusetts Institute of TechnologySignature of Author
H!•v~igio f t Hrxdh nces & Technology
Certified by-;, John J. Guinan, Jr. Thesis Supervisor Accepted by MASSACHUSETTS INSTITUTE OF TFrHNOLOGY
JUN 2 5 1993
LIBRARIES Roger G. Mark Co-Director Division of Health Sciences & Technologyf f · i f I
f
-3-ACOUSTIC RESPONSES FROM PRIMARY VESTIBULAR NEURONS
by
Michael Patrick McCue
Submitted to the Harvard/M.I.T. Division of Health Sciences & Technology on June 23, 1993 in partial fulfillment of the requirements for the
Degree of Doctor Of Science
ABSTRACT
Mammals have evolved an inner ear with six different sense organs - a cochlea for detecting sound, three semi-circular canals for detecting rotation, and two otolith (Gr. ear rock) organs for detecting linear accelerations. The cochlea is a beautiful, coiled structure which imparts an esthetic, labyrinthine quality to the mammalian inner ear, but it is a relatively late evolutionary development. Fish lack cochleas and hear sounds adequately
using one of their otolith organs, the saccule. Intermediate vertebrates, such as toads, also lack true cochleas and continue to rely on the saccule for some aspects of hearing.
In this thesis, I address the question of whether or not the vertebrate line completely abandoned the saccule as a hearing organ after the introduction of the mammalian cochlea. Afferent fibers in the cat's vestibular nerve were recorded from and found to be acoustically responsive. These neurons were labeled intracellulary and found to project to the saccule. Stimulation of the vestibular efferent system produced a complex excitation of these fibers and a concomitant amplification of their acoustic responses.
These experiments demonstrate that the mammalian saccule retains at least one class of neurons which continues to respond to sounds within the normal range of human hearing. I discuss some possible auditory roles which these neurons may continue to play. As a possible phylogenetic precursor of the cochlear hearing mechanism, the saccular auditory pathway may provide insights into remaining mysteries of cochlear function, particularly with regard to the brain's (efferent) control of the peripheral auditory apparatus.
Thesis Supervisor: Dr. John J. Guinan, Jr.
Title: Associate Professor of Otology & Laryngology, Harvard Medical School
This thesis is dedicated to my friend, Robert Mayer Brown
(1927-1989)
He might not have read it, but he would definitely have found out
whether or not it was a good job.
-5-ACKNOWLEDGMENTS Administrative Support Susan Beckvold Dianna Sands Advice Joe Adams Alice Berglund M. Christian Brown M. Charles Liberman Edmund A. Mroz William F. Sewell
Engineering (Net Positive Input) Robert M. Brown Frank Cardarelli Mark Curby Debra Louisson Michael Ravicz Fiber Reconstruction Barbara E. Norris Financial Support Fairchild Foundation Fulbright Commission Johnson & Johnson Co.
Kleberg Foundation Metropolitan Life Insurance Co.
National Institutes of Health
Histology Inge Knudson Leslie Dodds Liberman
Barbara E. Norris Indescribable Help
Robert M. Brown Jennifer Lee Carrell
John J. Guinan, Jr. Nelson Y.S. Kiang Barbara E. Norris Helen Peake William T. Peake Surgical Assistance Monique Bourgeois Kerstin Jacob Inge Knudson Leslie Dodds Liberman
Tracy Liu Michelle Prince Karen Whitley Thesis Committe David P. Corey John J. Guinan, Jr. William T. Peake
NOTE ON ORGANIZATION
This thesis was written as four independent manuscripts which have been unnaturally joined as "chapters" in the final document. Each paper was written in close collaboration with my thesis advisor, John J. Guinan, Jr., and hence reflects our joint thinking. Dr. Guinan is the implicit co-author when I make use of the first-person plural pronoun.
Note that figures in each "chapter" are sequentially numbered starting at 1 and appended to the end of the chapter. Figure references in the text to do not cross chapter boundaries.
7 -TABLE OF CONTENTS Title Page ... 1 Frontispiece. ... 2 Abstract... 3 Dedication... 4 Acknowledgments . ...5 Note on Organization ... 6 Table of Conten ...ts 7 Chapters I. Acoustically Responsive Neurons in the Vestibular Nerve of the Cat ... 8
II. Tuning: Implications for Mammalian Hearing Mechanisms . ... 34
III. Spontaneous Activity ... 53
IV. Influence of Efferent Stimulation ... 66
Tools. ... 92
I. ACOUSTICALLY-RESPONSIVE NEURONS IN THE VESTIBULAR NERVE OF THE CAT
I. INTRODUCTION
The vertebrate inner ear contains several sense organs involved in the maintenance of equilibrium and the detection of vibration. The precise sensory role assumed by homologous organs varies among species. For example, the saccule is thought to act as a linear accelerometer in mammals (Fernmndez & Goldberg, 1976a-c) but is responsive to sound in certain amphibians (Moffat & Capranica, 1976; Lewis et al., 1982), fishes (Popper & Fay,
1973; Saidel & Popper, 1983) and rays (Lowenstein & Roberts, 1951).
Whether or not any of the mammalian vestibular organs plays a role in normal hearing is an open question that hinges on two factors - acoustic sensitivity of the receptors and central processing of their outputs. The normal acoustic sensitivity of the vestibular receptors has been controversial. In a previous study in squirrel monkeys (Young et al., 1977), primary vestibular afferents were found to synchronize to intense air-borne vibrations in the audio-frequency range, but increases in mean discharge rate were not observed in most units until the sound reached levels associated with rapid cochlear damage (>120 dB SPL). This study, which demonstrated acoustic responsiveness yet emphasized high thresholds, has been cited as evidence both for (Cazals et al., 1980) and against (Kevetter & Perachio, 1989) a hearing role for the mammalian vestibular system.
Even if vestibular nerve fibers were to respond to sound, the signals they carried might be of no benefit (and potentially of some harm) if they were not processed centrally as auditory information. The possibility that the vestibular receptors are involved in auditory processing has thus been strengthened by recent demonstrations that primary vestibular afferents send projections into the auditory brain stem (cochlear nucleus) in mammals (Burian & Gstoettner, 1988; Kevetter & Perachio, 1989).
We have recently found a class of primary vestibular neurons in cats which could involve the vestibular receptors in normal hearing. We present here anatomical and physiological evidence thate indicates that these neurons originate in the saccule, are activated by normal hair-cell stimulation at moderately high sound levels, and are excited by acoustic stimuli that reach the inner ear via normal middle-ear transmission. In this report, we report unit reponses to clicks and tones. A preliminary report of this work has been presented (McCue & Guinan, 1993).
-9-I. METHODS
Surgery. Treatment of experimental animals was in accordance with protocols approved by the Committees on Animal Care at the Massachusetts Institute of Technology and the Massachusetts Eye & Ear Infirmary. Adult cats were induced and maintained under anesthesia by intraperitoneal injection of diallylic barbiturate in urethane (Kiang et al., 1965). A tracheostomy was performed. The ear canals were surgically exposed and the auditory bullae were opened. In some cats, the bony septum between the bulla and middle-ear was removed and the tendons of the middle-ear muscles (stapedius and tensor tympani) were cut. A posterior fossa craniectomy was performed, and the cerebellum was aspirated laterally to expose the dorsal surface of the temporal bone. After reflection of the periosteum, the roof of the internal auditory meatus was drilled away with a dental burr to expose the junction of the inferior and superior vestibular nerves (Liberman & Brown, 1986). Extreme care was taken to maintain the structural integrity of the bony labyrinth.
Monitoring. Animals were placed in an electrically shielded and sound-proofed chamber (Ver et al., 1975). Rectal temperature was maintained between 36-39°C by adjustment of the chamber temperature. Pulse and respiration were continuously monitored and artificial ventilation was supplied when needed. Silver-wire electrodes were placed in contact with the cochlea near the round window and used to monitor cochlear thresholds. Cochlear threshold shifts were frequently noted after long periods of intense sound, but were not clearly associated with shifts in the acoustic response thresholds of vestibular neurons.
Sound Stimulation. Sound was delivered through metal acoustic assemblies sealed against each tympanic ring (Kiang et al., 1965). The sound source (1-in. condenser earphone, Bruel & Kjaer) was rigidly fixed to the metal acoustic assembly. A condenser microphone (1/4-in., Bruel & Kjaer) was attached to a small metal probe tube ending near the tympanic membrane, and was used to determine sound levels as a function of frequency. The maximum sound pressure level was 115 dB re: 0.0002 dynes/cm2 (sound pressure level or SPL).
Sound stimulation and neural recording were accomplished under computer control (Apple Macintosh Quadra 950) through two instrumentation buses (one GPIB, and one special-purpose bus connected via a high speed digital I/0 interface). Sound stimuli consisted of 800-Hz tone bursts (50 ms duration) or clicks. Tone burst voltage waveforms were generated by passing the output of a programmable oscillator (Hewlett-Packard 3325B) through an electronic switch (Wilsonics BSIT) with a shaped rise-fall time (2.5-ms cos2 shaped). Click voltage waveforms consisted of rectangular 100-Is pulses. Voltage
waveforms were delivered to the acoustic system through programmable attenuators and controlled by a programmable timing system (Brown Advanced Timing).
Analog Recording. Cochlear response waveforms recorded near the round-window were amplified and digitized at a sampling rate of 10 kHz (National Instruments NB-A2000).
Neural Recording. Single-unit activity was obtained by impaling peripheral nerve fibers with glass micro-pipettes filled with 2M KC1 (impedances 15-40 Mr2 in saline). A remotely controlled micro-drive (Kopf 607W) was used to advance the micro-electrode in 3-gm steps. All recordings were made in the region of the inferior vestibular nerve near its junction with the superior vestibular nerve (Fig. 1). Action potentials were amplified, band-pass filtered, and transformed to discrete pulses by a Schmitt trigger. Arrival times of stimulus markers, positive-going zero crossings of voltage waveforms, and spike pulses were measured with microsecond accuracy by a special-purpose event timer and periodically downloaded to the computer for the construction of arbitrary histograms.
Measurement Protocol. Spike discharges were fed to a speaker for audio monitoring. Units were detected by a drop in the recorded DC potential or the onset of spontaneous activity. When a new unit was detected, it was tested with an 800 Hz tone burst at 110 dB SPL. Units which displayed audible increases in discharge rate to this stimulus were classified as acoustically responsive and studied further with a relatively standard measurement protocol. First, an iso-response measurement ("tuning curve') was taken for frequencies between 50 kHz and 100 Hz (Chapter II), followed by a 20-sec measurement of background activity. Condensation clicks were then delivered at a rate of 10 clicks/sec (n = 500) at the maximal amplitude of the acoustic system. These were followed by an identical sequence of rarefaction clicks. Tone bursts (50 ms duration) were then delivered at a rate of 3 bursts/sec (n = 64) with an amplitude of 80 dB SPL. The tone-burst amplitude was then incremented by 5 or 10 dB and the tone burst sequence repeated until the sound level reached 110 dB SPL. Collection of a complete data set (all sound levels tested) required 7-10 minutes.
Injury discharges. Not infrequently, units displayed abnormal discharges (e.g. sudden increases in background activity) consistent with neural injury. This phenomenon has been previously associated with proximity of the cell body and recording electrode (Walsh et al., 1972). Injury discharges sometimes stopped spontaneously or after slight retraction of the electrode, thus allowing the unit to be studied further. In other cases, injury discharges led to bizarre waveforms or discharge patterns followed by loss of spike activity.
Occasionally, we obtained click responses during periods of minor injury discharge because we continued to find robust short-latency responses in the presence of elevated
- 1
-background activity. No measurements were made of tone burst responses during injury discharge.
Intracellular labeling. In 8 experiments, one or more neurons with intracellular DC potentials below -30 mV were injected intracellularly with buffered solution of 2% biocytin (containing 0.05M Tris, 0.45 M KCI) as described for horseradish peroxidase (Liberman & Oliver, 1984). Injection current waveforms were square waves (100 ms period; 50% duty cycle) with an amplitude of 2-7 nA for periods ranging from 1-8 mins. After a minimum 24 hour survival time, cats were perfused with 4% paraformaldehyde, the brain was removed en bloc with attached cranial nerves VII and VIII. In one case, the saccule was separately micro-dissected from the bony labyrinth. All tissue was embedded in gelatin and 80 gm sections were cut in the horizontal plane. Tissue sections were incubated overnight in avidin-horseradish peroxidase complex and then reacted with diaminobenzidine (Horikawa & Armstrong, 1988).
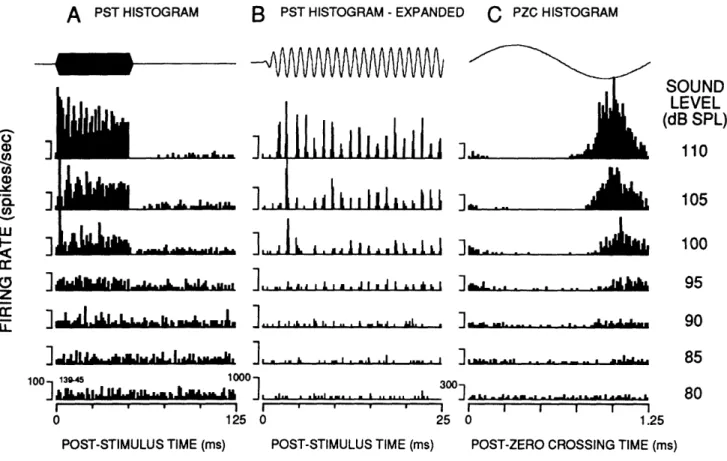
Analysis. Mean spike rates were calculated from post-stimulus time (PST) histograms over the 50-ms duration of the tone-burst stimulus (e.g. Fig. 6A). To quantify the tendency of a unit to synchronize to individual tone cycles, we first computed a post-zero crossing (PZC) histogram relating spike occurrences to positive-going zero crossings of earphone voltage (e.g. Fig. 6C). A Fast-Fourier Transform was computed from the PZC histogram (e.g. Fig. 6C) and a synchronization index was defined as the magnitude of the first (fundamental) Fourier component divided by the total number of spikes in the PZC histogram. The response phase was defined as the phase of the first Fourier component. The synchronization index (Goldberg & Brown, 1969; Johnson, 1980; Gifford & Guinan,
1983) ranges from zero (no synchronization) to one (all spikes in one bin).
I. RESULTS
Unit Location, Definition and Prevalence
Single-unit recordings were made in the inferior division of the vestibular nerve (Fig. 1), which carries nerve fibers supplying the saccule and posterior semicircular canal. The recording site is in the caudal portion of Scarpa's ganglion, which contains the cell bodies of primary vestibular afferent neurons. The site also directly overlies the cochlear nerve (Fig. 1) and is in close proximity to the vestibulo-cochlear anatomosis (Bundle of Oort), which carries cochlear efferent fibers. Typically, vestibular nerve fibers and cell bodies were found to be intermingled with cochlear efferent fibers in the superficial 0.5-1.0 mm of each electrode penetration. Deeper electrode penetrations usually entered the cochlear nerve and
resulted in abrupt transition to cochlear units with characteristic Poisson-like spontaneous activity and low-threshold acoustic responses (Kiang et al., 1965).
We defined a vestibular unit to be acoustically responsive if it increased its discharge rate in response to an 800 Hz tone burst at <115 dB SPL. Using this criterion, we have recorded 229 acoustically responsive units in the inferior vestibular nerves of 21 cats. Some of these observations were made in experiments focused on other issues, so that the total number of units does not adequately reflect their prevalence and the ease with which the units were found. We focus here on data from 57 units recorded in 3 ears in 3 cats.
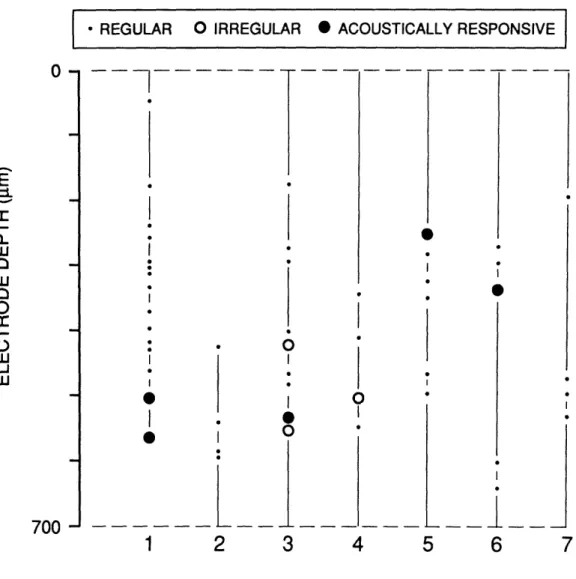
Fig. 2 shows a record of all vestibular units recorded in one electrode puncture in which the electrode was advanced and retracted seven times. Two classes of vestibular afferent units can be distinguished based on the regularity of their spontaneous discharges (Walsh et al., 1972). Units with regular discharges predominated at the recording site (n = 40), but were never found to be acoustically responsive. Of the eight irregular units recorded, 5 were "acoustically responsive" i.e. responded with a rate change at sound levels below 115 dB SPL.
Because the hallmarks of the vestibular units described here were Acoustic Responsiveness and Irregular Discharge, we refer to them as ARID units. The prevalence of ARID units was site-dependent; in some penetrations 100% of the irregular units were acoustically responsive. The prevalence represented in Fig. 2 is, however, fairly typical for our later experiments.
Responses to Clicks
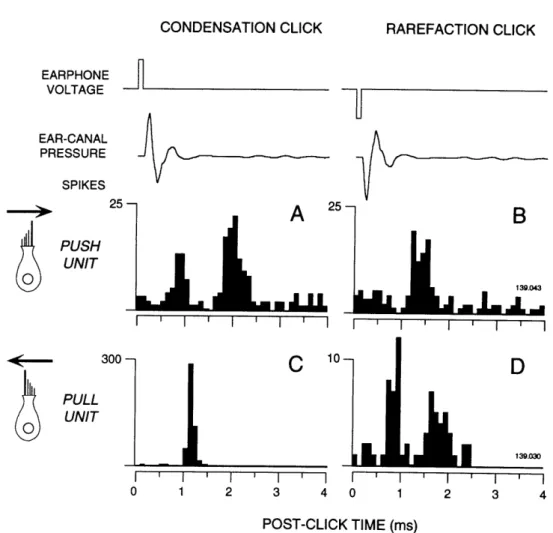
Not all ARID units responded to acoustic clicks at the sound levels used here. Most (44 of 57) did, however, and these typically responded with minimum latencies of 0.7 ms, which contrasts sharply with the minimum latencies of 2.0 ms observed in cochlear afferents (Kiang et al., 1965). Most ARID units fell into one of two classes based on their responses to condensation and rarefaction clicks (Fig. 3). As shown in Fig. 3, the classes were based on whether the shortest latency response was obtained with condensation clicks (PUSH units; Fig 3A) or rarefaction clicks (PULL units; Fig. 3D).
The shortest-latency (<1.0 ms) click responses were almost always followed by a period of reduced firing and then another period (>1.5 ms) of increased firing (Fig. 3A, D). In some cases, the second period of increased firing exceeded the first in amplitude (Fig. 3A). This cycle ("ringing") probably reflects an electro-mechanical oscillation at the level of the sensory epithelium (Chapter II).
Inversion of the click shifted the peaks of the click response in a predictable fashion such that a PUSH unit's response to a condensation click (Fig 3A) was similar to a PULL
-13-unit's response to a rarefaction click (Fig. 3D). These mirrored responses are consistent with a simple hypothesis: PUSH and PULL units are activated by "normal" hair-cell stimulation and arise from hair cells that are morphologically polarized (Wersill et al., 1965)in opposite directions.
Responses to Tone Bursts
Frequency. Although responses were obtained at frequencies as low as 100 Hz and as high as 2.5 kHz, ARID units responded best to frequencies between 500 and 1000 Hz (Chapter II). For simplicity, we chose to study the units at one frequency (800 Hz), which
was near the best frequency for all units.
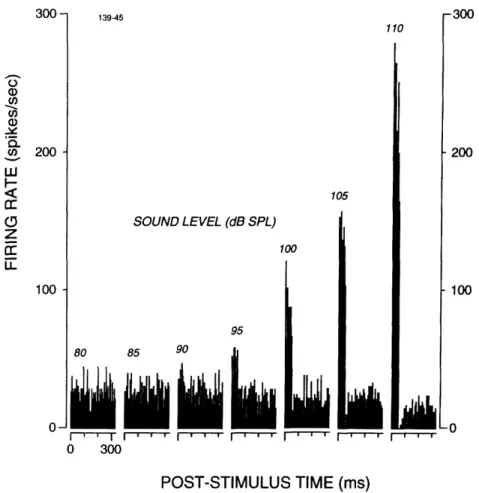
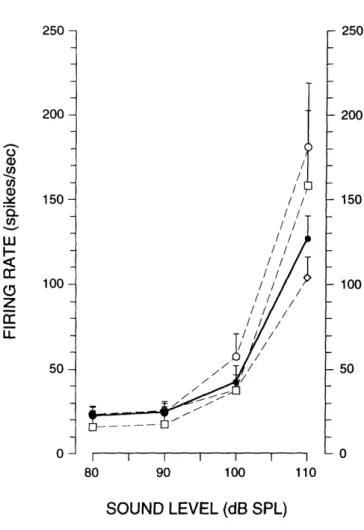
Firing Rate. Fig. 4 shows one ARID unit's response to an 800 Hz tone burst as the sound level was increased in 5 dB steps from 80 dB SPL to 110 dB SPL. With few exceptions, ARID units exhibited no increases in discharge rate below 90 dB SPL (e.g. Fig. 4). As the sound level was increased above 90 dB SPL, discharge rates increased monotonically. No firing-rate plateau was observed at the highest sound levels in any unit examined. For the aggregate population of ARID units, firing rate increased from a mean background of 22 spikes/sec at 80 dB SPL to a mean of 127 spikes/sec at 110 dB SPL (Fig. 5). The maximum firing rate observed in any unit was 340 spikes/sec (at 110 dB SPL).
Synchronization. While the mean firing rate threshold was between 90 and 100 dB SPL (Fig. 5), spikes tended to synchronize to a preferred phase of the tone cycle ("phase lock") at levels 10 dB lower (Fig. 6). For example, the unit in Fig.6 showed a clear rate increase at 95 dB SPL (Fig.6A), but phase locked clearly at 85 dB SPL (Fig 6C).
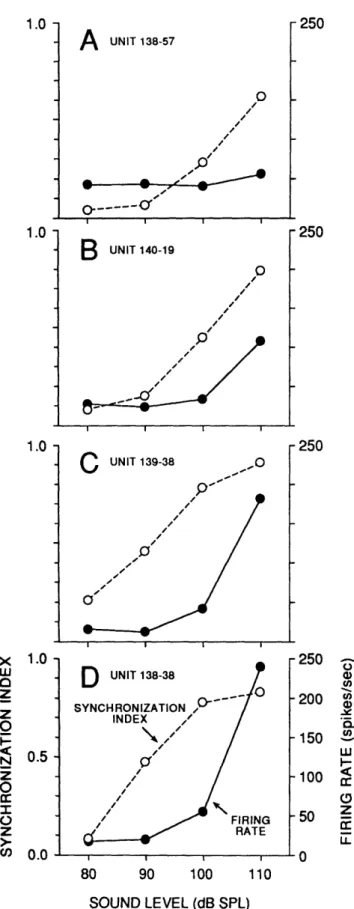
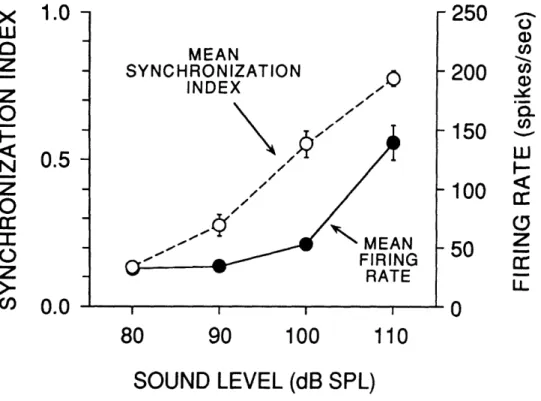
Relationships between rate threshold and phase-locking threshold are shown for four units in Fig. 7. Monotonic increases in synchronization were observed beginning at levels at or near 80 dB SPL. The average synchronization index for these units was quite high (0.77 at
110 dB SPL; Fig. 8).
Fig. 9 shows synchronization and rate change plotted as a function of sound level for 25 ARID units. A dichotomy occurs in the synchronization indices at 90 and 100 dB SPL. Units with the lower synchronization at these sound levels (Fig. 9A, dashed lines) had higher rate thresholds and lower maximal rates (Fig. 9B, dashed lines). This phenomenon (bimodal synchronization) bears no clear relationship to the PUSH-PULL dichotomy presented above and discussed further below.
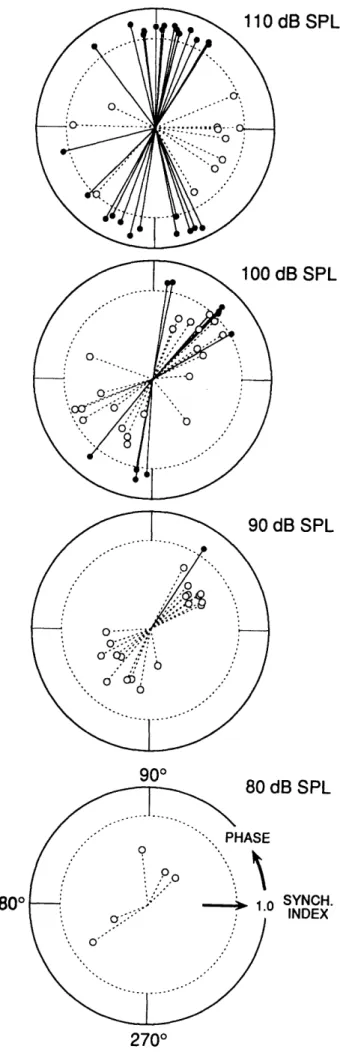
Phase. As sound level increased, ARID units began to respond at a preferred phase of the stimulus cycle (Fig. 6C). Fig. 10 shows polar plots of synchronization index (radial coordinate) vs. response phase (angular coordinate) for all units which achieved a synchronization index >0.3 (this criterion was chosen because response phase becomes more
reliable with increased synchronization and firing rate). At 90-110 dB SPL, phases clustered into two classes lying approximately 1800 apart (Fig. 10). Almost all units showed a phase advancement of about 30° as the sound level increased from 100 to 110 dB SPL (e.g. Fig. 6).
At 110 dB SPL, ARID units that achieved the highest levels of synchronization (i.e. index > 0.75) fell into two classes 1800 out of phase, but a few units with lower (though still marked) synchronization did not. These units tended to fire 90° out of phase from the majority of units (Fig. 10, top).
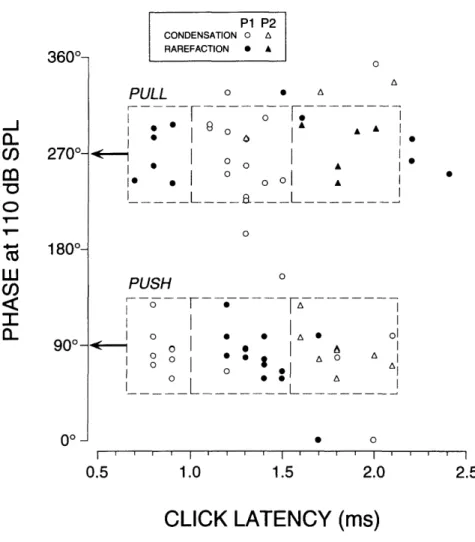
Relationship of Click and Tone Burst Responses
A strong relationship emerged between clusters of units with preferred phase and the nature of their click responses (Fig. 11). With few exceptions, units that responded with shorter latency to condensation clicks (PUSH units) had a phase near 90° while those units which responded with shorter latency to rarefaction clicks (PULL units) had a phase near 270° (Fig. 11).
Mechanism of Acoustic Conduction.
We wondered whether acoustic activation of these vestibular neurons was accomplished by ossicular transmission (i.e. through the middle ear) or through some non-ossicular mechanism (e.g. bone conduction). A serendipitous observation in one experiment provided strong evidence for ossicular transmission. The acoustic middle-ear muscle reflexes in the cat were usually suppressed by the anesthesia used in these experiments (Borg & M0ller, 1975), so we sometimes left the muscles intact. In one cat, large doses of anesthesia were required to suppress the reflex long after the usual indicators (heart rate, respiration, withdrawal reflex) indicated deep anesthesia. We were alerted to the presence of the reflex by recording from ARID units and obtaining uncharacterisitic responses (Fig. 12B). The three ARID units recorded before inactivation of the reflex discharged normally at the onset of the 50-ms tone burst but then abruptly ceased firing within 15 ms. Attenuation of cochlear response at that time indicated a 20-dB reduction of ossicular transmission by the middle-ear muscles (Fig. 12B). After complete inactivation of the acoustic reflex by anesthesia, the cochlear reponse no longer showed attenuation of ossicular transmission (Fig. 12A). Fourteen ARID units were recorded subsequently and found to discharge continuously throughout the tone burst. We conclude that the acoustic input to ARID units enters the labyrinth principally via the middle ear.
15 -Anatomical Identification
Seven ARID cell bodies were labeled intracellularly with biocytin and all were found to be bipolar ganglion cells located in the inferior division of Scarpa's ganglion near the exit of the saccular nerve. Labeling of central and peripheral projections often failed. We attributed this to transport failure caused by cellular injury due to the proximity of the injection site and soma.
In one ear, three ARID units were injected and two labeled cells were recovered. The peripheral processes of both cells extended to the sensory epithelium of the saccule. The central process of one cell was reconstructed and found to project to the vestibular nuclei (Fig. 13D-F). A marked arborization was also found with endings on cell bodies in a poorly defined region near the ventromedial edge of the cochlear nucleus (Fig. 13C). No terminals were observed within the cochlear nucleus.
I. DISCUSSION
Whether or not the mammalian vestibular system retains some role in hearing is the subject of a long debate ignited by the discovery of acoustic responsiveness in the saccule of lower vertebrates, notably rays (Lowenstein & Roberts, 1951), fish (Popper & Fay, 1973), and amphibians (Moffat & Capranica, 1976). The debate was fueled by ablation experiments which showed little or no deficit in equilibrium after destruction of the saccule in monkeys (Igarishi & Kato, 1975).
For the vestibular system in mammals to have a useful role in hearing, it must respond naturally to sounds at levels which are non-traumatic, and the signals it transmits centrally must be processed as auditory information i.e. interpreted as sensation or used to trigger behaviors. We summarize evidence that suggests that responses of saccular neurons may play a role in an organism's response to sound.
Saccular Acoustic Responses in the Cat
The available anatomical and physiological evidence suggests that most, if not all, of the ARID units reported here are of saccular origin. Grossly, the recording site is distal to the vestibular nerve bifurcation and the only afferents likely to be present are those supplying the saccule and posterior semicircular canal (Fig. 1). Our anatomical experiments have demonstrated projections to the saccule from a few well labeled ganglion cells (e.g. Fig. 13) and no evidence of labeling in the posterior canal nerve.
The PUSH-PULL dichotomy among ARID units in their responses to clicks (Figs. 3 & 11) and tones (Fig. 10-11) suggests that they arise mainly from two classes of hair cells
which are morphologically polarized in opposite directions. The saccular macula has two classes of hair cells which are oppositely polarized (Fig. 14). In contrast, the cristae of the semicircular canals each have hair cells with uniform morphological polarization (Lindeman, 1973).
The feline saccule is supplied by aproximately 1800 primary afferents (Gacek & Rasmussen, 1961) of which the majority have regular background activity (Walsh et al., 1972). According to our criterion for acoustic responsiveness (rate change at levels <115 dB SPL), none of the regular afferents from the saccule was acoustically responsive. Some irregularly discharging afferents from the saccule may also be unresponsive, although we cannot rule out the possibility that insensitive irregular units (e.g. Fig. 2) arose from the posterior semicircular canal.
Irregular discharges have been associated with the large afferent fibers (Goldberg & Fernmndez, 1977) supplying chalice endings to the flask-shaped Type I hair cells more prevalent along the central part (striola) of the macula (Lindeman, 1973). The few ARID units we recorded which did not fall into the two polarized (PUSH and PULL) categories (Figs. 10-11) may have arisen from the curved head of the saccule (Fig. 14A) or from hair cells situated directly in the striola transition zone, in which intermediate morphological polarizations are commonly found (Lindeman, 1973).
Acoustic Response Latency. ARID units routinely respond to acoustic clicks with minimum latencies of 0.7 ms from the onset of voltage to the earphone. This short latency in comparison to cochlear neurons (minimun 2.0 ms) may be accounted for in part by shorter acoustic conduction times, a closer recording site, and larger axon diameters (Gacek & Rasmussen, 1961). Nonetheless, the synapses responsible for activation of these neurons must function in <0.7 ms and are therefore fast synapses (Guinan & Li, 1990). Previous speculations on the presence of electrical synapses have been made based on morphological specializations found in Type I vestibular hair cells (Spoendlin, 1966). Whatever their synaptic morphology, ARID vestibular neurons represent the fastest known pathway for the conduction of acoustic information into the central nervous system, and this property may turn out to be an important clue to their function as well as a useful feature in identifying their post-synaptic projections.
Acoustic Response Threshold. ARID units respond briskly within the upper range of normal hearing. The sound level at which they might make functional contributions to hearing depends, however, on the cues recognized by the central nervous system. If rate changes are necessary for the detection of vestibular nerve responses, then ARID units have minimum thresholds near 90 dB SPL (Fig. 7-8). If phase locking is detectable without an increase in mean firing rate, then acoustic thresholds are closer to 80 dB SPL (Fig. 7-8).
17
-Acoustic Stimulation Mechanisms. The marked suppression of ARID-unit responses during contraction of the middle-ear muscles (Fig. 12) argues strongly for an ossicular conduction pathway. The possiblity that ARID units play some role in hearing is clearly strengthened by evidence that these units are activated through normal middle-ear sound transmission (Fig. 12).
Two aspects of the surgical procedure bear on the question of whether ARID responses occur in behaving animals. These include the opening of the posterior fossa, and the drilling of the superficial temporal bone. It is conceivable that opening the posterior fossa altered the mechanics of the vestibular system, which is in contiguity with the intracranial space through several pathways (but principally via the endolymphatic duct and sac). We note that the long, thin structure of the endolymphatic duct would favor acoustic transmission at very low frequencies.
The drilling of the temporal bone is of more concern, because fenestration of the labyrinth can produce dramatically lowered acoustic thresholds in the vestibular neurons of many animals (Tullio, 1938; Mikaelian, 1964; Wit et al., 1984; Ribaric et al., 1992). For this reason, we meticulously maintained the integrity of the bony labyrinth. In one instance, reported elsewhere (Chapter II), we attempted to record from acoustically responsive vestibular neurons near their brain-stem entry zone and were able to do so without drilling the temporal bone. We had more difficulty finding acoustically responsive neurons at this more proximal site, however, and attributed this difficulty to the presence of numerous afferents from unresponsive end organs.
Saccular Acoustic Responses in Species other than the Cat.
The extrapolation of our results to the awake and behaving mammal are supported by consistent findings in other mammalian preparations in which less extensive surgery was undertaken (Townsend & Cody, 1971; Young et al., 1977; Cazals et al., 1983; Colebatch & Halmagyi, 1992).
Guinea Pig. Sound-evoked potentials have been recorded from the guinea pig labyrinth after the chemical elimination of cochlear hair cells with aminoglycosides (Aran et al., 1979; Cazals et al., 1979; Cazals et al., 1980; Cazals et al., 1982), and some indirect evidence implicates the saccule as the generator for these potentials (Cazals et al., 1983; Didier & Cazals, 1989). The applicability of these findings to normal mammals has previously been questionable in light of the unknown effects of chemical treatment on surviving hair cells.
Human. A number of human auditory phenomena have been attributed to the saccule. These include sound-evoked neck reflexes elicited through normal ears (Townsend & Cody,
Squirrel Monkey. The most comparable study to the present work (Young et al., 1977) examined the response sensitivity of vestibular afferent neurons to both sound and vibration in all five vestibular end organs of the squirrel monkey. The general conclusion of this study was that the mammalian vestibular apparatus was poorly sensitive to sound, and that the saccule was only slightly more acoustically sensitive than other vestibular end organs. Because of their broad approach, these investigators reported the acoustic response thresholds of only 7 saccular units and found a median threshold for rate change of >120 dB SPL. No division of units was made based on the regularity of their discharges. Separation of saccular units by synchronization phase to intense low-frequency tones was accomplished, however, and the phase was found to correlate strongly with morphological polarization as determined by responsiveness to head tilt (Young et al., 1977). Interestingly, one unit in the study (from the saccule) showed a phase-locking threshold of 76 dB SPL, but this unit was not described in detail, possibly because it was not held long enough to be studied thoroughly (Young et al., 1977). This low-threshold saccular unit from the squirrel monkey may be similar to the units studied here.
Central Projections of Saccular Afferent Neurons
The possibility that the saccule is involved in some sort of auditory processing has been strengthened by recent demonstrations that saccular afferents send projections into the auditory brain stem (cochlear nucleus) in mammals (Burian & Gstoettner, 1988; Kevetter & Perachio, 1989). In one study in the guinea pig, 40% of irregularly discharging saccular afferents had cochlear nucleus projections (Kevetter & Perachio, 1989). These demonstrations reinforce the anatomical link between cochlear and vestibular systems established by the observation that some cochlear efferent neurons collateralize within the vestibular nuclei (Rasmussen, 1960; Brown et al., 1988).
We were unable to demonstrate cochlear nucleus projections from ARID neurons, although this negative result may be readily accounted for by the paucity of well-labeled ARID cells. We did, however, find an elaborate collateral that terminated on cell bodies in a nondescript region near the ventromedial border of the cochlear nucleus (Fig. 13C). This region is contiguous with the outflow fibers of the ventral acoustic stria (trapezoid body) and the properties of its constituent neurons remain unknown. It may represent a previously undefined region for the processing of auditory information.
With appropriate central connections, ARID units could serve a number of different auditory functions, the principal categories being sensation and the initiation of behaviors. Potential acoustic behaviors are plentiful. Saccular neurons are known to make oligosynaptic connections with numerous cranial and cervical motoneurons (Hwang & Poon, 1975; Wilson
-
19-et al., 1977). Furthermore, ARID units have acoustic thresholds associated with the rapid activation of motoneurons supplying the eye muscles (Galambos et al., 1953), neck muscles (Townsend & Cody, 1971; Colebatch & Halmagyi, 1992), and middle-ear muscles (Guinan & McCue, 1987). The relationship between ARID units and middle-ear muscle (MEM) motoneurons is particularly intriguing, since both classes of neurons have best frequencies near 1000 Hz and thresholds >90 dB SPL (Guinan & McCue, 1987; Kobler et al., 1992). The afferent neurons for the acoustic MEM reflexes have long been assumed to arise solely in the cochlea (Borg, 1973a), but the primary afferent neurons and interneurons remain unknown (Joseph et al., 1985). All available anatomical evidence on the pathway of the acoustic MEM reflex is consistent with ARID contributions (Borg, 1973). However, we note that ARID units are unlikely to be solely responsible for acoustic MEM contraction owing to an additional high frequency response region exhibited by MEM motoneurons (Kobler et al., 1992) and absent in ARID units (Chapter I).
The possibilities for ARID involvement in sensation are also numerous as ARID response thresholds are in the sound level range associated with transitions to discomfort (e.g. rock music) and pleasure (e.g. rock music). If this accessory auditory pathway is present in humans, it even holds the remote possibility of facilitating treatment for profound sensorineural deafness. An electronic hearing prosthesis interfaced with the saccule ("saccular implant") might produce an interpretable sensation, perhaps comparable to the single-channel cochlear prosthesis (Kiang & Moxon, 1972), for patients lacking cochlear neurons. Much of course depends upon the current usage and plasticity of central connections.
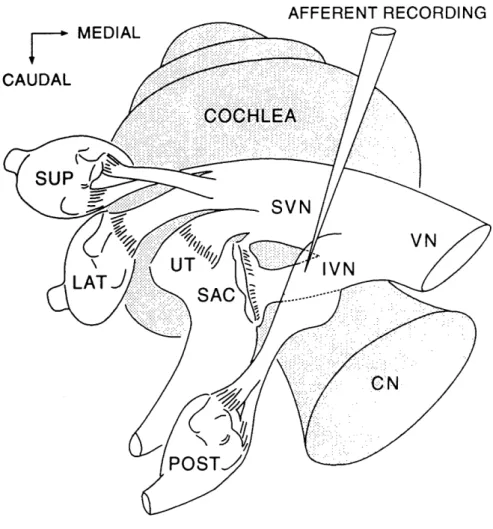
AFFERENT RECORDING
FIGURE I-1. Schematic showing the recording site in relation to the cat's cochlear and
vestibular systems. The shaded areas represent the cochlea and cochlear nerve (CN). The unshaded areas represent the vestibular apparatus, which consists of two otolith organs (SAC = saccule and UT = utricle) and three semicircular canals (SUP = superior, LAT = lateral, POST = posterior). The vestibular nerve (VN) supplies the vestibular organs through its superior division (SVN) and inferior division (IVN). Acoustically-responsive vestibular neurons were recorded in the inferior division, which supplies the saccule and posterior semicircular canal.
... .. ... . k:
... . .. .. . .... ... .... ...
21
-REGULAR 0 IRREGULAR ACOUSTICALLY RESPONSIVE
I
i I II
0 * . 12
2
I 0I 0 0II
I
0
03
4
5
.6
7
ELECTRODE PASSFIGURE 1-2. Occurrences of acoustically responsive units encountered on one electrode
puncture of the inferior vestibular nerve. Each column represents a separate pass (same location) in which the electrode was advanced slowly as each unit was encountered and noted. Vertical lines indicate the extent of each pass. Each encountered unit was classified according to the regularity of its spontaneous activity as judged by listening to amplified discharges played through a speaker. All units that displayed audible irregularity were tested for acoustic responsiveness. Of the 8 irregularly-discharging units encountered at this site, 5 showed an increased discharge rate in response to an 800-Hz tone burst at 110 dB SPL.
0-E I u H 0 0 0 0 LU _J U 700 -. i ---i I .
CONDENSATION CLICK RAREFACTION CLICK EAR-CANAL PRESSURE SPIKES c
A
u-25 -PUSH UNIT 300 -PULL UNITI
C 10L
I ' I ' I ' I 0 1 2 3 -i 4B
ML
IJU.LJLU
139 043 I I I ' I ' I ' I I ~~I
I
I
139.030LL
0 0 I I 1 2 I 3 ' I 4 POST-CLICK TIME (ms)FIGURE 1-3. Separation of acoustically responsive vestibular units into two classes
(PUSH-PULL) based on responses to condensation and rarefaction clicks. The first trace
shows the timing and polarity of the voltage waveform delivered to the earphone. The second trace shows the the pressure waveform recorded from the microphone near the tympanic membrane. The lower panels are PST histograms constructed from the spikes of two different units which are representative of their respective classes. PUSH units (A-B) responded with shortest latency to condensation clicks (A), while PULL units (C-D) responded with shortest latency to rarefaction clicks (D ). Cartoons at left indicate a hypothetical hair cell orientation and arrows indicate the excitatory (depolarizing) direction. The bin width is 0.1 ms. The total number of spikes occurring in each bin are plotted for 500 repetitions of the click.
EARPHONE VOLTAGE
4f1
I -I I . . . ..... t
zbLIII1L"
- 23 300 -0 C) Cl a) ._ I-(5 Z IL 200 -139-45 110 105 SOUND LEVEL (dB SPL) 100 100
-
n-95 80 I, I I1,Ni
85 90 11 , , I I 0 300rI
r -200 -100 -n POST-STIMULUS TIME (ms)FIGURE I-4. PST histograms of an acoustically responsive vestibular unit to 800-Hz tone
bursts of increasing amplitude. Each PST histogram represents responses to 64 tone bursts of
50 ms duration delivered at a rate of 3/sec. Tone burst onset is at t=0. Bin width is 6.7 ms.
_ lu% r--r--r --- r ,I I . I I _
V-t
l , oJ&Y
200 -U) () - 150-U) 100-Z cc 50 n-- 200 - 150 - 100 - 50 - n I I I I I I I 80 90 100 110 SOUND LEVEL (dB SPL)
FIGURE 1-5. Mean firing rates in acoustically responsive vestibular units at 4 sound levels.
Units in which PST histograms were obtained at each level were included. The solid line represents the mean+SEM for all such units (n = 38). Each dashed line represents mean+SEM for units from one ear (circles, n = 8; squares, n= 5; diamonds, n = 25). Mean firing rate was calculated for each unit over the 50-ms stimulus interval of PST histograms similar to those shown in Fig. 4.
n~~~~~~~~n~~ c
C.U - -CU
25
-A PST HISTOGRAM
B
PST HISTOGRAM -EXPANDED C PZC HISTOGRAM1.
hiAi
k
-~~~~ LbL1I
dl&uLk rI -j...-L LII ]1 , LL .- . -- ,-,I ] II Jl.,...b,,.I.IJ AI 1 .-.I
11,11,
hi
lurl
I.
I
kI1111,,
,i
l
l Iil
]..L .L .i Lia. Jl I &l lI ,.. I .... .I... i _ * . i .J . . , - . . .. I .. I . ... .,II
1 .
IA
I hI , -..-- .L aLL.. Ik - ..L- .. ,I .... 100 13945 10001 ... i , .. . 80 . I I I I 1 1.25POST-STIMULUS TIME (ms) POST-STIMULUS TIME (ms) POST-ZERO CROSSING TIME (ms)
FIGURE I-6. Relationship of phase-locking and rate thresholds for an acoustically
responsive vestibular unit. Top traces depict voltage waveforms at the earphone. A, PST histograms showing firing rate increases occurring at < 95 dB SPL. B, Expanded PST histograms showing the tendency for discharges to occur at a preferred phase of the stimulus cycle. C, Post-zero crossing histograms showing tone synchronization occurring at levels < 85 dB SPL. Note that the preferred phase in C advances noticeably with increasing sound level. The stimulus was an 800 Hz tone burst with a 50-ms duration and 2.5 ms rise-time. Same unit shown in Fig. 4.
JI
.) a. -z :cc n-SOUND LEVEL (dB SPL) 110 105 100 95 90 85 0 I l i · L .k.I i. .. i. . .1. . L · . . 125 0 25 02I I __ .- L. I -L lo | A Ikl m1
I . "lik NaLdbmw"."1.0
1.0
1.0
FIGURE 1-7. Comparison of firing
rate and synchronization in 4 units at 4 sound levels. Dashed lines show the synchronization index for each unit (left scale). Solid lines show the corresponding firing rate (right scale). Units were chosen to illustrate a range of maximal firing rates. In each unit, an increase in synchronization occurred at a level at least 10 dB below that which produced an increase in firing rate. Stimuli identical to Fig. 6. See Methods for calculation details.
x w z I-N z I zo, 1.0 0.5 0.0
A
UNIT 138-57 O / / --- oC
UNIT 139-38 -- o 0 " ./0O 80 90 100 110 SOUND LEVEL (dB SPL)B
UNIT 140-19 0 ,' / ,' //j/' / - 250 - 250 -250 u) -200 a x -150 Is W UI -100 , -50 Z c" LL -I I -. . . . . . . -.I
I
I
I
a ,e - ZOU -!
-27-MEAN
SYNC HRON IZATION INDEX N JG a: I 1rl I c 9
90
100
80
-
250
O a) Cn - 200 coa)
-
150
X
w
- 100
<
(
-50
z
ii - n 1 V 110SOUND LEVEL (dB SPL)
FIGURE I-8. Mean synchronization index and firing rate for all units studied at 4 sound
levels. Units in which complete histograms were obtained at each level were included (n = 38). Vertical bars indicate +SEM. Labeling conventions identical to Fig. 7.
X
w
ZZ
O
-N Z I 0 Z >1.00.5
-0.0-
7I.u -x w -0
z
z
Z O I-- 0.5-N Co z-A
I I 1 30 -c) t, Je 200-FIGURE 1I-9. Synchronization and w firing rate changes for 25 units. A, <
Synchronization indices at four c different sound levels. B, Evoked (
firing rate increase (change from Z
background rate at 80 dB SPL) at LL 100
-four sound levels for the same units < shown in A. To improve the
accuracy of the synchronization index calculation, only units which had background firing rates 10 spikes/sec were plotted. Dashed lines
indicate units ... which have
~n-cvnchrnni7atinn inicp. ... x.~.4. .a. .... -..J.. cI - 3 at Q9) .a.
dB SPL and <0.65 at 100 dB SPL. I I I ]
80 90 100 110
-
29-FIGURE I-10. Polarization of acoustically
responsive vestibular units into two classes based on response phases to tonal stimuli. Each panel shows a polar plot of response phase vs. synchronization index (S.I.) for all units at one sound level. Representation scheme - S.I.>0.75 (solid lines & filled circles), 0.75>S.I.>0.30 (dashed lines & open circles), S.I.< 0.3 (points omitted because of phase inaccuracy). Outer circle: SI=1.0 (perfect synchronization). Inner circle: S.I.=0.75 (high synchronization). Center: SI=0 (no synchronization) Response phase and synchronization were calculated from PZC histograms (see Fig. 6C and Methods). dB SPL dB SPL dB SPL 900 ofn i4D er 1800 UCD OrL SYNCH. INDEX 2700
,OU --_j 03 270°
-m
4--J180
°-W 03 Ia.
90o-no -P1 P2 CONDENSATION A RAREFACTION A O A PULL 0 0 A - L---- --- I o I I_____L______L_______ · · 100 O · o o a I · · ol ___ …K
…~~~~~~~~~~~~~~~~~~~~~~~~~~~~~~~~~~~~~~~~~~~~~~~~
' ~° I~~~~~ I I ' ' I I I I ' I i I I I I I I I I I I 0.5 1.0 1.5 2.0 2.5CLICK LATENCY (ms)
FIGURE I-l. Relationship between click latency and preferred phase for tonal stimulation. Each symbol indicates the latency of a peak in a click PST histogram (see Fig. 3) accumulated in response to condensation (open symbols) or rarefaction (filled symbols) clicks. Initial peaks (P1) are represented by circles while any secondary peaks (P2) are represented by triangles. The upper dashed boxes and lower dashed boxes are regions of identical size, centered on 270° and 90° respectively, in which each corresponding sub-region contains an almost homogeneous population of points. PULL units (top boxes) responded with shortest latency to rarefaction clicks and had preferred phases which clustered around 270°. PUSH units (bottom boxes) responded with shortest latency to condensation clicks and had preferred phases which clustered around 900. Response phases were calculated from PZC histograms (see Fig. 6C and Methods). Latency information was taken from all PST maxima that exceeded by 100% the average background activity during the 80-ms pre-click interval. This criterion was occasionally met by a second peak but not a first peak (triangle with no corresponding circle). Units that responded to tone bursts but not to clicks are not included.
31
-A
NORMAL RESPONSES UNIT RESPONSEIn.
U UNIT 140-23I
Aips
500 COCHLEAR POTENTIAL o-III 3 1-- g u u v TONE BURSTB
MIDDLE-EAR MUSCLES CONTRACTING SOUND LEVEL (dB SPL) UNIT 140-06 . L..a..J.L .l I ' ' ' I ' ' ' ' I I TONE BURST110
110
90
I 0 50 100 I ' ' I I 0 50 100 POST-STIMULUS TIME (ms)FIGURE 1-12. Effect of middle-ear muscle (MEM) contraction on the acoustic responsiveness of vestibular neurons. A, The top panel shows a PST histogram with the typical (continuous) response of ARID units to intense tone bursts in the absence of the acoustic MEM reflex. B, PST histogram showing the response pattern observed in three consecutive ARID units recorded while the acoustic MEM reflex was active. Bottom panels
show the cochlear response potentials produced by tone burst stimulation at two sound levels. The sharp reduction in middle-ear transmission caused by MEM contraction is shown beginning at 15 ms (B, dashed line).
400 U) LU I w A cr 0 IJZ LL (.. 500 0 - I--Y
BRAIN STEM -I... SUPERIOR A SACCULUS VESTIBULAR B NERVE VESTIBULAR NUCLEI LATERA
FIGURE 1-13. Reconstruction of an intracellularly labeled ARID unit showing its peripheral projection to the saccule (A), its cell body (B), and its central projections to the brain stem (C-F). Neural processes were traced from near horizontal sections using a camera lucida (xlO, 0.45 n.a. objective). Two cells were intentionally labeled in this case and could be separated based on marked differences in labeling intensity. The lightly-labeled fiber faded out just prior to the bifurcation of the dark fiber in the vestibular nuclei (D) and was therefore not reconstructed. Presumed connectivity is indicated by dashed lines (e.g. E) which represent sections lost during histological processing. The fiber was not completely reconstructed because it extended beyond the caudal edge of the tissue block (F). The boundary of the cochlear nucleus was estimated from low-power tracings in the 3 sections containing the nearby neural arborization (C). The fiber is shown collapsed along its dorsal-ventral dimension (4.32 mm) as are the partially schematized brain-stem and nerve boundaries. Differences in line thickness do not represent differences in labeling intensity.
33
-B
DEPOLARIZING DIRECTION4 -
-*FIGURE 1-14. Schematic representation that shows the general shape of the mammalian
saccular sensory epithelium (A) and the morphological polarization of its hair cells (B). Saccular hair cells are divisible into two classes which are morphologically polarized in opposite directions with a boundary along the longitudinal axis (striola) of the macula. Flask-shaped Type I hair cells with chalice-like afferent endings predominate near the striola (B). Some of these may exhibit variable directions of morpological polarization (not shown). Figure adapted from Lindeman, 1969.
A
9,
II. TUNING: IMPLICATIONS FOR MAMMALIAN HEARING MECHANISMS
II. INTRODUCTION
We have studied a class of primary vestibular afferent neurons in the cat which respond robustly to sounds at moderately high sound levels (Chapter I). These findings support conclusions about the normal acoustic responsiveness of vestibular elements based on the presence of sound-evoked gross potentials after chemical elimination of cochlear hair cells (Aran et al., 1979; Cazals et al., 1979; Cazals et al., 1980; Cazals et al., 1982; Cazals et al.,
1983; Didier & Cazals, 1989). A variety of physiological and anatomical evidence suggests that these cells arise in the saccule, and project to brain stem regions both within and outside the traditional boundaries of the vestibular nuclei (Chapter I).
Acoustically responsive saccular neurons make up an auditory pathway distinct from that originating in the cochlea. Because the acoustic responsivity of the saccule pre-dates the evolution of the mammalian cochlea (Lowenstein & Roberts, 1951; Moffat & Capranica,
1976; Saidel & Popper, 1983), its mechanisms may have played a role in the evolution of mammalian hearing. In this report, we describe the frequency response (tuning) characteristics of saccular neurons and discuss possible mechanisms for this tuning. We relate the response thresholds and frequency ranges of these units to existing auditory mechanisms in mammals and lower vertebrates (Moffat & Capranica, 1976). In particular, we show the similarites between the tuning of these vestibular units and the low-frequency tails in the tuning curves of cochlear afferent neurons (Kiang & Moxon, 1974). We propose a number of hypotheses regarding the evolutionary development of cochlear tuning mechanisms and the relationship of those mechanisms to the action of the middle-ear muscles.
II. METHODS
Treatment of experimental animals was in accordance with protocols approved by the Committees on Animal Care at the Massachusetts Institute of Technology and the Massachusetts Eye & Ear Infirmary. Adult cats were induced and maintained under anesthesia by intraperitoneal injection of diallylic barbiturate in urethane as previously described (Kiang et al., 1965). Except where noted, surgical preparation, sound stimulation and neural recording were performed as described previously (Chapter I).
Sound Stimulation. Sounds were delivered through a metal acoustic assembly sealed against the bony tympanic ring (Kiang et al., 1965). The standard sound source was a 1-in. condenser earphone (BrUiel & Kjaer 4132) which was rigidly fixed to the acoustic assembly.
35
-In an experiment designed to test the possibility of direct bone vibration, a second earphone (Beyer DT-48) was connected in parallel to the acoustic assembly through a 4-cm flexible polyethylene tube (Fig. 5A). A small metal probe tube ending near the tympanic membrane (omitted in Fig. 5A) was connected to a 1/4-in. condenser microphone (Bruel & Kjaer 4135) which measured the levels produced by both sound sources as a function of frequency. The maximal sound level delivered was 115 dB re: 20 gPa (sound pressure level or SPL).
Neural Recording. Single-unit recordings were made from primary vestibular afferent neurons in the inferior vestibular nerve using glass micro-pipettes (2M KC1) as previously described (Chapter I). The recording site was near the junction of the inferior and superior vestibular nerves. Access was obtained by aspirating the overlying cerebellum and drilling away the roof of the internal auditory meatus (Wilson et al., 1977; Liberman & Brown, 1986). In one experiment, drilling was avoided, and units were recorded centrally at the exit of the vestibular nerve from the internal auditory meatus.
Unit Search Paradigm. Spike discharges were fed to a speaker for audio monitoring. Impaled units were detected by a drop in DC potential or the detection of "spontaneous" spikes. In early experiments, all encountered units were tested with intense noise bursts and units which exhibited audible increases in discharge rate were studied further. We determined that all responsive units had irregular background activity and responded with a rate increase to 800 Hz tone bursts at 115 dB SPL. In experiments reported here, we used these two properties as defining criteria. Each unit with audible irregularity was tested with an 800 Hz tone burst at 115 dB SPL. If it exhibited audible increases in discharge rate, it was classified as acoustically responsive and studied further.
Tuning Curves. We measured thresholds as functions of sound frequency ("tuning curves"; see Fig. 1) using an automated algorithm designed for cochlear afferent neurons (Kiang et al., 1970). Sound stimuli consisted of tone bursts (0.1 to 48 kHz) of 50-ms duration with a 2.5 ms cos2-shaped rise-fall time. Stimuli were delivered at a rate of 3 bursts/sec rather than the standard 10 bursts/sec used for cochlear afferent neurons (Kiang et al., 1970). The sound frequency was initally set at 48 kHz and decremented in 1 dB frequency steps (between each threshold determination) until 3 kHz was reached, whereupon 0.5 dB frequency steps were used down to 100 Hz (Fig. 1). Sounds as intense as 115 SPL dB were tested except at frequencies where this level was beyond the maximal output of the acoustic system (Fig. 1).
Each tuning curve underwent 3-point smoothing (triangular weighting) before being analyzed further. We defined "best frequency" (Fig. 1) to be the frequency which produced a response at the lowest absolute sound level ("best threshold"). To assess tuning curve
sharpness, we used the statistic Q1o (Fig. 1), defined as the best frequency divided by the tuning curve bandwidth 10 dB above best threshold.
II. RESULTS
Acoustically responsive vestibular neurons were first noted during experiments in which cochlear efferent fibers were being recorded near the vestibulo-cochlear anastomosis (Bundle of Oort) in the inferior vestibular nerve (Chapter I). Search stimuli for cochlear efferent fibers consisted of high-level noise bursts, which were found to excite robust responses in some vestibular afferents. Most vestibular neurons that we encountered had regular background discharges and did not show sound-evoked increases in firing rate. A fraction of the irregular vestibular units did show increased firing rates to sound (between 0 and 100% of the irregular units in different electrode penetrations). We refer to these as Acoustically-Responsive Irregularly Discharging (ARID) units (Chapter I).
ARID vestibular afferents were recorded in the inferior vestibular nerves of 21 cats. Responses to tone bursts and clicks have been previously described (Chapter I). We focus here on "frequency response" data from 57 units recorded in 3 ears in 3 cats. Frequency response ("tuning curve", e.g. Fig. 1) was assessed with an automated algorithm previously applied to cochlear afferents (Kiang et al., 1970) and efferents (Liberman & Brown, 1986).
Tuning
ARID units responded to moderately intense sounds (rate change at <115 dB SPL) over a frequency band extending from 100 Hz to 2.5 kHz (Fig. 2). Minimum thresholds were near 90 dB SPL (Fig. 2), although units synchronize to low frequency tones at levels 10-15 dB lower than their rate thresholds (Chapter I). Best frequencies are between 500 and 1000 Hz (Figs. 2-3). There was a slight tendency for units with higher best frequencies to have higher thresholds (Fig. 3).
Tuning curves of ARID units were relatively broad (Fig. 4) in comparison to cochlear afferent and efferent units with similar best frequencies (Liberman & Brown, 1986). We assessed sharpness of tuning using the statistic Q1o (Fig. 1) and found values generally <1.0 for ARID units. In contrast, cochlear afferents and efferents with similar best frequencies have Q10o values 21.0 (Liberman & Brown, 1986). ARID units with lower best thresholds and lower best frequencies tended to have sharper (higher Q1o) tuning curves (Fig. 4). However, we were able to obtain a Q1o in only 14 of 57 units because best thresholds in the remaining units were within 10 dB of the maximal earphone output.
- 37 -Is Activation by Bone -Conducted Vibrations?
A control experiment was performed to determine whether ARID units were responding to earphone vibrations coupled through the metal housing and bony tympanic ring (Fig. 5). We added a second earphone connected to the acoustic assembly through a flexible plastic tube. The tube was inserted to provide vibration isolation and reduce the coupling of vibration from earphone to skull.
Units responded to the two sound sources with similar tuning at similar sound pressures (Fig. 5B), suggesting that the relevant physical variable was sound pressure near the tympanic membrane and not the amplitude of bone vibration. We conclude that the adequate sound stimulus for these units is conducted through the tympanic membrane (and middle ear) rather than through the surrounding temporal bone.
Is the Response Influenced by Temporal Bone Drilling?
In one ear, we recorded from units in the main vestibular nerve root at its exit from the internal auditory meatus without drilling the temporal bone. We obtained tuning curves from several acoustically responsive vestibular afferents (Fig. 6). Tuning curves from two such units are shown in Fig. 6.
II. DISCUSSION
Acoustically-responsive primary neurons are found commonly in the inferior vestibular nerve of the anesthetized cat; available physiological and anatomical evidence (including intracellular labeling) suggests that most of these cells arise in the saccule (Chapter I). These neurons respond to moderately high sound levels with best frequencies in a narrow portion of the acoustic frequency spectrum - both properties which differentiate them from the population of cochlear afferent neurons (Fig. 7). Fig. 7 compares the best threshold and best frequencies for the two known classes of acoustically-responsive irregularly-discharging afferents (cochlear and vestibular) now demonstrated in mammals.
The cat saccule contains two principle groups of hair cells which are morphologically polarized in opposite directions, and ARID units fall into two opposing classes based on their preferred polarities for acoustic stimulation with clicks and their preferred response phases for tones (Chapter I; Young et al., 1977). A simple explanation for these two dichotomies is that ARID units are activated through the normal mechanical stimulation of hair cell stereocilia and the two physiological classes of ARID units correspond to the two anatomical classes of saccular hair cells (Chapter I).