Vous avez des questions? Nous pouvons vous aider. Pour communiquer directement avec un auteur, consultez la première page de la revue dans laquelle son article a été publié afin de trouver ses coordonnées. Si vous n’arrivez pas à les repérer, communiquez avec nous à [email protected].
Questions? Contact the NRC Publications Archive team at
[email protected]. If you wish to email the authors directly, please see the first page of the publication for their contact information.
https://publications-cnrc.canada.ca/fra/droits
L’accès à ce site Web et l’utilisation de son contenu sont assujettis aux conditions présentées dans le site LISEZ CES CONDITIONS ATTENTIVEMENT AVANT D’UTILISER CE SITE WEB.
READ THESE TERMS AND CONDITIONS CAREFULLY BEFORE USING THIS WEBSITE. https://nrc-publications.canada.ca/eng/copyright
NRC Publications Archive Record / Notice des Archives des publications du CNRC :
https://nrc-publications.canada.ca/eng/view/object/?id=666836e4-92cf-4962-a089-6a987a197627 https://publications-cnrc.canada.ca/fra/voir/objet/?id=666836e4-92cf-4962-a089-6a987a197627
NRC Publications Archive
Archives des publications du CNRC
Access and use of this website and the material on it are subject to the Terms and Conditions set forth at
The Detection of Stud Line Cracking in metal Stud Walls
The Detection of Stud Line Cracking in Metal Stud Walls
ST EV EN CRAI NThe Dow Chemical Company 200 Larkin Center
1605 Joseph Drive Midland, MI 48674
DALWI N DER GI LL, M EDH AT H AN N A, DON ALD LEBLAN C
National Research Council Canada
Centre for Surface Transportation Technology 2320 Lester Road
Ottawa, Ontario K1V1S2 Canada
ABSTRACT
Polyurethane spray foams have found widespread use in the construction industry as insulation, moisture and air barriers. Due to the in-field application of Spray-Applied Polyurethane Foam (SPF), the foam is applied under a wide variety of environmental conditions. Unfortunately, applying spray polyurethane foams to the intended substrates especially wooden or metal studs may not be feasible because of problems obtaining adhesion and/or cohesion to the studs under relatively low temperatures. At relatively low substrate temperatures the formulation of curing polyurethane foam may exhibit cohesive or adhesive failure of the foam to the substrate.
Adhesive failure at the stud-foam interface is commonly called stud line cracking and sometimes rifting. Stud line cracking is especially difficult to spot for metal studs of a wall due to the inability to see the foam-metal interface within the channel of the stud. The implication of an un-repaired crack may be that air and moisture vapor can enter the building envelope via the crack minimizing the intended performance of the spray foam.
At the Center for Surface Transportation Technology’s (CSTT) Climatic Laboratory, mock metal and wood stud walls were built and instrumented with a thermocouple to measure bulk foam temperature rise. The metal stud walls were also instrumented with a modified miniature compression load cell to evaluate the forces applied to the studs of the wall in an attempt to understand the events prior to stud line cracking. A description with examples of the technique that was used to understand the effect of substrate temperature on stud line cracking will be discussed.
INTRODUCTION
Closed cell medium density spray-applied polyurethane foam insulation (mSPF) is applied to a variety of substrates. A significant application of mSPF is to the exterior wall envelope particularly the interior cavities of the walls framed by wood or metal studs. An exterior wall envelope is a system or assembly of exterior wall components constructed to protect the conditioned interior space from the exterior environments [1]. mSPF is generally applied for its insulation value but also as an air and moisture vapor barrier.
mSPF comes as a two component system designed to be spray-applied to substrates without sagging. One component is the polyisocyanate liquid and the other component is a complex liquid blend of physical and chemical blowing agents, polyols, diluents, foam stabilizing agents, catalysts and fire retardant additives. The two component system is separately heated while being transferred in pre-heated hoses at elevated pressures to a handheld impingement mix chamber (spray gun) before spraying out onto the substrate. The liquid blend begins to react quickly giving cream times between 0.5 and 3 seconds and rise times between 4 and 30 seconds. As the foam expands, it is restricted in five of six directions (sheathing, header, footer and studs) of the cavity and expands both to the opening of the cavity and into any gaps or cracks resulting from the various construction practices.
There is interest in both individual component construction materials and gaps between construction materials on the transport properties of heat, air and moisture [2]. Pollutants that may penetrate a building through gaps in between construction materials are also of concern [3]. mSPF is defined as >90% closed cell foam per ASTM C 1029 and is therefore an excellent choice when spray-applied to insulate and seal the exterior wall envelope.
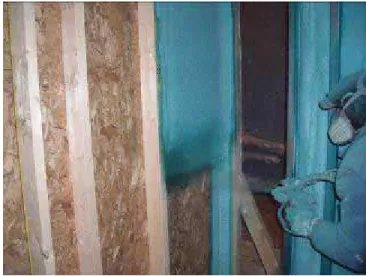
Figure 1. Stud line cracking after SPF system inappropriately applied below manufacturers recommended substrate conditions.
Due to the in-field application of spray-applied polyurethane foam, the foam is applied under a wide variety of environmental conditions throughout the year. Under winter conditions, at relatively low substrate temperatures for the formulations intended design, the polyurethane foam may exhibit cohesive or adhesive failure of the foam to the substrate.
Cohesive and adhesive failures at the stud-foam interface are commonly called stud line cracking and sometimes rifting. Much of the foam delamination known in the industry is generally avoidable if the substrate is kept clean [4]. From our experience delamination due to moisture, frost and other contaminants is typically an adhesion failure and stud line cracking at the foam-substrate interface due to inappropriately low substrate temperatures is via cohesive failure. mSPF system suppliers specify upper and lower substrate and ambient temperature levels that are acceptable for a particular formulation. An example of a foam system applied at an inappropriately low substrate temperature is shown in Figure 1. As the foam cooled and began to shrink, extensive cohesive failure occurred opening the exterior wall envelope to air and moisture intrusion.
Stud line cracking for commercial walls can be difficult to detect when metal studs, typically in the shape of c-channels, are used in construction. The stud-foam interface at the footers and headers and in some cases along the studs themselves is within the c-channel itself. To determine if stud line cracking has occurred within the c-channels it has been necessary to deconstruct the walls. The Foam Deflection Force Gauge as an in-situ measurement device not only allowed confirmation as to whether a stud-foam delamination had occurred but also gave a real time pressure profile of the spray-applied foam within the cavity. In combination with bulk foam temperature measurements, formulations were found that optimized the foam performance when spray-applied in winter like conditions.
EXPERIMENTAL
Each residential 4X8 foot wall assembly was constructed with three cavities of different widths (see Figure 4). The widths were 8, 16 and 24 inch on center using 7/16 inch thick oriented strand board (OSB) assembled with nominal 2 x 4 inch spruce wood studs using deck screws. Each commercial 4X8 foot wall assembly was also constructed with three cavities at 8, 16 and 24 inch on center. The commercial wall was constructed of 1 inch thick THERMAXTM HD brand isocyanurate insulation sheathing (THERMAX is a trademark of The Dow Chemical Company) attached to c-channel metal studs using metal screws in combination with plastic washers. The metal studs for the commercial wall assemblies were 16 gauge Dietrich CSJ 3 5/8 inch steel studs with an extra c-channel at the top to simulate a larger thermal mass.
The polyol system and polymeric isocyanate temperatures were recorded separately using a Type T temperature probe within an adapter, provided by Gaco. The adapter was located between the spray gun and the hose whip. The temperature was recorded at 1 HZ using the same data acquisition (DA) system used for bulk foam temperature.
Type T Thermocouples were used to monitor and record the temperature of the bulk foam for 60 minutes from the time of spray-applying the mixed A and B materials. The thermocouple was inserted through the sheathing in the middle of the 24 inch cavity to a height of 0.5 inch from the sheathing inner surface. The temperature was recorded at 1HZ. Type T thermocouples are made from Thermo Electric NN24T copper-constantan wire. The junction was made by twisting the bared wire ands and soldering. The thermocouple wire has an accuracy of 0.1°F.
A foam deflection force gage (FDFG) was constructed at the Climatic Laboratory in Ottawa by attaching an Omega LCFA-5, miniature compression load cell with load capacity of 5 lb, for both compression and tension directions, to a bracket (see Figure 2). An aluminum cylinder with a diameter of 1 inch was bolted to the LCFA. A hole approximately 1.1 inch in diameter was bored into the middle of the header of the 24 inch on center cavity. The bracket was bolted to the
Figure 2. LCFA-5 (1) attached to bracket (2). Cylinder (3) attached to LCFA-5.
Figure 3. FDFG sitting over an access hole in the top channel of a mock commercial wall. THERMAX™ brand insulation sheathing in the foreground.
header (see Figure 3). The aluminum cylinder height was adjusted such that the bottom edge of the cylinder was flush with the inner wall of the cavity. Aluminum tape was placed over the entire hole such that the cylinder was adhered to the tape and the tape extended 0.25 inch around the perimeter of the hole. The load cell pressure was recorded at 1HZ. The load cell has an accuracy of 0.2% and maximum safe overload of 150% of rated capacity.
A spray foam formulation is prepared by first combining all of the polyol component constituents, including the blowing agent. The formulation and polyisocyanate are then fed separately through a proportioning machine and a spray gun. For some of the spray-applied walls, the spray foam proportioner was the Gusmer FF 2500 and the gun used was the Glascraft Probler with 02 nozzle. For a number of the spray-applied walls the spray foam proportioner was the Glascraft MH and the gun used was the Glascraft Probler with a 02 nozzle. The hose length was 250 feet long (3/8” dia.) with a 10-foot whip hose (1/4” dia.). The rest of the spray-applied walls employed a GAMA Evolution G-250 H proportioner and the gun used was the Gaco D-gun with 70 mix chamber.
One (volume) part of isocyanate component is matched with one (volume) part of polyol component in the spray gun. The temperature of the environment and walls were 20-30°F and the relative humidity was kept between 40 and 60%. The spray was applied in a picture frame technique (see Figure 5). The picture frame technique is to first apply the liquid spray to the perimeter of the cavities created between the studs and the sheathing. The next step is to fill in the rest of the cavity to a nominal 2” of foam in one pass preferably from the top of the cavity to the bottom in a lateral motion.
The chemical temperature setting at the proportioner was approximately 130°F for both the polyol formulation and the polyisocyanate and the hose temperature setting was approximately 123°F. The temperature settings chosen along with the environmental conditions gave actual chemical temperatures at the gun about 10°F lower than the primary heater settings for short application times but similar temperatures as the primary heater settings for longer application times. The dynamic pressures of the chemicals were between 650 and 850 psi. A typical formulation gave a cream time of 0.5 seconds and foam rise time of 4 seconds.
The proportioner was in a trailer next to the building where the foam was being spray-applied to the mock walls such that the hose used to transfer the warmed chemicals to the spray gun experienced a variety of ambient temperature conditions. Any time the spraying stopped for more than 5 minutes, at least the material in the whip was purged prior to applying the foam to the walls.
2
3 1
16" 16" 48" 48" 96" 96" 24 24 " " 8" 8" 16"16" 48" 48" 96" 96" 24 24 " " 8" 8" 1 2 3 4 5 6 7 8 9 10 11 12
Figure 4. Schematic of mock walls – THERMAX™ brand insulation sheathing or OSB Substrates with 2X4 inch metal or wood studs, respectively.
Figure 5. Applicator using picture frame technique - spray-apply to perimeter of cavity followed by filling in the middle from top to bottom in a side to side mode.
RESULTS AND DISCUSSION
Cracks along the stud-mSPF interface of the exterior wall envelope can expose the wall to penetration by pollutants and incursion of air, water and moisture to the interior of the building. For example, infiltration from a crack as narrow as 10 mils (0.25 mm) will allow electrically neutral particles near 100% penetration between the ranges of 0.1 and 10 microns in diameter at as low as 4 Pa air pressure [3]. To minimize air and moisture intrusion through the mSPF, suppliers of systems commonly evaluate mSPF as a monolithic system using the method described in ASTM E 2178 Standard Test Method of Building Materials. If the air leakage measured does not exceed 0.02 L/(s●m2
) at the static pressure differential of 75 Pa for a one inch thick sample of foam, the foam is considered an air barrier [5].
The goal of the project that led to the creation of a method to determine stud line cracking in metal stud walls was to develop a closed cell, nominal 2 LB/FT3 density spray-applied polyurethane foam formulation (mSPF) that can be applied to wall cavities in winter season conditions. For most of the formulations evaluated the mSPF was applied to a nominal two inch thickness and to both metal and wood stud construction. The primary concern of the project was crack formation at the stud-mSPF interface in the cavities.
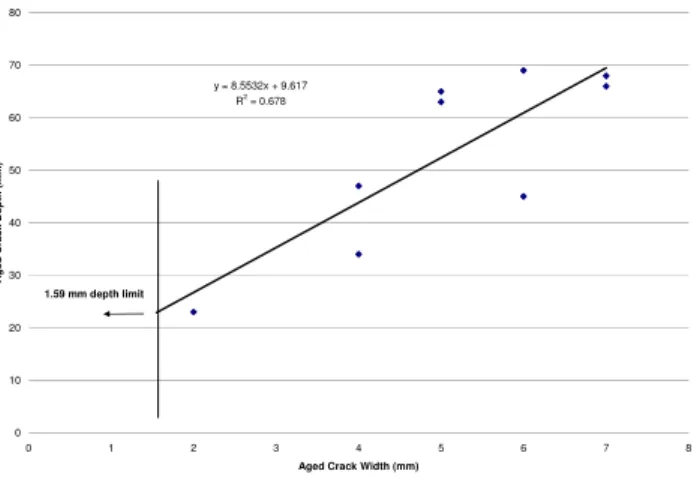
Narrow crack widths and short narrow cracks are known to occur at almost any substrate temperature and are attributed to contaminants on the surface of the substrate. For this project, a crack depth of >1 inch was arbitrarily chosen to constitute a formulation failure. A depth of one inch represented about ½ the depth of the spray-applied foam. To simplify failure analysis, a relationship between crack width and crack depth was determined. Crack depths were measured as a function of crack widths on 23 walls. The correlation is shown in Figure 6. The maximum acceptable crack width was found to be 0.067 inch (<1.7 mm). At 0.067 inch crack width, the crack depth was approximately 1 inch (25.4 mm).
y = 8.5532x + 9.617 R2 = 0.678 0 10 20 30 40 50 60 70 0 1 2 3 4 5 6 7 8
Aged Crack Width (mm)
Ag e d C rac k De p th ( m m ) 1.59 mm depth limit
Figure 6 Observation of Crack Depth with Crack Width
The measurement of crack widths, if present, for wood stud walls is straightforward. However, the metal studs used for commercial building are composed of c-channels. For the exposed flat side of the c-channel, crack widths analysis is strait forward. Unless the crack is very large, the observer cannot determine accurately whether there is a crack along the open side of the c-channel nor its width.
Dimensional stability has been of concern for the spray-applied polyurethane foam industry as blowing agents phase out of use in the construction industry [6]. Stud line cracking can be considered an early dimensional stability issue. Once the foam has expanded and the reaction exotherm is nearly complete the foam begins to cool. The cooling foam begins to shrink and potentially pull away from the substrate. Shrinkage of polymer foams are known and can be attributed to cooling and pressure drop of the blowing agent[7], conversion of starting materials to polymeric, thermal contraction[8] and loss of blowing agents leading to slight vacuums[9]. When developing a new formulation, one of the important parameters needed by the formulator is the target lower substrate temperature limit for the system. The substrate temperature and the substrate thermal mass can affect post application shrinkage [10, 11]. The tensile strength of the newly formed foam will determine whether the shrinkage will lead to delamination.
Attempts to measure dimensional stability under winter conditions in our lab included placing molds in freezers and once the equipment was ready, removing the molds from the freezer prior to spray-applying the SPF system. The difficulty encountered was condensation of moisture onto the surface of the mold, during seasons at high humidity. The lack of space was also problematic as the experimental designs were expanded into large scale mock walls.
The decision was made to engage the NRC of Canada’s Center for Surface Transportation Technology which included a Climatic Lab in Ottawa. The Climatic Lab has the ability of controlling temperature and humidity of several large conditioned rooms. An extensive data collection system was also available.
The Foam Deflection Force Gauge (FDFG) was developed to evaluate the compressive (foaming) and tensile (shrinking) forces of the foam forming system when spray-applied to the mock walls with metal studs composed of c-channels. The intent was to find a correlation between the forces and stud line cracking. The in-situ dimensional stability tool was also to be used as a pass/fail device for a formulation where delamination from the FDFG was considered a failure.
The force measurements of the expanding foam against the studs required a customized measuring device in the absence of an off the shelf solution. Various FDFG designs were constructed and the final design used for the work of developing a winter season spray-applied polyurethane formulation is shown in Figure 4.
The chosen load cell, LCFA-5, is sensitive to lateral forces which were present due to the initial design set. Two instances of lateral forces were noted during early design work from foam formation. The first was a simple jamming issue. The cylinder was attached to the bolt on the bottom of the LCFA-5 such that the height of the cylinder was adjustable. An adjustable height allowed the bottom of the cylinder to be lined up with the inner wall of the metal c-channel. A small gap was necessary between the cylinder and the c-channel to allow free movement of the cylinder. However, on several occasions, foam would expand into the small gap between the cylinder and the c-channel. As the foam expanded, it would push against the cylinder but upwards and laterally jamming it against the c-channel edge. The lateral forces were large enough to bend the bolt holding the cylinder to the LCFA-5.
To resolve the intrusion of the foam into the narrow opening, an aluminum tape was placed over the cylinder and hole such that the gap was no longer exposed to the foam. The thin aluminum tape proved to be flexible enough to allow the
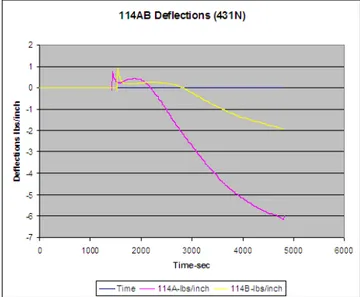
Figure 7. Example of lateral force on FDFG (top curve) and no lateral force (lower curve)
Figure 8. Uniform coverage of FDFG tape (first cure - 114A) vs non-uniform coverage (114B)
observation of the forces acting upon the FDFG. Figure 7 graphically exhibits the affect of the lateral forces on the force analysis of developing foam. For the top curve (sprayed minutes after the first) the cylinder has been pushed against the c-channel wall preventing the cylinder from being pulled inward by the contracting foam at the same rate as the cylinder from the first wall. The FDFG indicated that for this sample both walls exhibited delamination from the studs (specifically the FDFG device at the 24 o.c. cavity) which for this study was an indication of failure. When the tensile or pull forces return to zero, delamination has occurred and is quite often accompanied by load popping noises. Subsequently, all measurements were taken with aluminum tape applied to the inside of the header.
A second source of lateral error was due to applicator error. If the applicator of the spray-applied spray polyurethane foam did not completely and evenly cover the FDFG tape, the expansion and contraction forces were uneven. The affect of under-covering the FDFG tape can be shown in Figure 8. For the under-covered sample, 114B, the amount of bulk foam is less, which reduces the total pull force against the FDFG. During the curing stage of the two walls, the expectation was that the wall, 114B, would fail and delaminate from the FDFG. The thought was that with less foam, the heat of exotherm would be reduced and therefore the green strength of the foam would be poor. However the wall did not fail. After reviewing the chemical temperatures between the two walls, it was found that the second wall was spray-applied about 5°F higher in temperature than the first wall which may have compensated for the potential exotherm heat loss.
The FDFG and roll of aluminum tape were allowed to acclimate to the environmental conditions used for the evaluation prior to being attached to the mock walls. Hand gloves were found to be necessary when cutting and attaching the tape to prevent the fingers from warming the tape. On each installation of the FDFG, force measurements were recorded for about 15 to 30 minutes before spray application of the system in order to determine any drift errors due to installation. The drift errors were usually measured to be negligible. See the first 1000 seconds of Figure 8 as an example of the flat baseline for the forces on the instrument during the first few minutes of environmental acclimation.
Different measurement ranges of load cells were evaluated initially. The LCFA-5, with a 5 LB load capacity, was selected as it provided the best combination of sensitivity and protection against overloading. Several sensors were damaged that had lower than a 5 LB load capacity.
The thermal mass can increase at the headers and footers of walls due to construction techniques. Also, the width of walls does not always fall at 16 inch on center but can be narrower near a wall penetration or up to 24 inch on center for some construction techniques. The mock walls (both wood stud and metal stud) were built to a nominal four feet wide by eight feet. Each wall contained three cavities and the headers for the walls were doubled in thickness by using two studs. The walls were constructed with three different cavity widths – 8, 16 and 24 inch on center. Each stud face within each cavity were given a number to correspond with its position. The numbers were from 1 to 12 as shown in Figure 4. The thermal mass of the headers was increased for all walls by adding an extra piece framing member to the top. The footers were always resting on the concrete floor. The walls were cooled to either 20 or 30°F (-6.7 or -1.1°C) prior to applying a variety of mSPF formulations – both experimental and commercial. According to the Quantile plot in Figure 11 for wood stud walls with OSB sheathing, the most likely locations for the crack to form was at positions 1, 2 and 3 – all studs associated with the 8 inch on center cavity.
Figure 9 Failed Formulations - Distribution of Failure Time (min) on y-axis for Wood Stud walls
Figure 10. Affect of wet metal studs on the pressure profile.
The foam network structure was at its weakest early after application. To demonstrate this finding, the time-to-failure distribution of the set of wood stud walls evaluated is shown in Figure 9 for both the experimental and commercially available foam systems.
75% of the walls that exhibited cracks, cohesively failed within 30 minutes. The only time adhesive failure between the foam and the substrate was observed was when water had condensed onto the substrate surface prior to spray-applying the system. The affect on the foam pressure profile for a formulation with and without the presence of the moisture in the form of ice on the metal studs is shown in Figure 10.
The substrate application temperatures were only 10°F apart and yet both walls with the wet metal studs delaminated from the FDFG. Delamination is observed when the pressure returns to the pre-application pressure. Note that curve 106A of Figure 10 exhibited a sudden increase in tensile pressure on the FDFG. This phenomenon has been exhibited on a number of samples and is potentially due to the release of some lateral force around the sensor allowing a more true analysis of the tensile forces on the wall from the shrinking foam. Considering that the foam is spray-applied by hand, uneven application of the foam may shift the sensor slightly during the initial foam expansion.
The walls that exhibited cracks at 60 minutes are those walls whose vertical studs were hit with a fist at the 60 minute mark. Contractors and local code officials in Canada often hit the studs in the winter to determine if there is a possibility of crack formation occurring during the evening hours when the temperature drops. About 25% of the wood stud walls that exhibited cracks failed due to the post striking technique at 60 minutes.
Within the 60 minutes time frame (spray application to hitting the walls), the highest numbered crack position was noted for the wood stud walls and is shown in Figure 11. Generally, if a crack was observed at position five, then cracks were also observed at positions 1-4. The majority of the cracking occurred at the eight inch on center cavity.
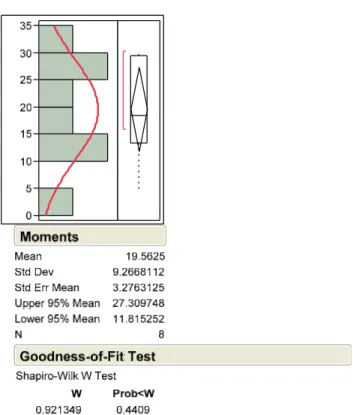
For the steel stud walls, the FDFG was solely relied on for pass or fail determination. Sometimes the sensors were allowed to stay on the walls longer than 60 minutes. The distribution of time to failure for the steel stud walls is shown in Figure 12.
According to Figure 12, the failures occurred within about 30 minutes of the application in a normally distributed manner. The result is similar to that found with the wood stud walls in Figure 9.
The crack position of the steel stud walls were noted only at positions 2 and 4. These positions corresponded to the side of the c-channels that were flat. Further cracking could have occurred in other positions but could not be verified. Of the steel stud walls where some cracking was noted, the width of the cracks were less than 25 mils and 5/6 times the cracking was observed only after hitting the foam at the 60 minute mark. The FDFG was always disconnected prior to hitting the walls. When cracking was observed prior to the 60 minute mark the FDFG indicated delamination 2/3 times. Of the 36 total steel stud walls that were evaluated in the 20-30°F substrate temperature range for one study, all visually passed the winter weather criteria for cracking. However, the FDFG indicated delamination in 11 instances or 31% failures. When cracking occurs at a stud-foam interface audible snapping emanates from the walls. For wood stud walls, the snapping sounds and the crack development can be tracked with ease. Our experience has been that the louder the snap the wider the crack width.
0 1 2 3 4 5 6 7 8 9 10 11 - 1.64- 1.28 - 0.67 0.0 0.67 1.28 1.64 0.5 0.8 0.9 0.2 0.1 0.95 Normal Quanti le Pl ot
Figure 11. Quantile Plot for Crack Location. The highest stud position for crack formation is shown on the y-axis.
Figure 12. Test of Normal Distribution of Time to Failure for Steel Stud Walls using the FDFG.
For the steel stud walls the snapping may have been attributed to metal on metal slipping due to thermal expansion and contraction or simply minor crack formation. However, the FDFG confirms that the stud-foam interface is delaminating.
Wood stud walls that did not indicate stud line cracking in the first hour were rechecked for cracks after about one month stored at ambient conditions. No new cracks were observed despite the fact that the walls were stacked and shipped prior to re-checking for cracks. Out of the 23 wood stud walls that had exhibited cracking in the first hour, only 12 out of 23 continued to show cracks along the studs after aging. The ones that self re-sealed exhibited early cracking at <60 mils
Figure 13 Starting Thicknesses for Samples that Re-Sealed (dark areas) versus those that Continued to Exhibit Cracks
DOW CHEMICAL CLIMATE ROOM TESTS
May 25, 2009, Runs 14, 15 & 16 DOW 381, OAT = 30°F 10 20 30 40 50 60 70 80 90 100 110 120 130 140 150 14:40 14:45 14:50 14:55 15:00 15:05 15:10 15:15 15:20 15:25 15:30 Time of Day Te mpe rat u re ( F ) TC_1 TC_2 TC_3 TC_4 TC_5 TC_6 Gun_T_1 Gun_T_2 TC_1 - Run 14A - TWS TC_2 - Run 14B - TWS TC_3 - Run 15A - OSB TC_4 - Run 15B - OSB TC_5 - Run 16A - XPS TC_6 - Run 16B - XPS
mock wall - THERMAX™ Sheathing Attached to Steel Studs
mock wall - STYROFOAM™ XPS Attached to Wood Studs
mock wall - OSB Attached to Wood Studs Chemical Temperatures Prior to Spray-gun
Figure 14 Spray Gun Chemical Temperature and Mock Wall Bulk Foam Temperature over time
of the lost gases in the foam during the initial foaming processes with air. Therefore, post deconstruction to check for cracking in steel stud walls would have minimal value.
Each time a unique foam formula was spray-applied, two mock metal stud wall cavities were instrumented with the FDFG and thermocouple at the widest cavity to measure the force and bulk temperature values over a period of 60 minutes. In a previous set of experiments, several mock walls exhibited failure on one of the two walls per delamination from the FDFG. The results were unexpected and a hypothesis was that the chemical temperature was not at the desired setting at least for the first wall that was spray-applied. For the current set of experiments, an adaptor was attached between the whip and the spray gun to measure the actual chemical temperature of both the polyisocyanate and the polyol system.
The use of the adaptor and data acquisition system allowed the chemical temperatures to be monitored closely prior to spray-applied application of the formulations to the mock walls. A typical trace of chemical temperature and bulk foam temperature for a sample spray-applied to several mock walls within a short time is shown in Figure 14.
While the applicator was waiting to spray the first wall, the spray gun and hose sat on the concrete floor of the room, which in this example was at 30°F. As soon as the applicator began to spray, the chemical temperature began to rise in the gun. For the first wall sprayed, 14A (THERMAX™ brand insulation sheathing over steel studs), the chemical temperatures were at their lowest values. The maximum exotherm temperature reached for the first wall was considerably less than for the second wall (14B) and was attributed to the fact that the chemical temperature had risen by about 10°F verses the application of the first wall.
As the applicator continued to spray the rest of the walls, the chemical temperatures maintained a relatively constant temperature of about 110°F which was the targeted temperature for this application. Once the last monitored wall at 30°F was completed, the spray gun was set on the floor prior to spraying the non-monitored walls. While the gun was on the floor, the chemical temperatures dropped to as low as 100°F.
The differences in the application temperatures on the two walls had a dramatic affect on the pressure profile obtained using the FDFG for those walls (Figure 15).
The second wall (14B), spray-applied at 8-10°F higher chemical temperature had very minimal tensile pull indicating a higher extent of reaction and therefore improved dimensional stability as the foam cools. Neither wall exhibited delamination from the FDFG and therefore both passed the evaluation but the affect of chemical temperature was probably the cause of inexplicable failures in previous studies.
Pressure Profile from the FDFG for Mock Walls THERMAX(tm) Over Steel Stud Walls at 30F Substrate
Temperature -0.40 -0.30 -0.20 -0.10 0.00 0.10 0.20 0.30 3000 4000 5000 6000 7000 8000 14A-lbs/inch 14B-lbs/inch Figure 15. Affect of Chemical Temperature on
Pressure Profile from FDFG. 0
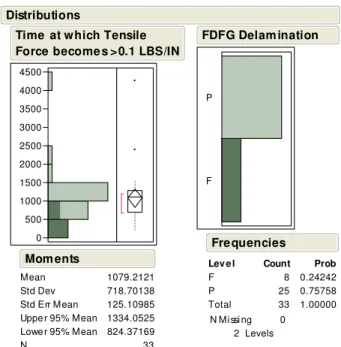
500 1000 1500 2000 2500 3000 3500 4000 4500 Mean Std Dev Std Err Mean Uppe r 95% Mean Lowe r 95% Mean N 1079.2121 718.70138 125.10985 1334.0525 824.37169 33 Mom ents
Time at which Tensile Force become s >0.1 LBS/IN
F P F P Total Lev e l 8 25 33 Count 0.24242 0.75758 1.00000 Prob N Mi ssi ng 0 2 Levels Fre quencies FDFG Delam ination Distributions
Figure 16. Distribution of Time to Reach a Drop of 0.1 LBS/IN and the frequencies of passes vs failures.
From Figure 15, one can see that the time spent above 0.1 LBS/IN, an arbitrarily chosen change in pressure from the beginning value, was twice as long for wall 14B versus wall 14A. Of the mock steel stud walls evaluated the distribution of times to reach a drop of 0.1 LBS/IN was plotted and shown in Figure 16. The shaded areas indicate the walls that failed or exhibited delamination from the FDFG and how much time the foam spent at a relatively high force (a drop from the start of spraying of less than 0.1 LBS/IN). Clearly if the tensile pull occurs too soon, the foam will fail.
CONCLUSIONS
The Foam Deflection Force Gauge (FDFG) has been developed to investigate in-situ the dimensional stability of freshly spray-applied mock walls built with steel studs. With the FDFG, the intermediate scale test using 4X8 foot mock walls gave real time pressure profiles of the expanding and gelling polyurethane foam. The FDFG, which employs a modified miniature compression load cell to evaluate the forces applied to the studs, was able to significantly reduce the number of false positives for steel stud walls where stud line cracking was difficult to observe.
The FDFG can be constructed using commercially available components and can be used to evaluate foam forming characteristics. The FDFG was especially useful in this study when intermediate-scale sized mock walls with steel studs were the substrate and commercial-scale spray application equipment was employed. The device gave information about dimensional stability of the green foam – or foam early in the curing process. Coupled with bulk foam temperature analysis and chemical temperature monitoring at the spray gun, the modified dimensional stability test was successfully utilized to develop a spray-applied polyurethane foam insulation that can be applied in winter like conditions.
REFERENCES
1. Definitions, 2009 International Building Code, Section 1402.1, 2009 (second printing).
2. “Heat-Air-Moisture Transport, Measurement on Building Materials,” in ASTM Stock Number STP1495, Mukhopadhyaya, and Kumaran, eds., ASTM, 2007
3. Liu, D-L., Nazaroff, W. 2003. “Particle Penetration through Building Cracks,” Aerosol Science and Technology, 37, 565-573.
4. “Spray Polyurethane Foam for Residential Building Envelope Insulation and Air Seal,” in AY-112. 1994, Spray Polyurethane Foam Alliance, May 11, 2010, http://www.sprayfoam.org/uploads/pages/4480/AY%20112.pdf
5. “Standard Test Method for Air Permeance of Building Materials”, in ASTM E 2178-03, ASTM International, pg 5, 2003.
6. Sato, H., Suzuki, C., Tanaka, H., Tsukido, N. and Takeyasu, H. 1999. “Novel Polyols for All Water-Blown and HCFC-141b Blown Rigid Polyurethane Foams,” presented at the Polyurethanes Expo’99, September, 12, 1999, page 209. 7. Grunbauer, et.al.. 2004. in Polymeric Foams, Mechanisms and Materials, Lee and Ramesh, eds., CRC Press, pg 303. 8. Ashby, M. 1999. Materials Selection in Mechanical Design, 2nd ed., Butterworth Heinemann, pg 50.
9. Szycher, M. 1999. Szycher’s Handbook of Polyurethanes, CRC Press, pg 8-27
10. Nagi, Satsuo; Hirata, Masatoshi. May 28, 2009. in Japanese patent application Spraying Method for Polyurethane
Foams to Form Thermally Insulating, Layers with Suppressed Shrinkage and Air Pockets, JP 2009114342A.
11. Sato, Hisashi; Bin, Kokun; Takeyasu, Hiromitsu; Aoyanagi, Minako. April 16, 1996. in Japanese patent application
Steven Crain
Mr. Crain is a Technology Development Leader in the Dow Building Solutions of The Dow Chemical Company. He received his Bachelors of Science degree from Michigan State University in 1983. He has conducted product and process research in styrenics and urethanes for over twenty seven years. Steve has worked on a number of urethane related projects in the thermoplastic urethane,
isocyanurate board stock and spray polyurethane insulation fields for the last 10 years. He has co-authored six technical papers and holds four U.S. patents.
Dalwinder Gill
Mr. Gill is a test and measurement technologist with National Research Council of Canada. He holds an Electronics Engineering Technologist Diploma from Southern Alberta Institute of Technology. He has worked with a calibration lab and global high tech firm. He has over 18 years experience in the field of electrical, mechanical and optical metrology. He has developed many test and calibration methods for unique setups and written corresponding procedures.
Medhat Hanna
Mr. Hanna is the project manager for the Climatic Engineering Division of the National Research Council of Canada. Mr. Hanna has over 15 years of experience in consulting, manufacturing, research, and project management in the rail, aerospace, and high-tech sectors. He holds a Bachelor’s Degree in Mechanical Engineering from Concordia University in Montreal, Quebec, and a Professional Engineering license from the Order of Engineers of Quebec. He has co-authored over 15 technical research papers published by the Federal Aviation Administration (FAA) and Transport Canada (TC) in the field of Aircraft Ground Deicing. He also prepared dozens of technical reports related to environmental testing projects.
Donald Leblanc
As General Manager of the Climatic and Environmental Engineering Division, Mr. LeBlanc is responsible for the business development and operation of CSTT’s Climatic and Environmental Engineering Division in Ottawa. In addition to his twelve years at CSTT as manager of the environmental facilities, he has over twelve years of experience in private sector test engineering, including testing in material research, packaging and product design. Mr. Leblanc is accredited with a P.Eng from the Association of Professional Engineers of Ontario. He is also a member of The Engineering Society for Advanced Mobility Land Sea Air and Space (SAE), the Institute of Environmental Sciences and Technology (IEST) and of the American Society of Heating, Refrigerating & Air-Conditioning Engineers, Inc (ASHRAE).