Publisher’s version / Version de l'éditeur:
Journal of the American Chemical Society, 132, 26, pp. 9020-9029, 2010-06-15
READ THESE TERMS AND CONDITIONS CAREFULLY BEFORE USING THIS WEBSITE. https://nrc-publications.canada.ca/eng/copyright
Vous avez des questions? Nous pouvons vous aider. Pour communiquer directement avec un auteur, consultez la première page de la revue dans laquelle son article a été publié afin de trouver ses coordonnées. Si vous n’arrivez pas à les repérer, communiquez avec nous à PublicationsArchive-ArchivesPublications@nrc-cnrc.gc.ca.
Questions? Contact the NRC Publications Archive team at
PublicationsArchive-ArchivesPublications@nrc-cnrc.gc.ca. If you wish to email the authors directly, please see the first page of the publication for their contact information.
NRC Publications Archive
Archives des publications du CNRC
This publication could be one of several versions: author’s original, accepted manuscript or the publisher’s version. / La version de cette publication peut être l’une des suivantes : la version prépublication de l’auteur, la version acceptée du manuscrit ou la version de l’éditeur.
For the publisher’s version, please access the DOI link below./ Pour consulter la version de l’éditeur, utilisez le lien DOI ci-dessous.
https://doi.org/10.1021/ja101001t
Access and use of this website and the material on it are subject to the Terms and Conditions set forth at
Characterizarion of single-walled carbon nanotubes by scanning
transmission x-ray spectromicroscopy: purification, order and dodecyl
functionalization
Najafi, Ebrahim; Wang, Jian; Hitchcock, Adam P.; Guan, Jingwen;
Denommee, Stephane; Simard, Benoit
https://publications-cnrc.canada.ca/fra/droits
L’accès à ce site Web et l’utilisation de son contenu sont assujettis aux conditions présentées dans le site LISEZ CES CONDITIONS ATTENTIVEMENT AVANT D’UTILISER CE SITE WEB.
NRC Publications Record / Notice d'Archives des publications de CNRC:
https://nrc-publications.canada.ca/eng/view/object/?id=cadae2b9-ec97-41af-9095-33f87fa9a940 https://publications-cnrc.canada.ca/fra/voir/objet/?id=cadae2b9-ec97-41af-9095-33f87fa9a940Characterization of Single-Walled Carbon Nanotubes by
Scanning Transmission X-ray Spectromicroscopy:
Purification, Order and Dodecyl Functionalization
Ebrahim Najafi,†Jian Wang,†Adam P. Hitchcock,*,†Jingwen Guan,‡Stephane De´nomme´e,‡and Benoit Simard‡
Brockhouse Institute for Materials Research, McMaster UniVersity, Hamilton, Ontario L8S 4 M1, Canada, and Steacie Institute for Molecular Sciences, National Research Council of
Canada, Ottawa, Ontario K1A 0R6, Canada Received February 10, 2010; E-mail: aph@mcmaster.ca
Abstract:The C 1s X-ray absorption spectra of several isolated bundles of single-walled carbon nanotubes (SWCNT) have been measured using scanning transmission X-ray microscopy. First the C 1s and O 1s spectra of a purified but unfunctionalized SWCNT were measured. The C 1s f π* transition at 285 eV exhibited almost as strong a dichroic effect (spectral dependence on orientation) as that found in multiwalled carbon nanotubes (Najafi; et al.Small 2008, 7, 2279-2285). Second, purified SWCNT were functionalized with dodecyl and then investigated by STXM. Spectral evidence for the dodecyl functionalization is presented and discussed in comparison to the X-ray absorption spectra of aliphatic hydrocarbons. Both orientation and functionalization mapping of an individual SWCNT bundle is demonstrated.
1. Introduction
Carbon nanotubes (CNT) are often regarded as building blocks for nanotechnology, thanks to their exceptional electronic, physical, and mechanical properties. CNT are versatile materials that show promise for a wide range of applications, including electron channels in electronic devices,1field emitters in field emission displays,2or reinforcing fillers in composite materials.3 However, many of these applications are restricted by the limited solubility of carbon nanotubes in most organic and inorganic solvents.
CNT have inert surfaces and tend to agglomerate in solutions, making further processing hard or even impossible.4To improve their solubility and achieve their full potential CNT are often functionalized through chemical reactions. Chemical function-alization modifies the physical and chemical properties of the tubes. For instance, functionalized tubes can have enhanced interfacial interactions with polymer matrices, modified electrical and thermal conductivity, and modified mechanical strength of composite systems.5-7 Defects are produced on CNT during
functionalization. These defects act as scattering centers for electrons and phonons, thereby impairing the electrical and thermal conductivity of individual tubes.8,9For some applica-tions such as chemical sensors, defects are advantageous since they can increase the sensitivity of the CNT to certain species by modifying band structures.10,11
In order to fabricate high-performance devices, controlled treatment of tubes is crucial to obtain a certain level of dispersion and processability while preserving structural integrity. Opti-mization of a given functionalization requires post-treatment analysis of the CNT by spectroscopy and microscopy. Spec-troscopic methods such as Raman, X-ray photoemission (XPS), and X-ray absorption fine structure spectroscopy (NEXAFS) probe a large sample area, and therefore, the information that they provide is the average property of the batch. However, spectromicroscopy techniques can probe individual tubes or bundles at high spatial resolution. Previously, Suenaga et al.12 used electron energy loss spectroscopy (EELS) in a transmission electron microscope (TEM) to map Gd atoms inside a single chain of metallofullerene molecules generated within a SWCNT. TEM-EELS can distinguish between atoms with small differ-ences in atomic number. However, TEM-EELS has limited energy resolution; therefore, it typically has difficulties identify-ing organic molecules that may exist on or inside the tubes. †Brockhouse Institute for Materials Research, McMaster University.
‡Steacie Institute for Molecular Sciences, National Research Council
of Canada.
(1) Postma, H. W. Ch.; Teepen, T.; Yao, Z.; Grifoni, M.; Dekker, C.
Science 2001, 293, 76–79.
(2) Fan, S.; Chapline, M. G.; Franklin, N. R.; Tombler, T. W.; Cassell, A. M.; Dai, H. Science 1999, 283, 512–514.
(3) Xu, X. B.; Li, Zh.-M.; Shi, L.; Bian, X. Ch.; Xiang, Zh. D. Small
2007, 3 (3), 408–411.
(4) Bahr, J. L.; Mickelson, E. T.; Bronikowski, M. J.; Smalley, R. E.; Tour, J. M. Chem. Commun. 2001, 2, 193–194.
(5) Najafi, E.; Kim, J.; Han, S. H.; Shin, K., Colloids Surf., A 2006,
284-285, 373–378.
(6) Ganguli, S.; Roy, A. K.; Anderson, D. P. Carbon 2008, 46 (5), 806– 817.
(7) Byrne, M. T.; McNamee, W. P.; Gun’ko, Y. K. Nanotechnology 2008,
19, 1–8.
(8) Charlier, J. C. Acc. Chem. Res. 2002, 35, 1063–1069.
(9) Hone, J.; Whitney, M.; Piskoti, C.; Zettl, A. Phys. ReV. B 1999, 59 (4), R2514–R2516.
(10) Collins, Ph. G.; Bradley, K.; Ishigami, M.; Zettl, A. Science 2000,
287, 1801–1804.
(11) Valentini, L.; Mercuri, F.; Armentano, I.; Cantalini, C.; Picozzi, S.; Lozzi, L.; Santucci, S.; Sgamellotti, A.; Kenny, J. M. Chem. Phys.
Lett. 2004, 387, 356–361.
(12) Suenaga, K.; Tence, M.; Mory, C.; Colliex, C.; Kato, H.; Okazaki, T.; Shinohara, H.; Hirahara, K.; Bandow, S.; Iijima, S. Science 2000,
290, 2280–2282.
Published on Web 06/15/2010
10.1021/ja101001t 2010 American Chemical Society
Furthermore, the electron beam that probes the sample causes severe structural damage even in short spectroscopic exposures, especially at high beam energies where the best spatial resolution is typically achieved.
Recently, scanning transmission X-ray microscopy (STXM) has been applied to study individual multiwalled carbon nanotubes (MWCNT) in order to characterize and differentiate commercial products in the market,13,14 and to map defect distributions quantitatively using the linear dichroism of the C 1s fπ* transition (285 eV).15-17STXM is a synchrotron-based technique that combines NEXAFS spectroscopy18and micros-copy with a spatial resolution currently routinely better than 30 nm.19,20NEXAFS spectroscopy was used by Banerjee et al.21 to identify functional groups on CNT following exposure to UV-generated ozone. They could identify various oxygenated moieties by their C 1s and O 1s spectral signatures.
Here, we have investigated a number of aspects of SWCNT, including their purification, order, and dodecyl functionalization, using NEXAFS spectroscopy of individual bundles, measured in a STXM. Image sequences were measured at the carbon and oxygen edges. Fits of these sequences to appropriate reference spectra provide maps that visualize various components of the bundles. In addition, the linear dichroism of the SWCNT bundles was explored and compared to that of our previous studies of the linear dichroism of MWCNT.13-17 A surprisingly large linear dichroism was observed.
2. Experimental Section
SWCNT were synthesized using the double-laser-oven approach as described in our previous publication.22
Briefly, an inert environment of flowing Argon (250 SCCM) was maintained through a 45-mm inner diameter quartz tube fitted with a Brewster window. A gas inlet was positioned at one end, while a sample collector and a pumping port were placed at the other end. The pressure and temperature inside the quartz tube were maintained at 500 Torr and 1450 °C, respectively, throughout the process. Two types of lasers were used. The first was a nanosecond-pulsed Nd: YAG laser (Spectra-Physics Pro 290-30) operating at 1064 nm and 30 Hz with a fluence of approximately 2 J cm-2/pulse. This laser
vaporized the target which was graphite doped with 0.6% in atoms each of cobalt and nickel. The second laser was a Nd:YAG laser (Spectra-Physics Tornado S240-TN50-106Q), operating either continuously (CW) or at 20 kHz, at a wavelength of 1064 nm and measured average powers of 50 or 48 W. This laser was used to alter the rate of cooling of the condensing plume generated by the vaporizing laser. The raw product from this process contained SWCNT, metal particles from the catalyst used, and other carbon impurities including amorphous and onion-like graphitic carbon
particles as well as quartz glass debris from the quartz tube.23
Onion-like particles are graphitic impurities that are always produced during SWCNT growth.
The pristine (as-produced, without any purification) SWCNT were subsequently purified by a procedure referred to as WCPP (wet chemical purification procedure) developed at Steacie Institute for Molecular Sciences, National Research Council of Canada (NRC-SIMS).24
Briefly, this procedure employs sonication-centrifugation cycles in the following order of solvents: toluene to remove fullerenes, N,N-dimethylformamide (DMF) to remove amorphous carbon, methanol (MeOH) to remove residual DMF, and finally 2 N HCl aqueous solution with MeOH to remove residual metal catalyst. After the WCPP purification the sample was thoroughly washed with water and methanol and oven-dried. This purification procedure produces a material which is pure enough for general applications (>90 wt % SWCNT).24
More recently, we have also followed the WCPP with a hard baking (HB) procedure to further remove the remaining onion-like graphitic carbon impurities. Briefly, WCPP-purified SWCNT was placed on a centrally mounted fritted coarse disk in a quartz tube assembled vertically into a tube furnace (22 mm diameter or larger, depending on the quantity of the sample). Argon gas was passed through a hot water bubbler then through the WCPP-SWCNT, with the tube heated to 850 C. After cooling to room temperature under argon flow, the sample was resubjected to part of WCPP. This process (named Hard Baking) can be repeated on the basis of the analysis of the sample and purity required. The combined WCPP-HB procedure achieves a higher-purity product than WCPP alone. The advantages of the WCPP and the combined WCPP-HB purification procedures include simplicity, scalability, very high purity, and high yields; furthermore, the procedure does not cause obvious side-wall damage or functionalization.
For this work, WCPP-SWCNT were functionalized with dodecyl by reductive alkylation using Li and 1-iodo-dodecane according to the procedure reported by Liang et al.25
More precisely, into a 500-mL round-bottom Schlenk flask maintained at dry ice-acetone temperature (-78 °C) was added 25 mg of fine SWCNT powder to 350 mL of liquid ammonia. Subsequently, 70 mg of small pieces of Li foil was added into the flask under magnetic stirring. The mixture turned ink-blue instantly, and the SWCNT-
-Li+
intercala-tion complex was observed as a golden deposit on the wall of the flask. After stirring for one hour, 1.8 mL of 1-iodo-dodecane was injected. The mixture was stirred for an additional 6 h at -78 °C after which the mixture was warmed to room temperature. During this process the ammonia slowly evaporated, leaving a solid gray residue. The residue was slowly diluted with 20 mL of methanol followed by 20 mL of water under nitrogen. The mixture was sonicated for 20 min and filtered through a polycarbonate membrane (>20 µm pore size). The filtrand was washed sequentially with water, 2 N HCl, water, ethylacetate, methanol, and hexane. The wet solid was quite soluble in THF, and the resulting solution was stable for a few weeks after which gradual agglomeration occurred. It is difficult to redisperse the agglomerated SWCNT precipitate back into the same mother liquor.
Raman spectra were recorded on a custom-built spectrometer consisting of an Ar+
Spectra-Physics Laser (model 277-GA04), a WiTec confocal microscope fiber-coupled to an Acton 2500i spectrograph fitted with a Roper Scientific CCD array detector. Measurements were carried out using 514.5 nm excitation attenuated to a power density well below 2 kW cm-2at the sample to avoid
laser heating effects. In addition, a neutral density filter was applied as needed to further reduce the laser power. Raman samples were (13) Felten, A.; Hody, H.; Bittencourt, C.; Pireaux, J.-J.; Hernandez-Cruz,
D.; Hitchcock, A. P. Appl. Phys. Lett. 2006, 89 (093123), 1–3.
(14) Felten, A.; Bittencourt, C.; Pireaux, J. J.; Reichelt, M.; Mayer, J.; Herna´ndez-Cruz, D.; Hitchcock, A. P. Nano Lett. 2007, 7, 2435–2440.
(15) Najafi, E.; Hern, 940 > andez; Cruz, D.; Obst, M.; Hitchcock, A. P.; Douhard, B.; Pireaux, J.-J.; Felten, A Small 2008, 4, 2279–2285.
(16) Hitchcock, A. P.; Najafi, E.; Hern, 940 > andez; Cruz, D.; Obst, M.; Felten, A.; Douhard, B.; Pireaux, J.-J. Microsc. Microanal. 2008, 4 (S-2), 190–191.
(17) Felten, A.; Gillon, X.; Gulas, M.; Pireaux, J.-J.; Ke, X.; Van Tendeloo, G.; Bittencourt, C.; Kilcoyne, A. L. D. ; Najafi, E.; Hitchcock, A. P., ACS Nano (in review)
(18) Sto¨hr, J. NEXAFS Spectroscopy; Springer-Verlag: Berlin, 1992. (19) Ade, H.; Hitchcock, A. P. Polymer 2008, 49, 643–675.
(20) Hitchcock, A. P.; Dynes, J. J.; Johansson, G. A.; Wang, J.; Botton, G. Micron 2008, 39, 741–748.
(21) Banerjee, S.; Hemraj-Benny, T.; Balasubramanian, M.; Fischer, D. A.; Misewich, J. A.; Wong, S. S. Chem. Commun. B 2004, 772–773.
(22) Kingston, C. T.; Jakubek, Z. J.; De´nomme´e, S.; Simard, B. Carbon
2004, 42, 1657–1664.
(23) Bendjemil, B.; Borowiak-Palen, E.; Graff, A.; Pichler, T.; Guerioune, M.; Fink, J.; Knupfer, M. Appl. Phys. A 2004, 78, 311–314. (24) Jakubinek, M. B.; Johnson, M.; White, M. A.; Guan, J. W.; Simard,
B. J. Nanosci. Nanotechnol. 2010. In press. More details of WCPP will be published elsewhere.
(25) Liang, A.; Sadana, K.; Peera, A.; Chattopadhyay, J.; Gu, Z.; Hauge, R. H.; Billups, W. E. Nano Lett. 2004, 4, 1257–1260.
prepared by sonicating a few milligrams of SWCNT in a few milliliters of methanol in a sonication bath for 15 min.
Thermogravimetric (TG) analysis of nanotube samples was performed on a Netzsch TG 209 F1 Iris with simultaneous coupling of an Ae¨olos QMS403C mass spectrometer and a Bruker Tensor 27 Fourier Transform Infrared (FTIR) spectrometer via a TGA A588 TGA-IR module. The system was run with BOC UHP argon (5.3) gas; residual oxygen was trapped with a Supelco Big-Supelpure O oxygen/water trap. The transfer lines between the TG instrument, mass spectrometer, the FTIR spectrometer and the IR cell were all heated to a temperature of 200 °C. Operation details for the TG analysis can be found in the Supporting Information.
IR and mass spectral data were collected concurrently with the TGA data. IR data were collected from 4500 to 500 cm-1 at a
resolution of 4 cm-1. The integration ranges used for analysis of
specific chemical signatures in the IR data were: 2402-2242 cm-1
for CO2, 3026-3002 cm
-1for the Q-branch of methane, 3001-2850
cm-1for the P-branch of methane, 3042-2788 cm-1for total CH,
and 2849.83-2787.89 cm-1 for low-frequency CH (CH outside
the P-branch of methane). Mass spectra were recorded from 1 to 80 mass units.
TEM images were obtained using a Philips CM20 microscope equipped with a field emission gun operating at 200 kV. To prepare the samples for TEM imaging a few mg of dry SWCNT sample was bath-sonicated in methanol or tetrahydrofuran (THF) to form a well-dispersed suspension. The suspension was then pipetted onto the sample holder and allowed to dry completely prior to the measurements. Scanning electron microscopy (SEM) images were obtained using a Hitachi S-4800 FE microscope, operating at 1.2 KV at a distance of 3 mm. SEM samples were prepared by pipetting a few drops of a suspension of SWCNT in methanol onto an aluminum SEM sample stub.
To prepare samples for STXM measurements, the SWCNT were dispersed in N,N-dimethylformamide (DMF) by bath-sonication for 10 min. The solution was subsequently drop-cast on a lacy carbon grid which was then annealed at 200 °C for 48 h in a vacuum oven to remove residual DMF solvent. The unfunctionalized WCPP-HB SWCNT and dodecyl-functionalized WCPP-SWCNT were mea-sured on bend magnet beamline 5.3.2 at the Advanced Light Source (ALS)26,27
and undulator beamline 10ID1 (spectromicroscopy beamline) at the Canadian Light Source (CLS).28
In STXM a monochromated beam of X-rays is focused to 30 nm by a Fresnel zone plate. Imaging at specific photon energies is performed by raster scanning the sample through the focal spot while measuring transmitted X-rays. Spectral image sequences (stacks) are measured by recording images over a range of photon energies. At ALS STXM 5.3.2, theπ* linear dichroismsthe intensity of the C 1s f π* transition as a function of the angle between the axis of the SWCNT and the electric vector (E-vector)sis recorded by measur-ing multiple images at 285.2 eV as a function of sample orientation relative to the fixed linear polarization. The light at 285 eV in the ALS STXM 5.3.2 has been measured to be 82(5)% horizontally linearly polarized.29
At the CLS STXM, the orientation of the E-vector can be varied from -90° to +90° by changing the relative position of the girders in the elliptically polarized undulator (EPU) which produces nearly 100% linearly polarized X-rays.30
As it is much easier to measure the dichroism there, detailed polarization measurements were done using the CLS STXM. The intensity of
the C 1sπ* transition was measured as a function of polarization angle (varied by changing the EPU phase) by recording images at 280.0 eV (pre-edge) and 285.2 eV (π*-peak). The pre-edge and π*-peak images were then converted to optical density, and the 280.0 eV image was subtracted from the 285.2 eV image. The resulting image is referred to as aπ* image.
The samples were also measured using C 1s and O 1s image sequences31
which were converted from transmission to optical density using the incident flux (IO) spectrum recorded
simulta-neously in the area off of, but around the SWCNT bundles where the same support material exists. After aligning the image sequence, spectra of the whole or a subregion were extracted for comparison. In addition, stacks were fit to reference spectra of the components using the singular value decomposition technique.32
All STXM data analysis was performed using aXis2000 (http://unicorn.mcmaster.ca/ aXis2000.html).
3. Results and Discussion
Figure 1 shows SEM images of (a) pristine single-walled carbon nanotubes (SWCNT), (b) WCPP-SWCNT, the SWCNT after subjecting them to a WCPP, and (c) WCPP-HB-SWCNT (further purified by hard baking (HB) after WCPP purification). The images clearly indicate that the impurities were significantly reduced from the pristine to the WCPP-HB purified SWCNT samples. We estimate that the SWCNT content in the WCPP-SWCNT sample is >90 wt %.24The further hard baking (HB) treatment yielded a high-purity SWCNT with an Itkis index33 of over 0.23 and a purity >98 wt %. As clearly seen in Figure 1c, the tubes formed larger bundles when purified.
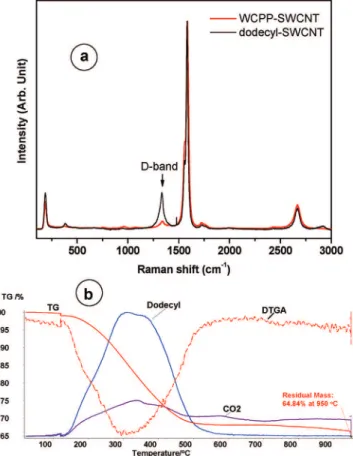
Figure 2 shows Raman spectra of WCPP-SWCNT and dodecyl-functionalized SWCNT. The Raman scattering spectra were obtained using a 514 nm Argon ion laser. The intensity of all the spectra in Figure 2 were normalized to yield the same intensity for the G-band located at ∼1585 cm-1. This G-band is close to that observed for well-ordered graphite (i.e., E2gband at 1582 cm-1), and therefore it is traditionally called the G-band. The G-band in well-ordered nanotubes actually contains several components that originate from the perfect cylindrical symmetry of the nanotube. The Raman-active radial breathing modes (RBM) are observed at low frequency in the left-hand side of the spectra at ∼190 cm-1in Figure 2. The position of the RBM band is inversely proportional to the tube diameters. In these samples the RBM band is pretty sharp, indicating that the diameter distribution is quite small and centered at ∼1.2 nm. More important and useful is the band with its maximum near ∼1330 cm-1that is common in disordered sp2carbon material and has been called the D-band. It is activated by disorder in the sp2carbon network. The D-band intensity, G-bandwidth, and D/G intensity ratio, have been considered as sensitive probes of SWCNT wall integrity or functionalization. When G-bands are normalized to the same intensity, it is simple to compare and follow the variation of the D-band intensities from the starting SWCNT to the functionalized SWCNT.
Upon functionalization, the sp2 carbons were converted to sp3carbon due to the covalent connection of network sp2carbon
(26) Kilcoyne, A. L. D.; Tyliszczak, T.; Steele, W. F.; Fakra, S.; Hitchcock, P.; Franck, K.; Anderson, E. K.; Harteneck, B.; Rightor, E. G.; Mitchell, G.; Hitchcock, A. P.; Yang, L.; Warwick, T.; Ade, H. J.
Synchrotron Rad. 2003, 10, 125–136.
(27) Warwick, T.; Ade, H.; Kilcoyne, A. L. D.; Kritscher, M.; Tyliszczak, T.; Fakra, S.; Hitchcock, A. P.; Hitchcock, P.; Padmore, H. A. J.
Synchrotron Rad. 2002, 9, 254–257.
(28) Kaznatcheev, K. V.; Karunakaran, Ch.; Lanke, U. D.; Urquhart, S. G.; Obst, M.; Hitchcock, A. P. Nucl. Instrum. Methods 2007, 582, 96– 99.
(29) Watts, B.; Ade, H. J. Electron Spectrosc. Relat. Phenom. 2008, 162, 49–55.
(30) Kaznatcheev, K. V.; Karunakaran, Ch.; He, F.; Sigrist, M.; Summers, T.; Obst, M.; Hitchcock, A. P. Nucl. Instrum. Methods Phys. Res.,
Sect. A 2007, 582, 103–106.
(31) Jacobsen, C.; Wirick, S; Flynn, G.; Zimba, C. J. Microscopy 2000,
197, 173–184.
(32) Dynes, J. J.; Tyliszczak, T.; Araki, T.; Lawrence, J. R.; Swerhone, G. D. W.; Leppard, G. G. EnViron. Sci. Technol. 2006, 40, 1556– 1565.
(33) Itkis, M. E.; Perea, D. E.; Jung, R.; Niyogi, S.; Haddon, R. J. Am.
Chem. Soc. 2005, 127, 3439–3448. 9022 J. AM. CHEM. SOC.9VOL. 132, NO. 26, 2010
to the functional group. Therefore, the sp3 character of the SWCNT increased, resulting in an increase in the D-band in the Raman spectrum, as shown in Figure 2a (black line). Although the quantitative relationship between the functional-ization degree and the increase of D-band intensity is unclear and somewhat controversial, it is definitely true that the D-band intensity increases when functionalization has occurred.
The differential thermal gravimetric analysis (DTGA) curve in Figure 2b is quite symmetric and shows a minimum between 300 and 320 °C. The curve profile correlates very closely with the appearance of dodecane whose presence is confirmed by fragments (M+
/e) at 57, 43, and 29 and by the FTIR spectra (see Supporting Information, Figure S-1). This indicates that the functionalization chemistry was fairly specific and introduced only dodecyl as functional groups. On the basis of a measured mass loss of 27 wt %, the degree of functionalization is estimated to be 2.5 C%, that is, on average, 1 dodecyl group per 40 SWCNT carbon atoms.
Figure 3 displays TEM (a) and STXM (b) images of a WCPP-HB-SWCNT sample which was similar to that used for dodecyl functionalization but has higher purity due to further treatment with HB processes after WCPP purification (>98 wt % SWCNT with Itkis’ index >0.23); the images are from the same sample but not the same area. Figure 3c plots the C 1s spectra and
Figure 3d plots the O 1s spectra of two specific regions of this sample, which are indicated by the red bar (horizontal, E|to tube axis) and the blue bar (vertical, E⊥to tube axis) in Figure 3b. The spectra were corrected for the nonlinearly polarized portion of the X-ray beam at the ALS STXM 5.3.229 by removing 18% of the averaged spectrum from both horizontal and vertical spectra. Note that the E-vector of the light at the ALS STXM 5.3.2 bend magnet is horizontal. The C 1s spectra of SWCNT bundles with their long axis oriented parallel versus those perpendicular to the E-vector are remarkably different, indicating there is a strong dichroic effect at the C 1s fπ* transition in single-walled carbon nanotubes. Previously a similar effect was found for arc discharged MWCNT.15,16This large polarization effect is characteristic of low levels of sp2defects. An sp2defect is a carbon in the CNT structure where the local atomic geometry no longer has sp2character. The presence of a significant dichroic signal in the C 1s spectrum of the WCPP-HB-SWCNT indicates these are high-quality tubes with low sp2 defect content. The magnitude of the polarization effect decreases as the structural quality of the tube lowers.15-17 Furthermore, a closer look at the C 1s spectra extracted from the red bar shows weak peaks at 287.7, 288.2, and 289.2 eV (Figure 3e) which correspond to oxygen-rich surface moieties such as carbonyl and carboxylic groups.
To obtain detailed information about the extent of oxidation of the tubes, an O 1s image sequence was recorded, and O 1s spectra were extracted from the regions indicated by horizontal and vertical lines in Figure 3b. The spectra were smoothed by averaging three neighboring points and plotted in Figure 3d. Figure 1. Scanning electron microscopy (SEM) images of (a) pristine
single-walled carbon nanotubes (SWCNT) (pristine ) unpurified), (b) WCPP-SWCNT, the SWCNT after subjecting them to a wet chemical purification procedure (WCPP), and (c) WCPP-HB-SWCNT (further purified by hard baking (HB) after WCPP purification). SEM images were acquired using a 1.5 kV beam.
Figure 2. (a) Raman spectra of the WCPP-SWCNT (red), and dodecyl-functionalized SWCNT (black). (b) Thermal gravimetric analysis (TGA) (red solid line) and differential TGA (red dashed line) of a dodecyl-functionalized SWCNT sample with the corresponding evolution of dodecane fragment (blue solid line) and CO2gases (pink solid line).
The spectra of both regions are quite similar, indicating that the tubes are relatively uniformly oxidized. Moreover, the weak O 1s signal is consistent with the C 1s spectroscopy, where the peaks in the 286-288 eV region, which indicate the presence of CdO bonds,22are very weak, indicating that the oxidation was not severe. The major peaks in the O 1s spectra at 531.7, 538.4, and 540.8 eV are attributed to transitions in carbonyl and carboxylic groups. This is again in agreement with the functional groups predicted from the minor peaks in the C 1s spectra. STXM measurements of pristine SWCNT (no WCPP or WCPP-HB treatment) show that they have similar although somewhat elevated levels of oxygen relative to the purified sample (see Supporting Information Figure S-2). This suggests that WCPP purification is able to remove certain amounts of oxygen containing impurities, although it may also introduce some oxygen on the SWCNT (The WCPP and WCPP-HB
procedures are not intended to remove oxygen that originally existed on the tubes). The level of oxygen in HB-SWCNT that is detectable by XPS is 3-5%. Annealing WCPP-HB-SWCNT to 950 °C achieves some further reduction of the oxygen level in the sample (see Supporting Information, Table S-1). In addition, we have observed that the purified WCPP-SWCNT slowly oxidizes during air storage. This issue is being carefully investigated.
Figure 4a plots the carbon map obtained by subtracting the averaged images of the pre-edge (278-282 eV) from those of the postedge (296-320 eV) in the stack recorded to obtain the spectra in Figure 3. Figure 4a shows that there are bundles of different thicknesses. Figure 4b is the oxygen distribution map, derived by taking the difference between the averaged images from 527-560 eV and those from 524-530 eV. Figure 4c plots the ratio of the O 1s to the C 1s map. Regions with no signal Figure 3. (a) TEM and (b) STXM images of a WCPP-HB-SWCNT sample, (c) C 1s and (d) O 1s spectra of the specific regions indicated by the red (horizontal) and blue (vertical) bars (image and spectra recorded with a bending magnet STXM in which the E-vector is horizontal); (e) expansion of the C 1s spectrum from the red bar (horizontal) in the region ofπ*CdOtransitions. Spectra have been 3-point smoothed. (ALS STXM 5.3.2)
9024 J. AM. CHEM. SOC.9VOL. 132, NO. 26, 2010
have been masked (set to 0) to remove artifacts. Brighter pixels in Figure 4 correspond to more oxygen relative to carbon (thus, more oxidation) whereas darker pixels correspond to less oxygen relative to carbon (thus, less oxidation). There are more bright pixels at the edges than at the centers of the tubes, clearly indicating that more oxidation has occurred at the edges. Figure 4d is a color-coded composite of the carbon (green) and ratio (blue) maps from 4a and 4c, with the scaling such that the intensity of 4a and 4c are each mapped to the full 8-bit scale of its color. The color-coded composite confirms the existence of more oxygen relative to carbon at the edges of the tube. Furthermore, there are much higher levels of oxidation in thin SWCNT bundles such as that at the upper right of Figure 4d, suggesting that oxidation is more severe in thin SWCNT bundles.
Figure 5 presents component maps for a WCPP-HB-SWCNT sample derived by fitting the C 1s image sequence to reference spectra for (a) WCPP-SWCNT where the long axis of the WCPP-SWCNT is oriented perpendicular to the E-vector, (b) WCPP-SWCNT where the long axis of the WCPP-SWCNT is oriented parallel to the E-vector, and (c) oxidized MWCNT. The C 1s reference spectra used for this analysis are reported in Figure S-3 (Supporting Information). The gray scales of each image in Figure 5 indicate thickness, in nanometers, of each component. Figure 5d is a color-coded composite of these component maps. This analysis clearly shows a strong dichroic Figure 4. Elemental maps of a WCPP-HB-SWCNT sample giving the
distribution of (a) carbon (average of 10 STXM images from 296-320 eV minus those from 278-282 eV) and (b) oxygen (the difference between the sum of images from (540-560 eV) and those images from (524-530 eV) in order to remove the large background from carbon absorption), (c) is a ratio map (O/C) that visualizes the relative oxygen to carbon content at different locations on the tubes; (d) is a color composite (rescaled) of the carbon (green, a) and oxygen/carbon ratio (blue, c) signals. (ALS STXM 5.3.2)
Figure 5. Component maps, derived from a C 1s image sequence of the WCPP-HB-SWCNT sample, of (a) WCPP-HB-SWCNT where the long axis of the SWCNT is oriented perpendicular to the E-vector, (b) WCPP-HB-SWCNT where the long axis of the WCPP-HB-SWCNT is oriented parallel to the
E-vector and (c) oxidized regions. The reference spectra of the horizontally and vertically aligned tubes were extracted from the WCPP-HB-SWCNT sample (Figure 3), whereas those for oxygenated tubes were reported earlier for AD-MWCNT.13,14(see Supporting Information Figure S-3 for plots of
the reference spectra). (d) Rescaled color-coded composite image (SWCNT long axis perpendicular to E-vector is coded in red, SWCNT long axis parallel to E-vector is coded in green, and oxidized areas are coded in blue). The arrow indicates the orientation of the E-vector (ALS STXM 5.3.2).
signal from bundled SWCNT. This analysis supports the simpler analysis done by ratioing the C 1s and O 1s images (after background removal), in that there is clear indication of preferential oxidation of the thinner SWCNT. It is possible that the magnitude of the oxidation signal derived from the C 1s stack is overestimated since less oriented regions of SWCNT are often fit as the oxidized component, as well as the actual oxidized regions (see Supporting Information Figure S-3).
In order to confirm the strong polarization effect observed in the C 1s spectra of the WCPP-HB-SWCNT at the C 1sfπ* transition,π* images for an isolated WCPP-HB-SWCNT were recorded at different polarization angles at the CLS STXM (Figure 6). The tube axis was located at 60° relative to horizontal. On the basis of the known relationship of carbon nanotube orientation and transition intensity,15the C 1sfπ* transition should have the lowest intensity when the E-vector is parallel to the tube (-60°) and the highest intensity when the E-vector is normal to the tube (+30°). Theπ* images are consistent with these expectations.
Theπ* images obtained at various polarization angles were aligned and combined to form an angle-dependent image sequence. The angle-dependent intensity was then extracted from the region of the SWCNT exhibiting the largest effect indicated by the box in the inset in Figure 7. Figure 7 plots this intensity (gray) as a function of the angle of the E-vector (horizontal ) 0, anticlockwise is positive) together with the results for an arc discharge (AD) MWCNT (black) reported previously.15 The experimental values were normalized to I⊥(E-vector normal to
the tubes) to remove the thickness effect and subsequently fit to a ( b × cos2(θ - θ
f), whereθfis an optimizable parameter corresponding to the angle between the long axis of the MWCNT and horizontal. There is good agreement between the fits (solid line) and the experimental values. In fullerene, the local π-σ bonding and π*-σ* antibonding symmetry mixing is large, which results in very low dichroism.36Due to the large curvature in SWCNT, a similar phenomenon might have been expected in SWCNT. However, Figure 7 shows that the linear dichroism of the π*-signal of these SWCNT is as strong as that found in AD-MWCNT. This suggests thatπ*-σ* mixing in SWCNT is very different and much less than that in fullerenes. STXM has a limited spatial resolution compared to TEM-EELS; therefore, the spectra measured in STXM are the average of the top and the edges of tubes at different orienta-tions. Previously, Ste´phan et al.36used TEM-EELS to measure the C 1s spectra at different points across an individual SWCNT. They observed that the C 1s f π* transition is about 30% stronger at the edge than at the center of the tube (relative to the C 1s continuum signal above 300 eV). In EELS the change in peak intensities with changes in the orientation of the sample relative to the direction of the momentum transfer vector (q) is the equivalent to linear dichroism in X-ray absorption, with q being directly analogous to the E-vector. Using q-dependent TEM-EELS to study polarization effects is challenging since it is hard to define and adjust the orientation and dispersion of q. Since the signal measured in STXM is much less spatially localized than that in TEM-EELS, the large dichroism observed in this work indicates that the intrinsic π* dichroism of well-ordered SWCNT with a low-defect content is very large.
Panels a and b of Figure 8 show TEM and STXM images of the dodecyl-functionalized SWCNT sample; the images were recorded from the same sample grid but not from identical areas. C 1s spectra were extracted from the indicated horizontal (red) and vertical (blue) regions, matched at the pre-edge and continuum to normalize for thickness, and corrected for the fraction of nonlinear polarized X-rays, as explained earlier. The C 1s spectra of the dodecyl-functionalized SWCNT show a much smaller dichroic effect than the WCPP-HB-SWCNT sample, and also much lessσ* exciton signal (291.8 eV). There is also a significant difference in theσ* exciton region between
(34) Henke, B. L.; Gullikson, E. M.; Davis, J. C. At. Data Nucl. Data Tables
1993, 54, 181–342.
(35) Azami, S. M.; Pooladi, R.; Sheikhi, M. H. J. Mol. Struct. (THEOCHEM)
2009, 901 (1-3), 153–156.
(36) Ste´phan, O.; Kociak, M.; Henrard, L.; Suenaga, K.; Gloter, A.; Tence´, M.; Sandre´, E.; Colliex, C. J. Electron Spectrosc. Relat. Phenom. 2001,
114-116, 209–217. Figure 6. π* images (difference in optical density images at 285.2 and
280.0 eV) of WCPP-HB-SWCNT recorded with an orientation of the
E-vector indicated by the double-headed arrow (0 ) horizontal) (CLS STXM).
Figure 7. Polarization dependence of the C 1sfπ* transition from the indicated region of a single bundle of WCPP-HB-SWCNT (gray, taken from the gray outlined rectangle on the inset image), compared to that from an arc discharge, AD-MWCNT (black).15(CLS STXM)
9026 J. AM. CHEM. SOC.9VOL. 132, NO. 26, 2010
the vertical and horizontal SWCNT for which the spectra are displayed in Figure 8c. This perhaps indicates an enhancedσ* dichroism, or inhomogeneous functionalization chemistry. The π* dichroic signal is somewhat reduced relative to that observed in the WCPP-HB-SWCNT (Figure 3). This is attributed to the increased defect content caused by the covalent functionalization of the SWCNT. The increase in disorder indicated by the reduced dichroism is also clearly reflected in the increased intensity of the disorder D-band in the Raman spectrum shown in Figure 2b. Oxygen is known to open the sp2 hybridized carbon-carbon bonds and reduce the number of available states with p-like symmetry, thus reducing the magnitude of the
dichroic effect.37 The increased defect concentration due to chemical functionalization is often accompanied by new func-tional groups on the surface of SWCNT. A close examination of the spectra in Figure 8c shows a new peak at 287.7 eV (see arrow) which corresponds to the C 1sf (C-H) transition in the dodecyl chains.
The left panels of Figure 9 display the C 1s spectra of five components used to fit the C 1s image sequence measured from the dodecyl-functionalized SWCNT. The right panels in Figure 9 are the associated semiquantitative maps for each component. Note that the gray scales of the component maps give an estimate of the thickness (in nm) of that chemical component at any point in the imaged area. Quantitative thicknesses are given by the fitting coefficients since the intensity scales of the reference spectra are set to the response of 1 nm of carbon, using tabulated mass absorption coefficients.35The reference spectra of the horizontally and vertically aligned SWCNT were obtained from the WCPP-HB-SWCNT sample (Figure 3c) by matching the spectra at the pre-edge and postedge regions to the sum of tabulated atomic mass absorption coefficients for the elemental composition of the pure component.34 The reference spectra of carbon impurities and oxidized tubes were those reported earlier and extracted from MWCNT samples.13,14 The reference spectrum of dodecyl was that of an amorphous C-60 short-chain polyethylene wax. Spectra a and b of Figure 9 are components for horizontally weak) and vertically (π*-strong) aligned SWCNT. One can see that horizontally oriented tubes are only present in Figure 9a, whereas the vertical tubes and onion components appear in both component maps. Although dodecyl-functionalized SWCNT have weaker dichro-ism than the WCPP-HB-SWCNT (see Figure 3), the C 1s f π* transition of functionalized SWCNT is still orientation dependent. Figure 9c maps the oxidized regions on the bundles which are probably produced during sample storage or caused by the chemical modification. It is interesting to note that the oxidation mainly occurs on the outer walls of the bundles where they were unprotected and exposed to air. We have observed that purified SWCNT slowly oxidize on storage in air. Figure 9d shows the carbon onions and other carbon particle impurities that are either stuck to the sides of the bundles or exist as “blobs”. Finally, Figure 9e maps the dodecyl chains that were produced on the bundles by the chemical functionalization. It is apparent that the chains cover the tubes completely, indicating a successful chemical functionalization. Surprisingly, this analysis suggests that there are more dodecyl chains on the vertically aligned tubes than the horizontally aligned ones, which is very unlikely. Other alternative explanations might be (1) local ordering of the dodecyl chains that results in a dichroic effect; (2) nonuniform functionalization on the side wall of the tubes; or (3) errors due to an improper fit. The first possibility was investigated using a detailed dichroism study at the CLS STXM; a dichroic effect from the heavily dodecyl-functionalized regions was not observed (results not presented in this paper). Nonuniform functionalization is not expected. The last pos-sibility is the most likelysfitting errors might arise because the dodecyl C 1s spectrum (Figure 9e) is much closer to that of horizontally (Figure 9a) than vertically (9b) aligned SWCNT. Figure 9e also shows that the amount of dodecyl is relatively greater on graphitic particles than on SWCNT. The larger
(37) Hemraj-Benny, T.; Banerjee, S.; Sambasivan, Sh.; Balasubramanian, M.; Fischer, D. A.; Eres, G.; Puretzky, A. A.; Geohegan, D. B.; Lowndes, D. H.; Han, W.; Misewich, J. A.; Wong, S. S. Small 2006,
2(1), 26–35. Figure 8. (a) TEM and (b) STXM images of a dodecyl-functionalized
WCPP-SWCNT. (c) The C 1s spectra of the regions indicated by the red and blue bars. Spectra have been 3-point smoothed. (ALS STXM 5.3.2)
Figure 9. STXM of the dodecyl-functionalized WCPP- SWCNT: (left panels) C 1s reference spectra used to fit the C 1s image sequence in order to derive the associated component maps (right panels). Component maps of (a) horizontal SWCNT (π*-weak); (b) vertical SWCNT (π*-strong); (c) oxidized SWCNT; (d) carbon onions and other carbon contaminations (CNP); (e) dodecyl. The reference spectra of the horizontally and vertically oriented tubes were extracted from WCPP-HB-SWCNT sample (Figure 3), whereas those for oxygenated tubes and graphitic impurities were from previous studies of impure CNT samples.13,14The reference spectrum of dodecyl was that of an amorphous C-60 short-chain polyethylene wax.38The gray scales of the component maps
give the thickness in nm. (ALS STXM 5.3.2)
9028 J. AM. CHEM. SOC.9VOL. 132, NO. 26, 2010
residual strain in the particles could make them more reactive than tubes. Further work is needed to refine the reference spectrum of the dodecyl substituent and improve the differentia-tion of dodecyl and horizontally aligned CNT spectral signals in the fitting in order to provide a fully quantitative analysis of the loading.
4. Summary
STXM, in combination with SEM, FTIR, Raman, and thermal analysis, has been used to study SWCNT in the pristine and purified states. A strong dichroic signal has been detected in high-purity bundled WCPP-HB-SWCNT, with an intensity very similar to that observed in MWCNT. The same techniques were also used to characterize dodecyl-functionalized SWCNT. The C 1s signal of the dodecyl functionalization was detected and mapped. These results have demonstrated the STXM is a powerful tool to characterize functionalized SWCNT, which in combination with other methods such as SEM, TEM, FTIR, TGA, and Raman spectroscopy, can help improve purification and chemical functionalization methods. Our ultimate goal is to develop high-strength fibers based on braided alkyl-func-tionalized SWCNT. In addition to helping to optimize chemical functionalization of nanomaterials, STXM spectromicroscopy
will also play a role in understanding and optimizing interactions between nanotubes and different matrices in nanotube-polymer composites.
Acknowledgment. This work was supported by NSERC, CFI, and the Canada Research Chair programs. STXM measurements were carried out at the SM beamline at the Canadian Light Source and at beamline 5.3.2 at the Advanced Light Source (ALS). The Canadian Light Source is supported by the Canada Foundation for Innovation (CFI), NSERC, Canadian Institutes of Health Research (CIHR), National Research Council (NRC), and the University of Saskatchewan. The ALS is supported by the Office of Basic Energy Sciences of the U.S. Department of Energy under contract DE-AC03-76SF00098. We thank David Kilcoyne and Tolek Tyliszczak for their expert support of the ALS STXM and Chithra Karunakaran, Martin Obst, and Jian Wang for their expert support of the CLS STXM. We are also thankful to Mr. Gordon Chan at NRC-IRC for SEM measurements, as well as Mr. Michael Barnes and Mrs. Malgosia Daroszewska at NRC-SIMS for TGA-MS-IR measurements.
Supporting Information Available: FTIR, Raman spectra, STXM of pristine SWCNT, XPS results of oxygen content, and reference spectra. This material is available free of charge via the Internet at http://pubs.acs.org.
JA101001T (38) Hitchcock, A. P.; Araki, T.; Ikeura-Sekiguchi, H.; Iwata, N.; Tani, K.