HAL Id: hal-01516972
https://hal.archives-ouvertes.fr/hal-01516972
Submitted on 2 May 2017
HAL is a multi-disciplinary open access
archive for the deposit and dissemination of
sci-entific research documents, whether they are
pub-lished or not. The documents may come from
L’archive ouverte pluridisciplinaire HAL, est
destinée au dépôt et à la diffusion de documents
scientifiques de niveau recherche, publiés ou non,
émanant des établissements d’enseignement et de
Optimal sizing of a lithium battery energy storage
system for grid-connected photovoltaic systems
Jérémy Dulout, Amjad Anvari-Moghaddam, Adriana Luna, Bruno Jammes,
Corinne Alonso, Josep Guerrero
To cite this version:
Jérémy Dulout, Amjad Anvari-Moghaddam, Adriana Luna, Bruno Jammes, Corinne Alonso, et al..
Optimal sizing of a lithium battery energy storage system for grid-connected photovoltaic systems.
In-ternational Conference on DC Microgrids (ICDCM) 2017, IEEE PES ; IEEE PELS, Jun 2017,
Nurem-berg, Germany. �hal-01516972�
Optimal sizing of a lithium battery energy storage
system for grid-connected photovoltaic systems
Jérémy Dulout, Bruno Jammes,
Corinne Alonso
LAAS-CNRS, Université de Toulouse, CNRS, UPS, France
{jdulout, jammes, alonsoc}@laas.fr
Amjad Anvari-Moghaddam, Adriana Luna,
Josep M. Guerrero
Department of Energy Technology, Aalborg University, Denmark
{aam, acl, joz}@et.aau.dk
Abstract— This paper proposes a system analysis focused on
finding the optimal operating conditions (nominal capacity, cycle depth, current rate, state of charge level) of a lithium battery energy storage system. The purpose of this work is to minimize the cost of the storage system in a renewable DC microgrid. Thus, main stress factors influencing both battery lifetime (calendar and cycling) and performances are described and modelled. Power and energy requirements are also discussed through a probabilistic analysis on some years of real data from the ADREAM photovoltaic building of the LAAS-CNRS in Toulouse, FRANCE.
Keywords—Battery Energy storage Systems (BESS); Optimal sizing; PV microgrid; Economic analysis; Lifetime modelling.
I. INTRODUCTION
Photovoltaic (PV) systems are spreading around the world due to their decreasing costs, increasing environmental concerns and fossil fuel resources depletion [1]. A PV system has several advantages compared to fossil-fuel based energy source including short construction period, low operational complexity, fuel price independency and sustainable rural electrification of remote areas [2]. However, managing the PV production is challenging because of its intermittency with nearly unpredictable fast variations (from seconds to minutes) and longer well-known patterns (diurnal and seasonal cycles) which are unfortunately not always time-related to our domestic needs [3]-[4]. As a consequence, high penetration levels of grid-tied PV can cause some troubles on voltage and frequency regulations [5]-[6].
In order to offer valuable services to the grid and enable high penetration of PV systems, battery energy storage systems (BESSs) are deemed as a promising solution due to their easy scalability and flexibility to any type of project. Minimization of the cost of stored energy is a crucial issue to expand the use of battery storage systems in photovoltaic microgrids. On this purpose, some methods have been proposed to find the optimal sizing of BESS for different systems [7]-[10]. In this study, lithium batteries have been chosen amongst other batteries because of their worldwide increasing popularity that make this technology always cheaper [11], more efficient and sustainable [12].
A good evaluation of the system cost is the key to perform an optimal sizing of BESSs. An issue is that a battery (especially lithium batteries with various combinations of electrodes and
electrolyte) is a complex system involving several nonlinear ageing mechanisms that interact with each other [13]. To this end, accurate lifetime prediction models should be considered. [14] defines several stress factors related to off-grid renewable energy sources operations and their influence on battery ageing processes. [15] and [16] investigates calendar and cycle lifetime of respectively LiFePO4/C and Li(NiMnCo)O2/C batteries by
studying the effect of temperature, state of charge (SOC) and SOC-level on battery capacity fade and power capability decrease. The use of very accurate electrochemical models is difficult to manage because it needs fast computational resources and a good knowledge of the main components inside the battery (chemical composition and quantities are not always reported by manufacturers) [17].
This paper is focused on finding the optimal nominal capacity and cycle depth in order to store the entire PV surplus production and to minimize the annual cost of the storage system. In this regard, firstly, an analysis is performed on the data provided by the experimental 150 kWp PV building ADREAM from the LAAS-CNRS of Toulouse in the south of France. A three-year data set with 1-minute resolution for power flow measurements is considered. Then, the BESS operating constraints are presented and a BESS model is proposed. After that, the cost minimization for the stored energy is discussed. Before the conclusion, a sensitivity analysis is presented to give the reader a clear vision about the main parameters influencing the sizing of BESS.
II. CASE STUDY –POWER AND ENERGY PROFILES
In this paper, a grid-tied solar PV microgrid associated with a BESS is considered, as depicted in Fig. 1. The initial aim is to improve the PV system dispatchability by managing the energy surplus which is not directly consumed by the load with a BESS. This way of consuming electricity is supposed to flatten the peak demand and reduce both transmission and distribution losses of the actual centralized power grid [18].
The microgrid power balance between the PV source and the load is noted 𝑃𝑏𝑎𝑙𝑎𝑛𝑐𝑒(𝑡) (1). A positive value denotes surplus of
power from the PV system and a negative value represents the residual demand within the microgrid which cannot be met by the PV system.
where 𝑃𝑃𝑉(𝑡) is the PV production and 𝑃𝐿𝑜𝑎𝑑(𝑡) is the load
consumption of the microgrid.
Fig. 1. Scheme of the considered grid-tied PV microgrid with a BESS.
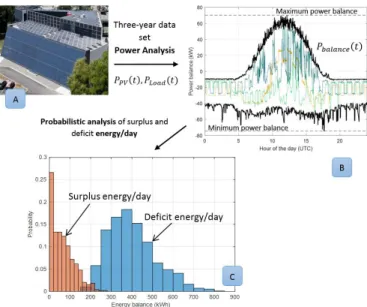
A power balance analysis between the PV source and the load of the ADREAM building (Fig. A) is depicted in Fig. 2-B. The maximum and minimum power balance over the three-year data set are represented in bold black line while some days (coloured lines) illustrate the very different possible daily profiles encountered in PV buildings. According to the surplus and deficit energy per day probability distributions (see Fig. 2-C), it can be clearly observed that the energy extracted from the PV system is not sufficient to satisfy all the load. This is why, the strategy consist of storing all available surplus PV energy during the day and discharging the BESS with a low current rate (C-rate) during the night until the BESS reaches a given minimum SOC (it enables a good BESS lifetime management, see section III). Thus, assuming that the BESS will perform one cycle per day, all the work on sizing is focused on the charge process (because it represents a lower energy per day).
Fig. 2. A) ADREAM experimental PV building, B) Minimum and maximum power balance based on a 3-year data set, C) Probabilistic analysis of surplus and deficit energy per day.
The analysis of power profiles presented in Fig. 2-B exhibits the maximum power at the charge (70.2 kW) and at the discharge (74.5 kW) which gives an idea of the maximum C-rate that the storage system will perform. In the next section, the influence of this parameter on energy efficiency and lifetime of the BESS will be discussed.
The probability distribution of surplus energy per day presented in Fig. 2-C enables to calculate the different cycle depths that the BESS will perform (assuming one cycle per day) and then, make a good lifetime estimation (see section IV).
III. BESS CONSTRAINTS AND MODELLING
In order to minimize the overall cost of the BESS, trade-offs have to be made between the performances (available capacity, power capability and energy efficiency) and the lifetime. C-rate, cycle depth, SOC-level and temperature are the main stress factors acting on lithium batteries performances and lifetime [14]-[17]. In table I, the lifetime behaviour is quantified by the drop of nominal capacity and increase of internal resistance (i.e. loss of power capability). Two different lifetime processes are identified, the calendar lifetime (CAL) models the “rest mode” whereas the cycle lifetime (CYC) models the “running mode”. In this work, the temperature aspects are neglected, assuming that the batteries are stored in a controlled temperature room.
TABLE I. STRESS FACTOR MATRIX FOR LITHIUM BATTERIES
Stress factor Performances Lifetime Available capacity Power capability Energy efficiency C -r a te Low High Cy cle d ep th Narrow No immediate effect Wide S O C -lev el Low <25% No effect CAL CYC Medium ~50% CAL CYC High >75% CAL CYC
Performance: good medium bad
The different results presented in Table I are explained in the following sections which give some guidelines to optimize the lithium battery management.
A. BESS performances
Available capacity
Limiting the charge and discharge C-rate is needed to ensure a minimum available capacity of the battery, even if this
phenomenon is less important for lithium batteries than lead-acid batteries (cf. Peukert’s law [17]). For lithium batteries, the nominal C-rate leads to a good compromise between available capacity and performance of the battery [17].
Obviously, the available capacity is increasing when cycle depth (also named delta depth of discharge (ΔDOD) in [14]) and SOC-level are increasing, because more energy is at stake.
Power capability
By definition, when the C-rate is low, the power capability is low. Cycle depth has no effect on power capability because it reflects an energy.
For low SOC-levels, the voltage of the battery is decreasing so the power capability also decreases.
Energy efficiency
For lithium batteries, the energy efficiency is decreasing when C-rates increase, ranging for about 86% to 99% with respectively a C-rate of 4C𝑛𝑜𝑚 and 0.25C𝑛𝑜𝑚 (where C𝑛𝑜𝑚 is the
nominal capacity of the battery) [19].
Unlike lead-acid batteries which suffer from parasitic reactions at high SOC-level (gassing), lithium batteries don’t exhibit such parasitic reactions creating a drop of the energy efficiency for a particular SOC-level [17].
B. BESS lifetime
The lifetime of batteries is due to the combination of calendar and cycling lifetime. In [16], it has been experimentally shown that cycling a battery (with a 5% cycle depth at 50% SOC-level) creates additional degradations in comparison with storage considering both aspects of decreasing nominal capacity and increasing internal resistance. Even if the authors assumed that this statement cannot be generalized, the same behaviour has been presented in [15] on another type of lithium batteries. In this sense, assuming that the battery has a calendar lifetime of 25 years (~9131 days), it can be considered that it corresponds to a maximum cycling lifetime of 9131 cycles (as it is assumed that the BESS performs one cycle per day).
Cycle depth and SOC-level have to be wisely chosen in order to ensure the longest lifetime [13]-[17]. In this paper, the experimental results presented in [16] and depicted in Fig. 3 are used to model the effect of cycle depth on the lifetime of a battery. Usually, the end of life (EOL) of a battery is the moment when the nominal capacity reaches 80% of its initial value. This value of 80% has been chosen because the ageing process is accelerated after this point: “sudden deaths” of batteries are reported in [14].
As depicted in Fig. 4, both low and high SOC-levels accelerate the ageing mechanisms of lithium batteries, in particular at the anode due to the current collector corrosion and the solid electrolyte interphase growth [13].
Fig. 3. Calendar and cycling lifetime model of the BESS (experimental data from [14], cells have been cycled with a C-rate of 1 C at 35°C).
Obviously, the SOC-level of 50% has to be chosen because it enables the highest cycling lifetime and the possibility to use the entire capacity of the battery (100% of cycle depth). The relation between the equivalent number of full cycles and cycle depth can be described by (2):
N𝑐𝑦𝑐= 𝑎 exp (−𝑏×∆DOD)+ 𝑐 (2)
The following parameters have been used to fit the 50% SOC-level curve (see Fig. 4): a=1.057e4, b=0.05459, c=455 (R²=0.9729 and RMSE=689.1).
C. BESS model
Storing all the surplus energy delivered by the PV source is the first requirement that should be addressed in optimal BESS sizing. In this purpose, considering the ageing mechanism (capacity fade), the BESS nominal capacity must satisfy the following constraint:
C𝑛𝑜𝑚_𝐵𝑂𝐿× ∆DOD ≥ 1.25 𝐸𝐶ℎ𝑎𝑟𝑔𝑒𝑚𝑎𝑥 (3) where C𝑛𝑜𝑚_𝐵𝑂𝐿 is the nominal capacity of the BESS at its
beginning of life (BOL), and 𝐸𝐶ℎ𝑎𝑟𝑔𝑒𝑚𝑎𝑥 is the maximum energy to store per day. The coefficient 1.25 reflects that the BESS is considered at its end-of-life (EOL) for a capacity fade of 20%.
Expression (3) introduces the concept of usable capacity depicted in Fig. 4. As presented in Fig. 2-C, a maximum charging energy per day of 280 kWh is considered. This requirement leads to a 350 kWh usable capacity. Given this constraint, the minimization of the cost of stored energy can be done by selecting the best combination of BESS nominal capacity and cycle depth.
Fig. 4. Usable capacity of a battery and its capacity fading.
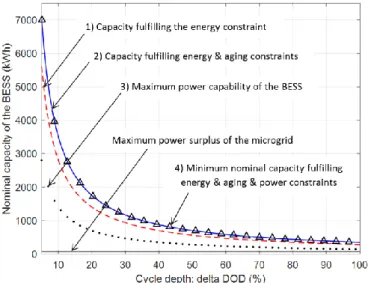
According to (3), Fig. 5 represents the evolution of the minimum value of the BOL nominal capacity that fulfil energy, power and lifetime requirements for every cycle depth. The energy and power constraints are based on the maximum PV surplus energy per day and power (280 kWh and 70.2kW have been considered). Even if power capability fade also exists, it has been neglected because it seems to be less than 10% according to [15]. In this application, the power constraint does not affect the minimum nominal capacity because the maximum C-rate (considered to be 0.5 C𝑛𝑜𝑚) is always higher than 70.2 kW
(maximum surplus power delivered by the PV system described in Fig 2-B).
Fig. 5. Effect of power, energy and lifetime constraints on the sizing of the BESS (nominal capacity and cycle depth).
IV. OPTIMIZATION PROBLEM
The energy and power constraints have been defined, both on system requirements (see Fig. 2) and BESS behaviour (see section III). The minimization of the cost of stored energy, based on BESS lifetime modelling, can be expressed as follows:
𝑀𝑖𝑛 {𝐶𝑆𝑡𝑜𝑟𝑒𝑑𝐸𝑛𝑒𝑟𝑔𝑦=
𝐶1𝑘𝑊ℎ× C𝑛𝑜𝑚_𝐵𝑂𝐿× F
𝐸𝐷𝑖𝑠𝑐ℎ_𝑦𝑒𝑎𝑟 }
(4)
where 𝐶1𝑘𝑊ℎ is the cost of one kilowatt-hour (euro/kWh) for a
lithium battery (350€/kWh have been considered based on [11]), 𝐸𝐷𝑖𝑠𝑐ℎ_𝑦𝑒𝑎𝑟is the annual energy delivered by the BESS and F is
the capital recovery factor, enabling the calculation of annual equally separate payments over a given period based on the initial payment.
The capital recovery factor calculation (5) is based on the interest rate 𝑖𝑟(typically between 5 and 10%, depending on the
duration of the project, [8] considered 7.7% for storage system projects) and the BESS lifetime expressed in number of years 𝑛.
F = 𝑖𝑟(1 + 𝑖𝑟)
𝑛
(1 + 𝑖𝑟)𝑛− 1
(5)
In order to have a relevant cost of stored energy, the key parameter is the estimation of lifetime. Assuming that the BESS will perform one cycle per day and considering the probabilistic energy to store per day (𝐸𝐶ℎ𝑎𝑟𝑔𝑒𝑖 described in Fig. 2), it is possible to calculate the corresponding cycle depth, ΔDOD (comprised between 0 and 1):
∆DOD𝑖= 𝑚𝑖𝑛 (
𝐸𝐶ℎ𝑎𝑟𝑔𝑒𝑖 C𝑛𝑜𝑚 , 1)
(6) where 𝐸𝐶ℎ𝑎𝑟𝑔𝑒 𝑖 is the energy per day of the ith bin (class interval)
depicted in the Fig. 2-C.
Based on the concept of mechanical fatigue adapted to batteries described in [20], a lifetime estimation can be performed by considering the number of cycles and their associated cycle depths. According to the relation (2) and the Fig. 3, the equivalent maximum number of full cycles of the BESS can be estimated considering both calendar and cycling lifetime:
N𝑐𝑦𝑐_𝑙𝑖𝑓𝑒= ∑ (𝑝𝑛𝑏𝑖𝑛× 𝑚𝑖𝑛 (N𝑐𝑦𝑐, N𝑐𝑎𝑙)) 𝑛
𝑛𝑏𝑖𝑛=1
(7)
where 𝑝𝑛𝑏𝑖𝑛is the probability of the ith bin (see Fig. 2-C), N𝑐𝑦𝑐
and N𝑐𝑎𝑙 are respectively the number of equivalent full cycles
from cycling lifetime (relation (2)) and from calendar lifetime (Fig. 3).
Finally, assuming that the BESS will perform one cycle per day, the number of years of operation of the BESS is given by:
𝑛 =N𝑐𝑦𝑐_𝑙𝑖𝑓𝑒
365.25 (8)
The energy delivered by the BESS takes into account the round-trip energy efficiency of the storage technology
𝜂
𝐵𝐸𝑆𝑆 (typically around 92% for a lithium battery).𝐸𝐷𝑖𝑠𝑐ℎ_𝑦𝑒𝑎𝑟=𝜂𝐵𝐸𝑆𝑆×𝐸𝐶ℎ_𝑦𝑒𝑎𝑟 (9)
where 𝐸𝐶ℎ_𝑦𝑒𝑎𝑟 is the energy stored by the BESS. It can be calculated based on the probability distribution of surplus energy per day (Fig. 2) and on the usable capacity of the BESS:
𝐸𝐶ℎ_𝑦𝑒𝑎𝑟= 365.25 ∑ (𝑝𝑛𝑏𝑖𝑛× 𝑚𝑖𝑛(E𝑛𝑏𝑖𝑛, C𝑛𝑜𝑚_𝐵𝑂𝐿× ∆DOD))
𝑛
𝑛𝑏𝑖𝑛=1
Meteorological conditions, electricity growth rate, evolution of technologies are the main causes that may change the shape of the studied power balance over the past years. This possible changes will have a direct impact on the energy per day to store by the BESS and on the C-rate. In the last part of this paper, the (10)
results about the BESS sizing optimization will be given, describing the influence of the power balance profile on the cost of stored energy and the possible cost minimization if only a part of the surplus energy is stored in the BESS.
V. RESULTS AND SENSITIVITY ANAYSIS
First, if the energy per day to store is always included in a very narrow range of energy such as 280 kWh ± 5 kWh, according to (3) and the lifetime modelling, the cost of stored energy can be defined for every cycle depth, as depicted in Fig. 6. A second lifetime model describing lead-acid batteries has been included according to [21] in order to highlight the significant influence of the lifetime model.
Fig. 6. Cost of stored energy for different cycle depths and lifetime models.
For the considered model of lithium-ion battery (solid line in the Fig. 6), the minimization of the cost of stored energy is obtained for a cycle depth of 30% (whereas around 40% for the other lifetime model).
As presented in Fig. 2, PV microgrids are operating in a wide range of power and energy. In this case, the BESS will run in very different operating conditions, especially in terms of cycle depth. Based on the relations (6) to (8) of the section IV, a good estimation of the BESS lifetime can be done. Some energy bins depicted in Fig. 2-C have been chosen such as 100 kWh, 140 kWh, 180 kWh and 220 kWh because they account respectively for 75.7%, 89%, 95.9% and 99.2% of the cumulative distribution of surplus energy per day. In this sense, different calculations have been done, allowing the BESS to not store all the PV surplus. It means that the probability distribution is reorganized when removing high energy bins (not all the surplus energy is lost: for example if the 280 kWh bin is removed, it means that its probability will be added to the immediate lower bin (260 kWh), so only 20 kWh with the probability of the 280 kWh bin is lost).
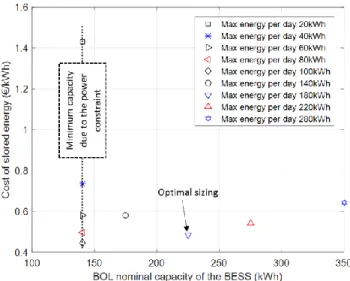
The result is illustrated in Fig. 7 with the cost of stored energy (€/kWh) for different possible BESS nominal capacities. The best compromise is to store a maximum energy per day of 180 kWh: the cost of stored energy is about 0,48 €/kWh for a
BESS BOL nominal capacity of 225 kWh. In this case, less than 5% of the PV energy surplus is wasted whereas the cost of stored energy decreases for more than 26% (compared to solution leading to 100% energy surplus stored in the BESS).
In Fig. 7, some other cases (only low energy per day to store) have been added to show the effect the maximum power balance and BESS C-rate constraints on the sizing. Indeed, the minimum nominal capacity can’t be below 140.4 kWh (because of the maximum power surplus of 70.2 kW and the 0.5 C maximum charge C-rate). As it has been done for the maximum energy to store, this limit can be modified to find a good trade-off between system cost and performances.
Fig. 7. Cost of stored energy for different BESS nominal capacities.
In order to adapt the sizing of the BESS and find some good compromises, the possible surplus power associated to their energy per day have to be analysed, as presented in Fig. 8. For the ADREAM building, it can be clearly observed that power balance higher than 50 kW are not usual. Besides, the 70 kWh energy per day area is very probable which also explains why the 225 kWh capacity leads to the optimal sizing, according to the results of the Fig. 6 (the cycle depth will be close to 30%).
Fig. 8. Surplus PV power and energy per day of the ADREAM building over 3 years.
Nevertheless, by including the cost of the solar installation and power converters, the price of electricity is still far higher than the conventional electricity (nearly 6 times higher). But this type of renewable microgrid, apart from enabling the integration of renewable sources, may enable the electrification of remote areas (highly time consuming and costly construction of long transmission lines can be avoided). Moreover it can also limit the number and the length of power outages and offer a solution of power restoration after a natural disaster. Worldwide, some peak shaving facilities driven by batteries have also been successfully managed. In other words, as presented in this section, the way to use batteries in a renewable microgrid is crucial to be efficient.
VI. CONCLUSION
This paper proposes a new method to size a BESS integrated in a PV renewable microgrid in order to minimize the cost of stored energy. The originality of this work lies in the different use of real energy and power requirements of a PV microgrid in order to accurately estimate and enhance the BESS lifetime. The definition of a simple BESS model with easily reachable data that describes performances and lifetime subject to C-rate, cycle depth and SOC-level is also a new approach in BESS optimal sizing.
As explained all along this paper, the cost of batteries highly depends on the operating conditions. The results are strongly affected by the lifetime model which shift the optimal cycle depth of the BESS. Power and energy constraints can be relaxed, according to a good system analysis, in order to propose some efficient compromises.
This method is easy to adapt to any type of batteries. Simple cycles have been studied but more complex cycles can be analysed with this method by using the rainflow counting method. The lifetime tracking and prediction can be enhanced by updating the nominal capacity with a more detailed analysis of the system (for example with seasonal power balance distributions).
REFERENCES
[1] International Energy Agency (IEA), “Technology Roadmap Solar Photovoltaic Energy”, 2014 edition.
[2] Greenpeace, “Energy [R]evolution - a sustainable world, Energy Outlook 2015”, fifth edition, September 2015.
[3] Joakim Widen, Ewa Wackelgard, Peter D. Lund, “Options for improving the load matching capability of distributed photovoltaics: Methodology and application to high-latitude data”, Solar Energy 83 (2009) 1953–1966.
[4] A. Anvari-Moghaddam, H. Monsef, A. Rahimi-Kian, and H. Nance. “Feasibility Study of a Novel Methodology for Solar Radiation Prediction on an Hourly Time Scale: A Case Study in Plymouth, UK.” Journal of Renewable and Sustainable Energy, 6 (2014), pp.1-19.
[5] Mohamed A. Eltawil, Zhengming Zhao, “Grid-connected photovoltaic power systems: Technical and potential problems-A review”, Renewable and Sustainable Energy Reviews 14 (2010) 112–129.
[6] Jukka V. Paatero, Peter D. Lund, “Effects of large-scale photovoltaic power integration on electricity distribution networks”, Renewable Energy 32 (2007) 216–234.
[7] A. Oudalov, D. Chartouni, C. Ohler, and G. Linhofer, “Value analysis of battery energy storage applications in power systems”, IEEE Power Systems Conference and Exposition, pp. 2206–2211, 2006.
[8] P. Poonpun and W. T. Jewell, “Analysis of the Cost per Kilowatt Hour to Store Electricity”, IEEE Trans. Energy Conversion, vol. 23, no. 2, pp. 529–534, Jun. 2008.
[9] A. Anvari-Moghaddam, T. Dragicevic, J.C. Vasquez, and J.M. Guerrero. “Optimal Utilization of Microgrids Supplemented with Battery Energy Storage Systems in Grid Support Applications”, 1st IEEE International
Conference on DC Microgrids, (2015), Atlanta, June 7-10.
[10] R. Dufo-López et al., Multi-objective optimization minimizing cost and life cycle emissions of stand-alone PV–wind–diesel systems with batteries storage, Appl. Energy, vol. 88, no. 11, pp. 4033–4041, Nov. 2011.
[11] Bjorn Nykvist, Mans Nilsson, “Rapidly falling costs of battery packs for electric vehicles”, nature climate change, vol. 5, April 2015, p. 329-332. [12] M. Armand, J.-M. Tarascon, “Building better batteries”, nature, vol. 451,
February 2008, p. 652-657.
[13] J. Vetter et al., “Aging mechanisms in lithium-ion batteries”, Journal of Power Sources 147 (2005) 269-281.
[14] Vojtech Svoboda et al., “Operating conditions of batteries in off-grid renewable energy systems”, Solar Energy 81 (2007) 1409-1425. [15] Daniel-Ioan Stroe et al., “Degradation Behaviour of Lithium-Ion Batteries
based on Field Measured Frequency Regulation Mission Profile”, Proceedings of the 2015 IEEE Energy Conversion Congress and Exposition (ECCE), pp. 14 -21.
[16] Madeleine Ecker et al., “Calendar and cycle life study of Li(NiMnCo)O2-based 18650 lithium ion batteries”, Journal of Power Sources 248 (2014) 839-851.
[17] D. Linden, T.B Reddy, Handbook of batteries, McGraw-Hill Education, Third edition, 2001.
[18] M. Castillo-Cagigal et al., “A semi-distributed electric demand-side management system with PV generation for self-consumption enhancement”, Volume 52, Issue 7, July 2011, Pages 2659–2666. [19] Ana-Irina Stan et al., “A comparative study of lithium ion to lead acid
batteries for use in UPS applications”, IEEE 36th Telecommunications Energy Conference (INTELEC), 2014, pp.1-8.
[20] Dirk Uwe Sauer, Heinz Wenzl, "Comparison of different approaches for lifetime prediction of electrochemical systems—Using lead-acid batteries as example", Journal of Power Sources 176 (2008) 534–546.
[21] Henrik Bindner et al., "Lifetime Modelling of Lead Acid Batteries", Risø-R-1515 April 2005, ISBN 87-550-3441-1.
![Fig. 3. Calendar and cycling lifetime model of the BESS (experimental data from [14], cells have been cycled with a C-rate of 1 C at 35°C)](https://thumb-eu.123doks.com/thumbv2/123doknet/14761212.585247/4.893.468.832.78.359/calendar-cycling-lifetime-model-bess-experimental-cells-cycled.webp)