Publisher’s version / Version de l'éditeur:
Vous avez des questions? Nous pouvons vous aider. Pour communiquer directement avec un auteur, consultez
la première page de la revue dans laquelle son article a été publié afin de trouver ses coordonnées. Si vous n’arrivez pas à les repérer, communiquez avec nous à [email protected].
Questions? Contact the NRC Publications Archive team at
[email protected]. If you wish to email the authors directly, please see the first page of the publication for their contact information.
https://publications-cnrc.canada.ca/fra/droits
L’accès à ce site Web et l’utilisation de son contenu sont assujettis aux conditions présentées dans le site LISEZ CES CONDITIONS ATTENTIVEMENT AVANT D’UTILISER CE SITE WEB.
The 4th International Conference on Advance Model Measurement
Technologies for the Maritime Industry (AMT'15) [Proceedings], 2015-10-07
READ THESE TERMS AND CONDITIONS CAREFULLY BEFORE USING THIS WEBSITE.
https://nrc-publications.canada.ca/eng/copyright
NRC Publications Archive Record / Notice des Archives des publications du CNRC :
https://nrc-publications.canada.ca/eng/view/object/?id=aed4d41b-8ee5-400a-9621-39644ac29770 https://publications-cnrc.canada.ca/fra/voir/objet/?id=aed4d41b-8ee5-400a-9621-39644ac29770
NRC Publications Archive
Archives des publications du CNRC
This publication could be one of several versions: author’s original, accepted manuscript or the publisher’s version. / La version de cette publication peut être l’une des suivantes : la version prépublication de l’auteur, la version acceptée du manuscrit ou la version de l’éditeur.
Access and use of this website and the material on it are subject to the Terms and Conditions set forth at
Instrumentation of an offshore platform model for set-down operation
INSTRUMENTATION OF AN OFFSHORE PLATFORM MODEL FOR SET-DOWN OPERATION
A. Akinturk, National Research Council, Canada H. Zaman, National Research Council, Canada
S. Suwan, Arup, USA
E. Kennedy, National Research Council, Canada V. Benson, National Research Council, Canada
T. Ennis, National Research Council, Canada
Abstract: The paper describes the instrumentation used for the measurements of various parameters of interest for a gravity based structure type offshore platform during its set-down model tests. The tests were conducted at the wave basin facility of National Research Council of Canada (NRC). The parameters of interest included motions of the model in six degrees of freedom, parameters describing the environmental conditions such as wave elevations on selected locations in the wave basin, inflow rate of the ballast water and the water levels in the ballast tanks as a function of time, all synchronized. The complexity of the instrumentation arose due to the need to model both external dynamics, i.e. motions, and internal dynamics, i.e. the dynamics of the ballasting operation.
The set-down operation was simulated in different wave conditions. During the tests the motions of the model as it was lowered to the sea floor by the ballasting operation were measured by two different systems. The first one is a motion capture system, which uses cameras and associated software to determine the motions of the model. The second system consisted of an array of accelerometers and digital inclinometers installed inside the model. During the set-down tests the flow into the central compartment inside the model for ballasting operation was controlled by a peristaltic pump. It allowed start/stop/pause on command and ease of change of flow rate. Two associated parameters were recorded by the data acquisition system (DAS): pump-on-off and flow rate. The water collected in the central compartment was eventually distributed into the surrounding ballast compartments during operation. Each compartment was instrumented to record the water levels as a function of time. Synchronization of the data enabled locating and investigating specific events recorded by the DAS.
1. Introduction
Installation at the final destination site, which is sometimes also called as set-down operation, is one of the most important events in the life of a gravity based structure. The operation is carried out under the wind, wave and current conditions, albeit most benign conditions are sought. Hence, it has paramount importance to accurately model the dynamics of a gravity based structure during installation at the design stage. Physical modelling in the form of model testing in a wave basin is one of the common ways to evaluate the performance of the structure.
This paper describes the model and the instrumentation used in the installation tests of a gravity based structure.
2. Facilities and Equipment
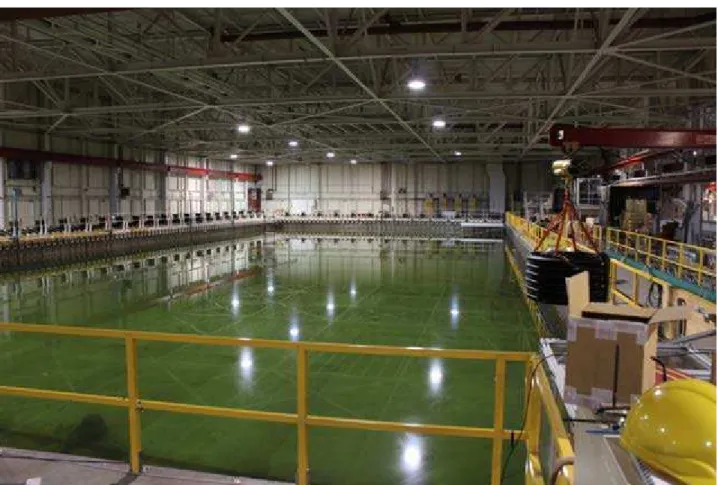
The Offshore Engineering Basin (OEB) facility is a reinforced concrete structure 75 m long, 32 m wide with a wall height of 4 m. Water levels may be varied from 0.1 m to 2.8 m. Waves are generated using 168 individually computer controlled, hydraulically activated, wet back wave maker segments fitted around the perimeter of the compartment in an ‘L’ configuration. Each segment is 2 m high by 0.5 m wide. The wave makers can operate in 3 modes of articulation: flapper, piston or a combination of both modes. These modes optimize segment motion for generating waves in deep, shallow and intermediate water depths, respectively. The maximum wave height is 1.0 m in regular waves and the maximum significant wave height in irregular waves is 0.50 m. Depending on the water depth and wave height, wavelengths up to 23 m can be generated. Passive absorption is accomplished using expanded metal sheets of varying porosities and spacing. The facility also has extensive video coverage and is serviced over its entire working area by a 5 ton lift capacity crane. Fig. 1 shows a picture of the OEB, in which all the tests were performed.
Fig. 1 - Offshore Engineering Basin (OEB)
The OEB is equipped with a wind generation system (Fig. 2). It can be operated in manual or automatic mode and consists of two movable banks of six fans — each fan having six blades, 530mm diameter, 3hp DC motor. The average wind velocity is 11m/s at 1m from the fans and 5m/s at 5m from the fans. Turbulent Wind Spectrum Mean Speed is 12m/s.
Fig. 2 - Wind generation system
For current generation, a 1000 HP recirculating current system (Fig. 3) can be used. The current speed depends on the water depth (0.2m/sec at 2m depth – all in model-scale).
Fig. 3 - Current Generation System at OEB
2.1. Wave measurements in OEB
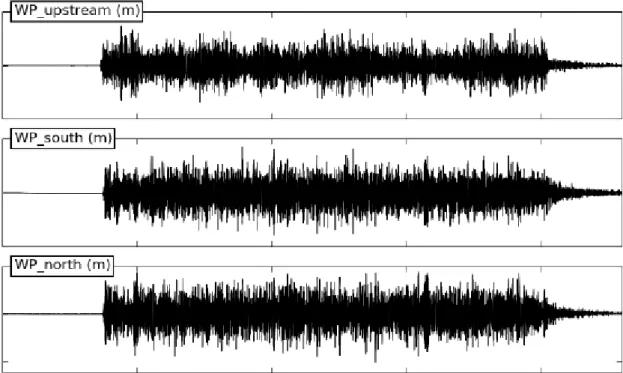
Capacitance based wave probes were used both in the model to measure water levels inside the ballast compartments and in the OEB to measure wave elevations. During the tests, there were three wave probes in OEB (Fig. 4): one probe was located upstream – named WP_upstream, and two at on each side of the model, namely WP_north and WP_south.
2.2. Ballasting pump
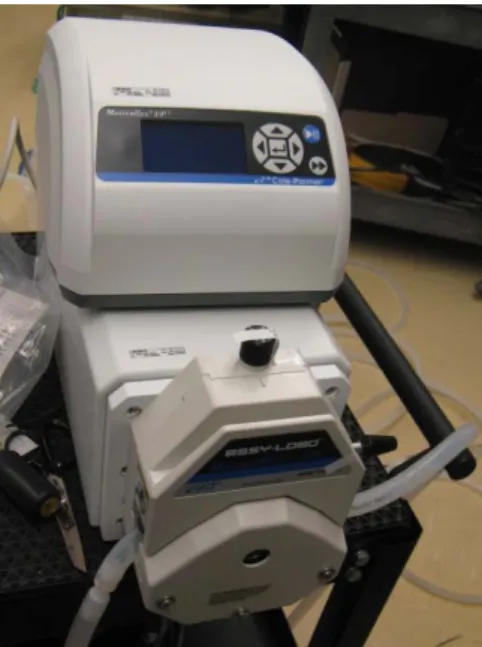
A peristaltic pump (Fig. 5), which had controllable flow rate and NIST (National Institute of Standards and Technology) traceable calibration, was used during the installation tests. It allowed start/stop/pause on command and ease of change of flow rate. In the installation tests, near the touchdown draft, the flow rate was reduced, which was easily handled by the pump. Two associated parameters were recorded by the data acquisition system: pump-on-off and flow rate, which were all synchronized with the rest of the signals. These time traces had helped in identifying certain events in the results.
Fig. 5 - MasterflexTM I/P Precision Process Pump
3. Model Design and Construction
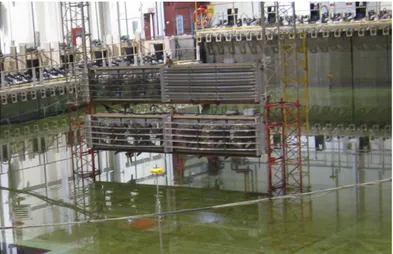
A scale model of the structure was designed and fabricated at NRC for set-down tests. Fig. 6 shows the completed model in the trim tank prior to the inclining tests. The model was designed to be equipped with instrumentation to measure the following:
• Water levels inside the ballasting compartments were monitored by nine capacitance type wave probes
• Three of these ballasting compartments were installed with cameras to monitor ballasting operation in addition to the wave probes.
• Model motions were measured
o Displacements in six degrees of freedom: surge, sway, heave, roll, pitch and yaw
o Accelerations in surge, sway and heave • Ballast water inflow rate were recorded
Fig. 6- A view of the model at the trim tank at NRC
This was a particularly complicated model due to the fact that both internal and external model dimensions had to be scaled correctly to model both internal (ballasting operation) and external dynamics. Aluminum was selected as the fabrication material for the model because its mass density is very close to that of concrete, of which the full scale structure is made.
3.1. Instrumentation
On the model, there were nine wave probes, which measure the water levels inside the compartments, three cameras, an accelerometer array to measure surge, sway and heave accelerations, two digital inclinometers to measure roll and pitch angles and a QualysisTM tree for off model image analysis. The batteries to power these sensors (except the cameras), analog-to-digital conversion boxes and other signal conditioning devices were housed on the instrumentation post, which was located inside the main shaft of the model as shown in Fig. 7.
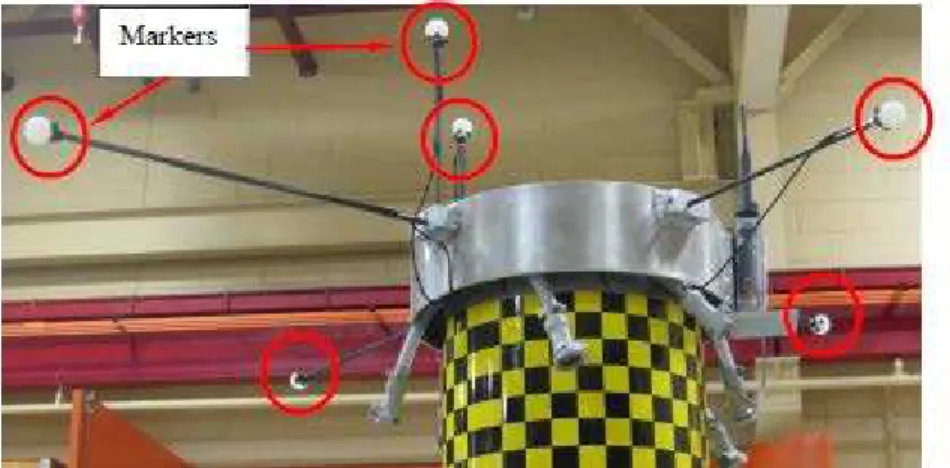
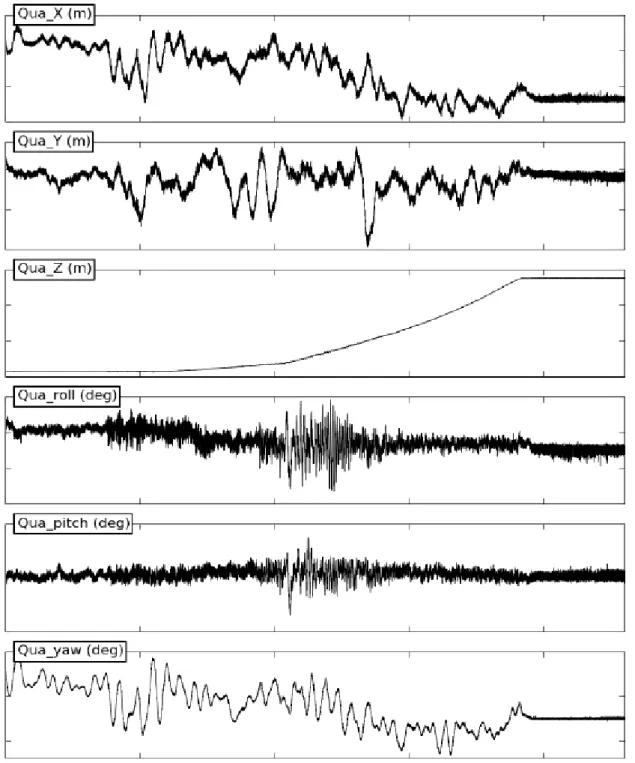
The QualisysTM motion capture system uses cameras and associated software to determine the motions of a body under consideration. The body, whose motions are to be measured, is fitted with special markers, which reflect infrared light. Images are required from at least two cameras are used to determine the motions in six degrees of freedom: three translational and three rotational displacements. Fig. 8 shows the QualisysTM markers as fitted on the model. There were six markers used as shown in the figure. A sample output from the QualisysTM is given in Fig. 9. One can relate the specific events in these displacements to the waves in the wave basin using the wave elevation data, such a sample given in Fig. 10.
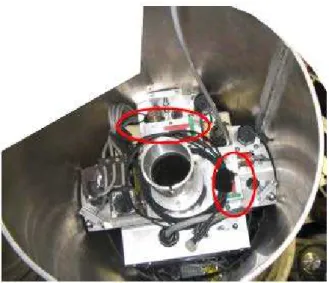
In addition, the model was fitted with an accelerometer array at the top of the instrumentation post (Fig. 11). It measured the accelerations in X, Y and Z directions in model reference frame. In
addition, there were two inclinometers attached to the instrumentation post at the top as shown in Fig. 12. They measured roll and pitch displacements of the model.
Fig. 7- Instrumentation post inside the model
Fig. 9 – Sample output from the QualisysTM, showing the translational and angular displacements of the model as a function of time.
Fig. 10 – Sample wave elevations as a function of time as recorded by the wave probes installed in OEB.
Fig. 12 - Inclinometers
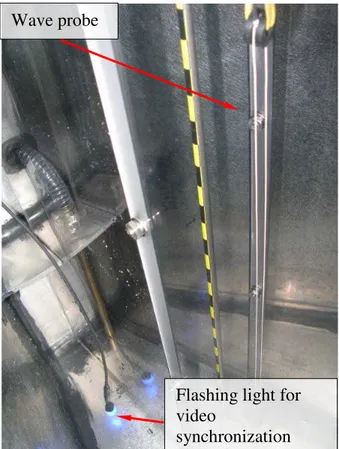
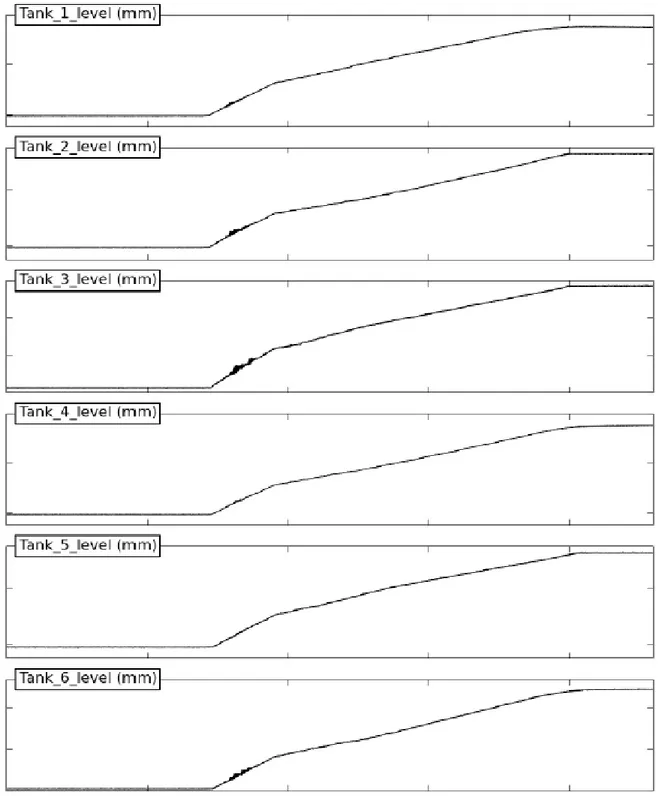
Fig. 13 shows inside of a ballasting compartment. All ballasting compartments had a wave probe installed at their cross sectional area centres. The signals from the wave probes synchronized with the rest of the data acquisition system. Sample output from these wave probes are given in Fig. 14. A programmable flashing light was also used in the three compartments, in which had cameras installed. The lights were used as means to synchronize the video with the other signals.
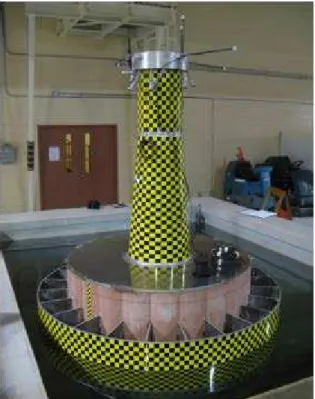
The compartments, which had the cameras, had also yellow and black checkers board patterns glued at certain places in their walls as shown in Fig. 15. These patterns all had the same height and were installed using the same vertical reference. The yellow squares marked with an “X”’ in the figure were at exactly the same height from the floor of the compartment. These served as a secondary reference for the amount and motions of the ballast water inside the compartments.
Fig. 13 - Inside of a ballasting compartments
Five more cameras were positioned around the model in OEB. Two of which was under the water. These cameras were also synchronized with the other data recorded by the data acquisition system. Videos from these cameras assist to identify and explain some of the key events observed in other channels. The sample image given in Fig. 16 is from the camera located downstream of the model. Fig. 17 and Fig. 18 show the side and overhead views of the model during the tests, respectively. The underwater cameras were particularly useful when the model was close to the touchdown. Two underwater views were used in these tests. Sample images are given in Fig. 19 and Fig. 20.
Wave probe
Flashing light for video
Fig. 14 – Sample output from the wave probes installed inside the ballasting compartments showing the amount of water in each compartment as a function of time
Fig. 15 – Sample images from the cameras inside the two of the ballasting compartments. Yellow and black checkers board patterns used as a secondary reference for the water height inside the
ballasting compartments with cameras
Fig. 16- Sample image from the camera located downstream of the model in OEB
X X X X
X X
Fig. 17 - Sample image from the camera located on the side of the model in OEB
Fig. 19 - Sample images from the underwater cameras - view from an underwater downstream location (looking towards upstream direction)
Fig. 20 - Sample images from the underwater cameras - view from side of the model (underwater)
4. Final Remarks
In the preceding, the model and instrumentation used for the set-down tests of a gravity based offshore structure described. Due to the nature of the set-down tests, both internal and external dynamics of the model needed to be modelled. With the water intake, mass properties of the model were continuously changing. Inflow rates into the ballasting compartments were controlled by a peristaltic pump. This enabled accurately achieving the desired ballasting profiles. The motions of the model were measured by QualisysTM image capturing system and a combination of on board
accelerometer array and a pair of inclinometers. Synchronization of the data including the video recordings from the inside and the outside of the model enabled locating and investigating specific events recorded by the DAS.