HAL Id: lirmm-00348551
https://hal-lirmm.ccsd.cnrs.fr/lirmm-00348551
Submitted on 19 Dec 2008
HAL is a multi-disciplinary open access
archive for the deposit and dissemination of
sci-entific research documents, whether they are
pub-lished or not. The documents may come from
teaching and research institutions in France or
abroad, or from public or private research centers.
L’archive ouverte pluridisciplinaire HAL, est
destinée au dépôt et à la diffusion de documents
scientifiques de niveau recherche, publiés ou non,
émanant des établissements d’enseignement et de
recherche français ou étrangers, des laboratoires
publics ou privés.
Scalable 3-D Terrain Visualization Through
Reversible JPEG2000-Based Blind Data Hiding
Khizar Hayat, William Puech, and Gilles Gesquière
Abstract—In this paper a new method is presented for 3-D terrain visualization via reversible JPEG2000-based blind data hiding with special focus on data synchronization and scalability. Online real-time 3-D terrain visualization involves considerable amount of data. The process is essentially the mapping of the aerial photograph, called texture, onto its corresponding digital elevation model (DEM) implying at least two distinct data inputs. The presence of large disparate data necessitates a compression strategy on one hand and the integration of the DEM and texture into one unit on the other. Whilst the compression must accom-modate the scalability requirement originated by the diversity of clients, the unification of data ought to be synchronous. For scalability this paper relies on the multiresolution nature of the DWT-based JPEG2000 standard whereas the synchronized unifi-cation of DEM with the texture is realized by the appliunifi-cation of a perceptually transparent data hiding strategy in the DWT domain. The proposed method is blind in the sense that only a secret key, if any, and the size of the original DEM are needed to extract the data from the texture image. We believe that this is one of the pioneering methods to propose scalable embedding of DEM in the texture image. The method is cost effective, in terms of memory and bandwidths, which is an advantage, especially, in real-time environments when quicker transfer of data is required. The results of a 3-D visualization simulation effected with our method were encouraging and gave a useful insight to the effectiveness of our method in various bandwidth scenarios.
Index Terms—3-D visualization, data hiding, data synchroniza-tion, Digital Elevation Model (DEM), Discrete Wavelet Transform (DWT), Geographic Information System (GIS), JPEG2000.
I. INTRODUCTION
T
HE advent of geo-browsers like Google Earth,1 World Wind2and Virtual Earth3has brought the terrain of earth, and even its neighboring planets in the case of World Wind, to one’s desktop. With each passing day the resolution of theManuscript received January 17, 2008; revised June 24, 2008. Current version published November 17, 2008. This work was supported in part by the Higher Education Commission (HEC) of Pakistan. The associate editor coordinating the review of this manuscript and approving it for publication was Dr. Xiaolin Wu.
K. Hayat and W. Puech are with the Laboratory LIRMM, UMR CNRS 5506, University of Montpellier II, 34392 Montpellier Cedex 05, France (e-mail: [email protected], [email protected]).
G. Gesquière is with the LSIS, UMR CNRS 6168, University of Aix-Mar-seille, IUT, 13200 Arles, France (e-mail: [email protected]).
Color versions of one or more of the figures in this paper are available online at http://ieeexplore.ieee.org.
Digital Object Identifier 10.1109/TMM.2008.2004905
1http://www.earth.google.com/. 2http://www.worldwind.arc.nasa.gov.
3http://www.microsoft.com/virtualearth/default.mspx.
aerial photographs and satellite imagery which is being made available to these browsers ameliorates. All this comes at a cost as far as memory requirements are concerned. For example, a 5 meters/pixel resolution aerial photograph of a small district re-quires well over ten gigabytes of storage, even in the JPEG2000 compressed form. Alongside the storage is the network factor, when it comes to online real-time 3-D visualization, since the data must be transferred from the server towards a client appli-cation in a timely way. In such a client/server environment the visualization quality becomes dependent on the payload, band-width, distant server and data transfer rate. To cope with the aforementioned challenges, any strategy that would not focus on data compression is unthinkable. But there is more to com-pression strategy than meets the eye since the clients are diverse in terms of resource capacity and requirements. Thus one client may have a powerful workstation while others may have just a smart-phone. Similarly one client may have a 100 Mbps connec-tion whereas the other may be using a 56 kbps dial up modem. Still one client may want to view a precise location at high ac-curacy but others may just want to quickly browse through the globe. There is also a possibility that the network path of a client may involve at least one weak link or node. In between these extremes, there may be thousands of clients with varying ca-pabilities and needs. Moreover, the preferences of a client may adapt to his capacity, e.g. a client handicapped by bandwidth may be more interested in real-time visualization without inter-ruption than in high resolution. A synchronized mechanism is needed so that the server is in a better position to cater for each of its client. The wide spectrum of clients thus necessitates the data compression to be ideally scalable for each hierarchy of clients. The JPEG2000 standard [10] serves this purpose since it is wavelet-oriented and wavelets have the property of mul-tiresolution. The diversity of resolutions, that are resulting from a wavelet decomposition at various levels, is capable of offering the scalability needed in the situations discussed.
The 3-D visualization information is in general stored in three different files: digital elevation model (DEM), an orthorecti-fied photo and projection system and geo-referencing employed. The process of visualization in three dimensions is, essentially, the linking of the aerial photograph of the terrain, called texture, with the geometry of the terrain, called DEM. Each of the DEM coefficient represents the altitude of a particular square block of texture pixels and the process of visualization is the overlaying of texture over a regular triangle network [17], [23] obtained from the DEM. This linking is possible by geo-referencing the coordinates (longitude/latitude) of these elements depending on the scale and system of projection used. Rather than using two disparate DEM and texture files it is advisable to interleave them 1520-9210/$25.00 © 2008 IEEE
like GeoJP2 [6] and GMLJP2 [15] but these serve the purpose partially since the data is not synchronized and there is an in-crease in the original size of the JPEG2000 file. It would be ex-pedient to follow a different course, to have the advantage of synchronization without any change in the JPEG2000 file size and form, by applying a scalable data hiding algorithm. This ap-proach would neither be XML-based, like GMLJP2, nor would it introduce some kind of Universally Unique IDentifier (UUID) boxes, like GeoJP2.
This work is a continuation of our previous efforts [7], [8] for the synchronized unification of the DEM and texture wherein lossless DWT decomposition level of both the message (trans-formed DEM) and the carrier (trans(trans-formed Y plane of the tex-ture) are the same before embedding. Moreover, in the current paper, the method is more detailed and the results have been improved. The crux of our argument is to realize a 3-D visu-alization system that will cater for the two desirable require-ments, i.e., scalability and synchronized unification of 3-D data, without developing any new proprietary file format and main-taining compression performances. For scalability the DWT-based JPEG2000 standard can be relied upon for its multires-olution characteristic due to wavelets. In addition JPEG2000 is the standard that is fast establishing itself. The synchronized in-tegration of the disparate 3-D data into one whole is achiev-able through the application of a perceptually transparent data hiding technique in the transform domain. All this crystallizes to the proposal of an LSB-based strategy that would embed the lossless transformed DEM in the corresponding transformed lu-minance component of texture of the lossless JPEG2000 coding pipeline. For the extraction step, the proposed method is blind and only the size of the original DEM is needed for extraction.
The rest of the paper is arranged as follows. Section II presents the essential concepts and previous work relevant to our approach. Our method is explained in Section III while the results which we obtained are elaborated in Section IV. Section V concludes the paper.
II. 3-D TERRAIN VISUALIZATION, JPEG2000, ANDDATAHIDING
This work relies on a JPEG2000-based data hiding technique in order to achieve synchronous and scalable 3-D terrain visual-ization. In this context it would be worthwhile to present the no-tions of 3-D terrain visualization (Section II-A) and JPEG2000 (Section II-B). Alongside, related work on data hiding in the
zoom in and out, fly through and manipulate them. However, the chronic challenge persisted because the viewer just observed a snapshot of the 3-D models projected to a 2-D computer screen. The recent years’ technological developments have now made it possible to create realistic 3-D terrain models from scanned contour maps and other data sources.4The popularity and im-portance of 3-D terrain visualization is increasing day by day in many areas, for example decision making, 3-D urban models, flight and driving simulations, and more generally, multiplayer applications.
Geographic data can be broadly classified into four funda-mental classes: raster images, vector data, elevations and spatial databases. Images include aerial photos, scanned maps, satellite imagery and the like. Aerial photographs are the starting point for many mapping projects. By vector data is meant the tradi-tional geometric structures like polylines, points, and polygons that have been used to represent roads, streams, power lines, lakes, county boundaries and topographic lines, on a particular scale. In digital form (e.g. digital line graphs) this representa-tion has the advantage of having files much less heavier than images. Moreover such a data can be resized without any loss of clarity. Elevations are usually in the form of grid of terrain heights recorded at regularly spaced horizontal intervals: the re-sult being a DEM. DEMs are used to create 3-D images of a landscape when overlaid by the corresponding 2-D aerial photos or satellite images thus producing, for example, lighting effects to reveal hills and valleys. The repositories of information like census data, resource inventory data and spatial event data con-stitute spatial databases that are helpful to a mapmaker in spe-cial cases, e.g. highlighting regions in the map or forecasting changes in the terrain.
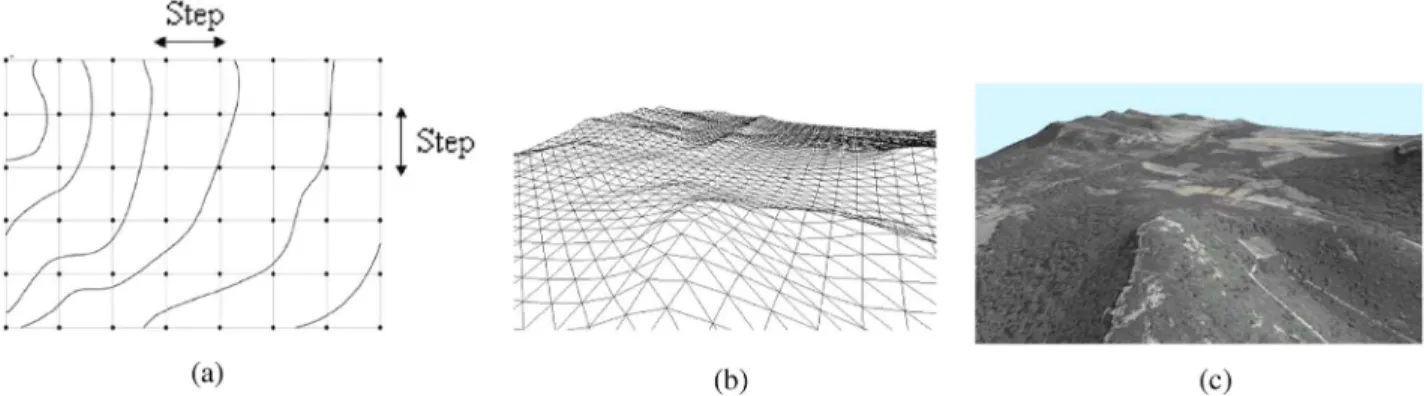
Essentially, 3-D terrain representation implies to use two kinds of data combined for the visualization [19].
• Height field data which corresponds to the elevation of ter-rain [Fig. 1(a)]. It is defined by a grid of points separated by a given step. These points are used to generate the ge-ometry and are connected by triangles [Fig. 1(b)]. • Aerial photographs can be acquired in various spectral
do-mains such as visible or infrared. Theses are used to map 3-D triangles previously computed [Fig. 1(c)].
In order to get the DEM, the simplest solution consists of using a uniform discretization of the terrain. This gives a good
Fig. 1. (a) Visualization of the uniform grid corresponding to the elevations of the terrain, (b) 3-D triangulated surface linking the elevations, and (c) Texture mapping the ortho-photograph onto the geometry.
accuracy but leads to a quite large number of triangles, thus im-plying a considerable memory cost for the 3-D visualization of a large area. Many methods have been proposed to reduce the number of triangles provided by the uniform discretization, while preserving a good approximation of the original surface. One of the main approaches consists of obtaining an irregular set of triangles: Triangulated Irregular Network (TIN). A great deal of work has been done in order to create the TIN starting from a height field by using, for example, a Delaunay triangu-lation [5] or a progressive mesh representation [9]. Hierarchical representations of these triangulations have been proposed, thus making it possible to introduce the concept of level of detail [4]. Consequently one can obtain various levels of surfaces with an accuracy which is similar to a uniform grid but with a lower number of triangles.
To obtain a three dimensional visualization, one has to bind the texture to the terrain DEM. This bond is allowed by geo-referencing coordinates (longitude and latitude) depending on the projection system used. The information is usually stored in three different files; one for the DEM, one for the texture and one for the geo-referenced coordinates. By mapping the satellite or aerial image on the corresponding 3-D terrain model. Thus, a realistic 3-D model can be created with the elevations and the surface texture.
In our work we have relied on the data provided by IGN5 France which consists of vectorial data in the form carto, raster images in the form BD Ortho or BD Scan and DEM usually at 50 m resolution. We seek to put in place the correspondence between the texture and its DEM. Using a uniform grid would allow this mapping since one would be able to do the similar thing for the ground and the images. The proposed method is about the interleaving of the above data to get a single file.
B. Discrete Wavelet Transform and JPEG2000
In standard image compression techniques, one of the essen-tial steps is the domain transformation. The transform results in the decorrelation of the pixels. Pixel energy is thus compacted into a small number of coefficients. The idea is to enable the quantization step to trim the samples selectively, i.e., irrelevant samples must be quantized more heavily than the relevant ones
5http://www.ign.fr/.
[28]. One aspect of the success of JPEG [24] is in the efficiency of its transform, i.e., discrete cosine transformation (DCT) ap-plied to each image block of 8 8. But the use of block-based transforms rests on the unrealistic assumption of the indepen-dence of blocks.
Of the alternatives available to the block-based transforms the one that got the approval of JPEG2000 [10] proponents is the discrete wavelet transform (DWT). The key being its mul-tiresolution nature resulting in subbands containing some level of detail derived from the whole image or at least a consider-ably large tile, if the image is of very large size. The quality in such a situation is incremental as the lowest subband has the most important and relevant information and the higher sub-bands have finer details. Most of the energy is thus compacted into a few large transform coefficients—an entropy coder easily locates these coefficients and encodes them. DWT offers better energy compaction than the DCT without any blocking artifact after coding. In addition the DWT decomposes the image into an L-level dyadic wavelet pyramid. The resultant wavelet coef-ficient can be easily scaled in resolution as one can discard the wavelet coefficients at levels finer to a given threshold and thus reconstruct an image with less detail.
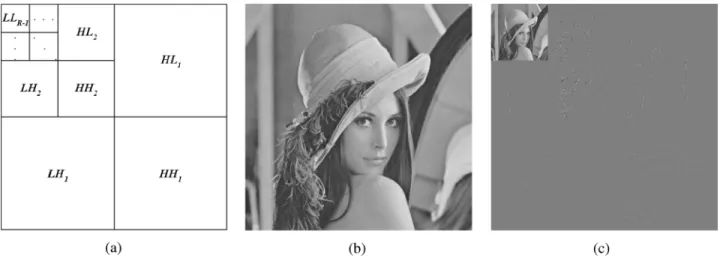
The multiresolution nature of DWT, therefore, makes it ideal for scalable image coding. After the color transformation, the DWT decomposes each component (luminance Y and chromi-nance Cr and Cb) into numerous frequency bands called sub-bands. For each level, DWT is applied twice, once row-wise and once column-wise and hence four subbands result: 1) horizon-tally and vertically lowpass , 2) horizontally lowpass and vertically highpass , 3) horizontally highpass and verti-cally lowpass and 4) horizontally and vertically highpass . Let us consider the input image signal (or tile-compo-nent signal if image is large) as the band. A -level wavelet decomposition is associated with resolution levels. Each subband of the decomposition is identified by its orienta-tion (i.e., , , , and ) and its corresponding decom-position level . At each resolution level (except the lowest) the band is further decomposed. Thus the band is decomposed to yield the , , and bands. Then, at the next level, as illustrated in Fig. 2(a), the band is decomposed. This process is repeated until the band is obtained. If no transform is applied then there
Fig.2. DWT: (a) Subband structure, (b) Lena, and (c) Lena at level 2 DWT decomposition.
Fig. 3. Generalized scheme of the JPEG2000 encoder.
is only one subband: the subband. A level-2 wavelet de-composition of the image Lena, given in Fig. 2(b), is illustrated in Fig. 2(c).
Right from the beginning, JPEG2000 has been supporting two kinds of transforms: the reversible integer-to-integer Daubechies (5/3) and the irreversible real-to-real Daubechies (9/7) [3], [27] with the former being lossless and the latter being lossy. The transformation can then be carried out by separately applying the version horizontally and vertically one after the other. Let the (pixel row or pixel column) input signal be then for the reversible 5/3 wavelet transform the lowpass subband signal
and highpass subband signal are given
by
(1) In a simplified way, a typical JPEG2000 encoder6consists of the following steps [28] which are illustrated in Fig. 3.
1) Preprocessing such as tiling and shifting the origin of the pixel values to 0 by subtracting 128.
2) Intercomponent transform in the form of irreversible or re-versible color transform to pass from RGB space to YCrCb space.
3) Intracomponent transform that may be lossy or lossless DWT.
4) Quantization which decreases the size of the large coeffi-cients and nullifies the small ones.
5) Tier 1 coding when the quantized coefficients are parti-tioned into rectangular code blocks and each is subjected independently to three coding passes. This step involves entropy coding too.
6http://www.ece.uvic.ca/~mdadams/jasper/.
6) Tier 2 coding which is the packetization step whereby the code pass data is converted to packets—these packets are combined to get the final image in the JPEG2000 format. It must be noted that in a JPEG2000 coding pipeline there are two primary sources of data loss. One is obviously quanti-zation and the other is the stage in tier-1 coding when a decision is made about the exclusion of certain coding passes from the final JPEG2000 file. For the method proposed in this paper, the scalability prospects offered by JPEG2000 in the form of mul-tiresolution is to our advantage, especially in the client/server environment.
C. Data Hiding in the Wavelet Domain
Data hiding is an established field and that is why a lot has been written about it [2], especially for the last two decades. We, therefore, focus on the literature about wavelet-based data hiding which is again very extensive and one is compelled to be brief. Data hiding deals with embedding an information, called message, inside some host signal, like image, sound or video, called cover. The message may be small and robust as in the case of copyright protection in the form of watermarking or it may be large, critical and statistically invisible as in steganography. Four factors [1] characterize the effectiveness of a data hiding method, namely hiding capacity, perceptual transparency, ro-bustness and tamper resistance. Hiding capacity refers to the maximum payload that can be held by the cover. Perceptual transparency ensures the retention of visual quality of the cover after data embedding. Robustness is the ability of the cover to withstand various signal operations, transformations and noise whereas tamper resistance means to remain intact in the face of malicious attacks. The relative importance of these four factors depends on the particular data hiding application. For example,
for visually sensitive applications perceptual transparency be-comes very important. Domain-wise, embedding can be car-ried out in the spatial domain or the transform domain. Pixel or coefficient allocation for data embedding may be regular (e.g. every pixel) or irregularly distributed (e.g. pseudo-random). Probably the most preferred pixel allocation is by running a pseudo-random number generator (PRNG) using some secret key as a seed. Finally, an embedding method is blind if data ex-traction by the recipient does not require the original cover.
Many methods have been proposed in the literature for wavelet-based data hiding but few of these are compatible with the JPEG2000 scheme. According to [21], data hiding methods for JPEG2000 images must process the code blocks independently and that is why methods like inter-subband em-bedding [12] and those based on hierarchical multiresolution relationship [14] have not been recommended. In the same breath the authors of [21] rejects the correlation-based method [29] as well as non-blind methods. The reason for this is the limited number of coefficients in a JPEG2000 code-block that are likely to fail in reliably detecting the hidden information in a single independent block. There are methods [13], [30] for embedding invisible watermarks by adding pseudo-random codes to large coefficients of the high and middle frequency bands of DWT but the methods have the disadvantage of being non-blind. The blind scheme proposed in [26] is to integrate data hiding with the Embedded Block Coding with Optimized Truncation (EBCOT) and embed data during the formation of compressed bit stream. The scheme is claimed to have robustness and good perceptual transparency. One particular technique [20] embeds the watermark in the JPEG2000 pipeline after the stages of quantization and region of interest (ROI) scaling but before the entropy coding. For reliability purposes the finest resolution subbands are avoided. A window sliding approach is adopted for embedding with the lowest frequencies having higher payload. Piva et al. have proposed an authen-tication scheme that embeds an image digest in a subset of the subbands from the DWT domain [25]. The image digest is derived from the DCT of the level 1 DWT subband of the image. The resultant DCT coefficients are scaled down by quantization and ordered from most to least significant through a zig-zag scan. A most significant subset, after discarding the DC coefficient, is quadruplicated for redundancy and then rescaled and scrambled by using two different keys. This gives the message which is substituted to the subbands selected from a set obtained by the further wavelet decomposition of the level 1 and subbands of the original image. One blind method [16] transforms the original image by one-level wavelet transform and sets the three higher subbands to zero before inverse transforming it to get the modified image. The difference values between the original image and the modified image are used to ascertain the potential embedding locations of which a subset is selected pseudo-randomly for embedding. The method of Kong et al. embeds watermark in the weighted mean of the wavelets blocks, rather than in the individual coefficient, to make it robust and perceptually transparent [11]. While explaining their method of embedding biometric data in
fingerprint images, Noore et al. argue against the modification of the lowest subband to avoid degradation of the reconstructed image as most of the energy is concentrated in this band [22]. Instead they propose to redundantly embed information in all the higher frequency subbands.
D. Geographical Metadata Integration into the JPEG2000 Codestream
As far as the insertion of GIS information, as metadata, into a JPEG2000 coding pipeline is concerned there have been lim-ited efforts to date. There are already efforts like GeoJP2 [6] and GMLJP2 [15] for the integration of geographical data with the related aerial photographs. The GeoJP2 is a GeoTIFF-inspired method for adding geospatial metadata to a JPEG2000 file. The GeoTIFF specification7defines a set of TIFF tags provided to describe all cartographic information associated with TIFF im-agery that originates from satellite imaging systems, scanned aerial photography, scanned maps and DEM. Its aim is to allow means for tying a raster image to a known model space or map projection, and to describe those projections. GeoTIFF does not intend to become a replacement for existing geographic data interchange standards. GeoTIFF uses a small set of reserved TIFF tags to store a broad range of georeferencing information, catering to geographic as well as projected coordinate systems needs. It uses numerical codes to describe projection types, co-ordinate systems, datums and ellipsoids.
The additions made to the box-based JPEG2000 format are two UUID boxes, namely, the GeoTIFF box and the optional world file box. The former contains a degenerate GeoTIFF file and the resultant JPEG2000 file have the same level of geospatial metadata as is provided by the GeoTIFF standard. The mechanism is simple using the widely supported GeoTIFF implementations but the introduction of new UUID boxes have the disadvantage that there is an increase in the original JPEG2000 file size. The GMLJP2 envisages the use of the Geography Markup Language (GML) within the XML boxes of the JPEG 2000 data format in the context of geographic imagery. A minimally required GML definition is specified for geo-referencing images while also giving guidelines for encoding of meta-data, features, annotations, styles, coordinate reference systems, and units of measure as well as packaging mechanisms for both single and multiple geographic images. DEMs are treated the same way as other image use cases whereas coordinate reference system definitions are employed using a dictionary file. Thus DEM is either provided as TIFF file and its name is inserted between proper GML tags or its points are directly inserted into the GMLJP2 file. In the former case, there is no reduction in the number of files whereas in the latter case the amount of data is increased.
III. THEPROPOSEDMETHOD
As described in Section II-A, the 3-D visualization needs more than one file: the DEM and the image of texture being the essential. To coalesce this disparate data to a single JPEG2000
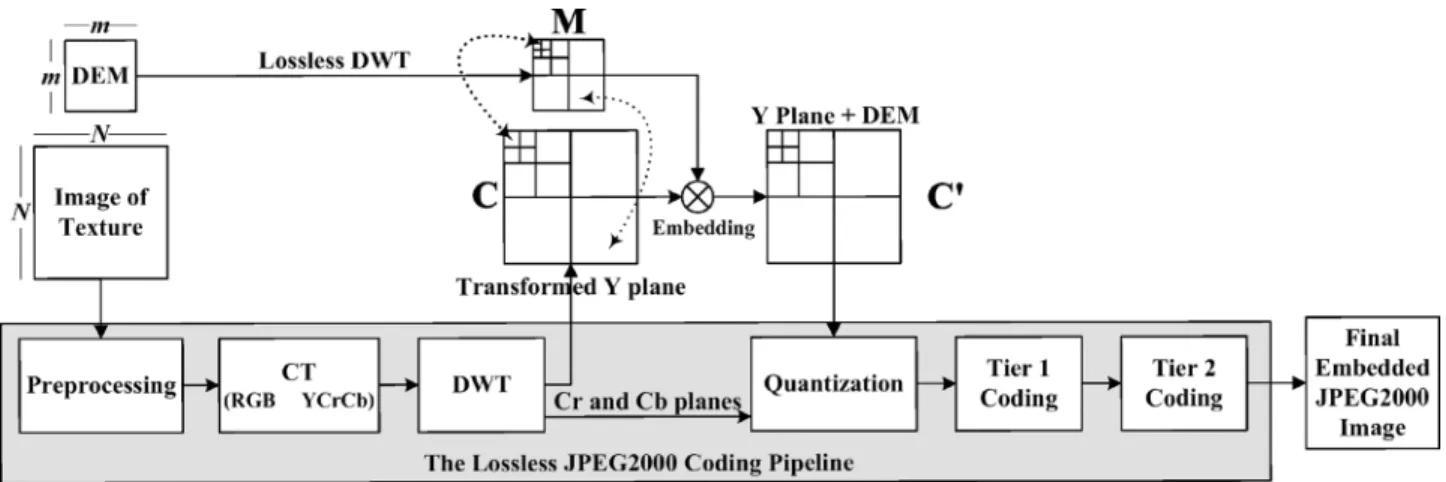
Fig. 4. Description of the method: embedding transformed DEM coefficients into the transformed coefficients of each Y texture subband.
file, while taking into account the requirements of synchroniza-tion and scalability, we propose a data hiding-based method. An overview of the method is given in Section III-A. Section III-B presents the transformation of the DEM and the texture. The embedding is explained in Section III-C while the decoding and 3-D visualization are elaborated in Section III-D.
A. Overview
In this work the thrust is on the performance of the proposed method by the inclusion/exclusion of high frequency subbands in the DWT resolution hierarchy rather than modifying the data by quantization or tier-1 coding. That is why the JPEG2000 encoder has been set at the lossless mode and the wavelet trans-form is integer-to-integer. As already stated, the scalability prospects offered by JPEG2000 in the form of multiresolution is to our advantage, especially in the client/server environment. In a nutshell, our method is the LSB-based embedding of lossless wavelet transformed DEM into wavelet transformed luminance (Y) plane of texture extracted from a reversible JPEG2000 coding pipeline after the DWT step. Because of the small embedding factor needed for our application, we have chosen to embed the data only in the Y component in order to have a fast extraction and to preserve a better bitrate. The marked Y plane of texture is then reinserted to the JPEG2000 coding pipeline. Two factors have been taken into account in the course of embedding. First, the level of transform in both the cases, i.e., DEM and texture, is the same. Second, there is a synchronization in embedding: low subband DEM coefficients are to be embedded into those of low subband of texture while higher ones in the higher. The method is blind since there is no need of original texture image at the decoding side. The final image format is thus JPEG2000 compliant implying that there is no need of additional technology for the proposed method. A generalized scheme of the method is given in Fig. 4.
B. Transformation to Get the Cover and the Message
The two files of DEM and texture are the inputs whereby the former would process into the message and the latter would give the cover in the data embedding step. The DEM consists of 16 bit coefficients that represent the elevations in the form of al-titudes. Each of these coefficients corresponds to a particular square block of pixels in the texture. Texture is already a color
image in some standard format with RGB components. From the size of the DEM we can calculate the ratio between a DEM coefficient and its associated block of texture. Lossless DWT is applied, in isolation, to the DEM at a particular level, say that corresponds to resolutions. The resultant coef-ficients constitute the bits of our message in the traditional sense of data hiding. In fact, to represent the DEM in the spa-tial domain, only 14 bits per coefficient are necessary (altitude between 8192 m and 8191 m), but after the DWT 16 bits are necessary to represent each coefficient. Simultaneously, the RGB space texture image is introduced to a standard JPEG2000 encoder. The encoder, after necessary preprocessing, passes it from RGB space to the luminance-chrominance (YCrCb) space. In the next step, i.e., DWT step, the three YCrCb components are reversibly transformed at level . As can be seen in Fig. 4, the encoding path is diverted, after the DWT step, as far as the luminance (Y) image is concerned. The transformed Y compo-nent is our cover . Note that whether it is the transformation of the DEM or it is the JPEG2000 encoder for texture, the im-plementation of DWT is based on the lifting method [18] that employs the JPEG2000 supported reversible Daubechies (5/3) filter [3].
C. Embedding of the Data
This section explains the embedding of the message into the cover to get the marked cover . It has been ensured that both and are at the same level of transformation and embedding is according to the synchronization of subbands as illustrated in Fig. 4. One important point to mention is that in this work neither any copyright problem is solved nor is there any threat to the security of message. What we want is to carry out embedding without significant loss in the visual quality of the 3-D rendering. At the same time, the hiding capacity is also important since day by day the resolution quality is improving at the expense of data size. Hence, of the traditional requirements of data hiding, we are more particular about perceptual trans-parency and payload which implies that robustness and tamper resistance are secondary in importance.
From a pixel texture image and the corresponding map of altitudes, we deduce the embedding factor
altitude coefficients per pixel. To ensure a spatial co-herence between the altitudes and the texture, the cover is
partitioned into square blocks of coefficients for data embedding and every such block would hide one transformed altitude coefficient of the message . We thus achieve a syn-chronization in the embedding as far as the incremental levels of the wavelets are concerned, i.e., low resolution coefficients of the altitude map are embedded in the low resolution subbands of texture whereas high resolution coefficients of the altitude map are embedded in the high resolution subbands. In this way the transmission of the part concerned with the low resolution of the texture map enables us to directly access the corresponding low resolution part of the altitude map.
For perceptual transparency, an embedding strategy based on least significant bit (LSB) substitution is proposed. The data embedding is carried out by modifying the LSBs of a certain number of coefficients of the luminance plane of the texture. An allocation policy is needed to determine which coefficients are to carry the message. These coefficients are chosen by using a PRNG with a key, , as a seed. The use of a secret key allows us to restrict access to DEM data. Since the chosen JPEG2000 coding is reversible the hidden message can be extracted loss-lessly. A high level description of the embedding strategy is out-lined in Algorithm 1.
Algorithm 1 The embedding strategy
1: begin
2: read which is level- transformed Y texture from the JPEG2000 coding pipeline
3: read the corresponding DEM file as an image 4: apply lossless DWT to DEM at level to get 5: for each subband of and its counterpart in do
6: partition the subband into square blocks in relation to the subband
7: initialize a PRNG with a seed
8: for each correspondence of subband block and its subband coefficient do
9: for to 15 do
10: generate the index which is the next pseudo-random
number to get
11: get the subband coefficient
12: substitute the LSB of with the bit of 13: end for
14: end for
15: end for
16: label the block-wise marked as 17: end
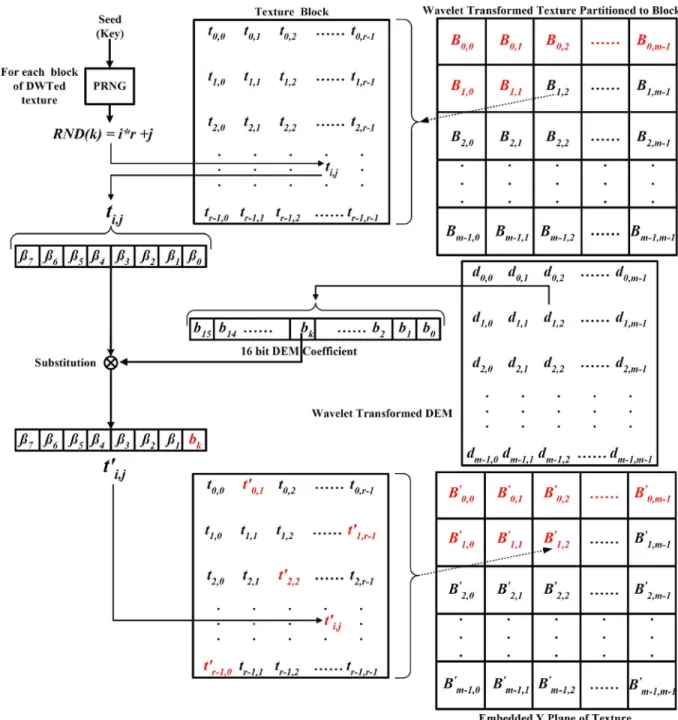
In Fig. 5, we illustrate the low level detail of the embedding procedure. Let the transformed DEM coefficients
are represented by , where . The
transformed Y plane of texture is consequently
par-titioned into blocks , with .
Each of is composed of coefficients
, with . Let and
be the bitwise representations of 16 bit and the 8 bit , respectively. Embedding involves the hiding of each of the 16 bits in as many different coefficients of the given block. These coefficients are selected by running a PRNG using the key for one time initialization. The PRNG that will generate 16 numbers per which correspond to the allocated coefficients. Care must be taken to avoid collisions so that the same subscript is not generated twice. One of the bits would substitute the LSB of the
allocated coefficient that would yield
after embedding. Hence 16 of the coefficients of each of the embedded block would be changed from to . The procedure mentioned in the previous lines is followed for each block of the transformed Y texture and for each subband of , as described in Algorithm 1.
The resultant embedded image, , i.e., marked Y plane of the texture in the wavelet domain, is then reinserted into the JPEG2000 pipeline at the same point from where it was ex-tracted. The final encoded image thus carries the DEM coef-ficients hidden in some DWT coefcoef-ficients.
D. Extraction and Scalable 3-D Reconstruction and Visualization
The above coded image can be utilized like any other JPEG2000 image and sent across any communication channel. The decoding is the reverse of the above process. Since the method is blind, only the secret key is needed, along with the size of the original DEM, to recover the hidden DEM coefficients at the receiving end. Just before the inverse DWT stage of the JPEG2000 decoder, the DEM can be extracted using the above mentioned partitioning scheme and PRNG with as the seed. All the DEM bits are LSBs of the coefficients, indexed by the PRNG sequence, in the luminance plane of the carrier texture.
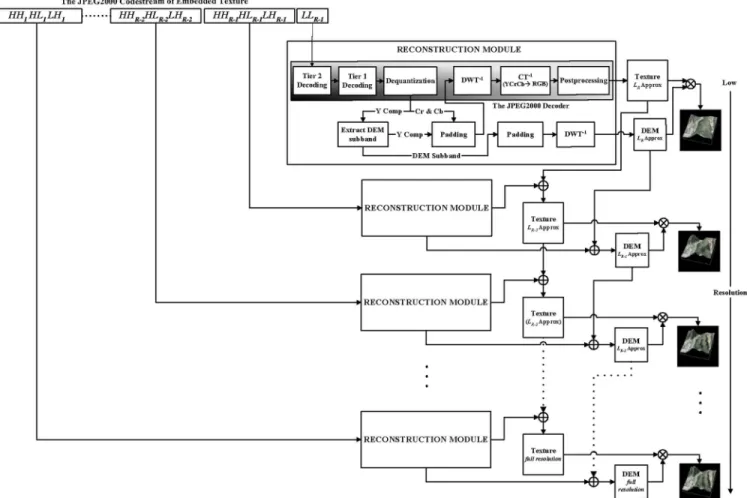
One advantage of the method is in the fact that the DEM and texture can be reconstructed at the original size, even if we have only a small subset of the coefficients of the cover. The reso-lution scalability of wavelets and the synchronized character of our method enable a 3-D visualization even with a number of layers smaller than the number of original resolution layers as a result of partial or delayed data transfer. The method thus en-ables to effect a visualization from a fraction of data in the form of the lowest subband, of a particular resolution level. The idea is to have a 3-D visualization utilizing lower frequency subbands out of the initial subbands , by padding a 0 for each of the coefficient of the rest of the high frequency parts. Indeed, it is always possible to stuff 0’s for the higher bands. Hence a reconstruction with level lowest frequency subband is effected with just percent of the count of the original coefficients: the result would be what is called level approximation image. With this padding
ap-proach, irrespective of the number of subbands used for the re-construction, the reconstructed DEM and texture have the same spatial sizes as the original ones. The reconstruction procedure
Fig. 5. Embedding a subband of the transformed DEM coefficient in a block from a subband of the transformed texture.
from a JPEG2000 codestream of the marked texture is depicted in Fig. 6.
It is important to note that level wavelet decomposition corresponds to resolution levels in the range to 0 in ascending order of quality as well as quantity of data. This implies different visualizations of which the first one requires only the lowest subband. The second visualization would require four subbands which include the previous one, , and three others namely
and . Seven subbands, ,
, , and constitute
the data for third visualization. In general visualization is
based on lowest subbands , ,
, and . All the
sub-bands are necessary for the highest quality visualization.
In a loose sense, any given resolution is a superset of all the preceding ones. The scalability has its origin in the fact that one can have different images of approximation. Choice can be dynamically made among these different options depending on the client’s resources, constraints and requirements as well as network and distance considerations. A client with a pow-erful platform and high available bandwidth may be able to download all the data timely and decode the level 0 JPEG2000 image to get the highest quality visualization. On the other hand a client on a smart-phone and weak communication signal may have to be content with a small subset of subbands (Fig. 6) which it will stuff with 0’s for higher frequency bands during the decoding process to get the approximation rather than the original image with the improvement of signal he may have the luxury to go for higher quality. All this becomes more critical
Fig. 6. Decoding, data extraction and scalable 3-D reconstruction and visualization.
in the real-time case since now the frame rate, for example, can become more important than the quality and one can compromise over latter to certain extent. In essence, even for a very small fraction of the number of initial coefficients, of the texture and its DEM, one can have a 3-D visualization that is considerably cost effective.
IV. RESULTS
This section has two parts. In Section IV-A we analyze the application of our method when applied to an example altitude map of 64 64 coefficients [Fig. 7(a)] associated with a 3200 3200 pixel texture [Fig. 7(b)]. For the purpose of comparison a 128 128 pixel detail of the above mentioned image of texture is presented in Fig. 7(c). Section IV-B is concerned with the 3-D visualization simulation with respect to another example that is to be demonstrated at high and low bitrates.
A. Analysis of the Method as Applied to a Real World Example
For the example illustrated in Fig. 7, each coefficient of the altitude is coded with 2 bytes implying the embedding factor of 1 coefficient per 50 50 pixels of texture. The application of a level 1 lossless wavelet transformation to the DEM results in Fig. 8(a). The corresponding transformed Y-plane of the tex-ture [Fig. 8(b)] is extracted in situ from the JPEG2000 encoding process of the texture image. The same set of images for level 3 are illustrated in Fig. 8(c) and (d).
To analyze the quality of the embedded texture image, with respect to the original, the measure of PSNR (peak signal to noise ratio) has been employed:
(2) where mean square error (MSE) is a measure used to quan-tify the difference between the initial image and the distorted image . If the image has a size of then
(3) In order to judge compression performance, a measure called bitrate, which is the amount of necessary bits per pixel (bpp), is utilized:
Strictly speaking, DEM is a set of altitude coefficients rather than pixels which requires some modifications in the defini-tion of the above measures. Hence, instead of bitrate, a mea-sure we call bits per coefficient (i.e., amount of information per altitude coefficient) has been used. Since altitudes are ex-pressed in meters, it would be better to use MSE in square meter unit for error measurement. For a more comprehensive explana-tion one can rely on the one dimensional version of root mean
Fig. 7. Example images: (a) Original altitude map, (b) Original texture map, and (c) a part of texture magnified.
Fig. 8. DWT at Level 1: (a) altitude, (b) Y Plane of texture. DWT at Level 3, (c) altitude, and (d) Y plane of texture.
square error (RMSE) which is the positive square root of MSE: . Embedding of the transformed DEM in the transformed texture takes place according to the policy ex-plained in Section III. It is worthwhile to note that, in general, the data embedding at level decomposition takes place in partitions. Hence for the DWT at level 1 [Fig. 8(a)] the embedding has been done in four partitions ( , , and ) whereas for level 3 wavelet decomposition, the em-bedding of data has been realized in ten partitions. The marked luminance plane of texture is reintroduced to the JPEG2000 coding pipeline at the point where it was extracted and thus the output is JPEG2000 compliant. No matter what is the level of decomposition , degradation in the texture image, due to data embedding, amounts to a mean square error (MSE) of 0.01 corresponding to a PSNR of 68.5 dB. This is attributed to the meager embedding factor of altitude coefficients per pixel since only one 16 bit DEM coefficient is embedded per 50
50 block of coefficients of the Y component of texture. Fig. 9(a) shows an altitude map reconstructed from the coeffi-cients extracted from a level 1 image of approximation of the embedded texture image. The reconstruction has been done by stuffing 0’s in place of the three higher subbands and sub-sequently applying inverse DWT. Thus only 25% of the count of the initial coefficients have been used for reconstruction. The difference of this image with the original altitude is illustrated in Fig. 9(b). When the above process of reconstruction is applied
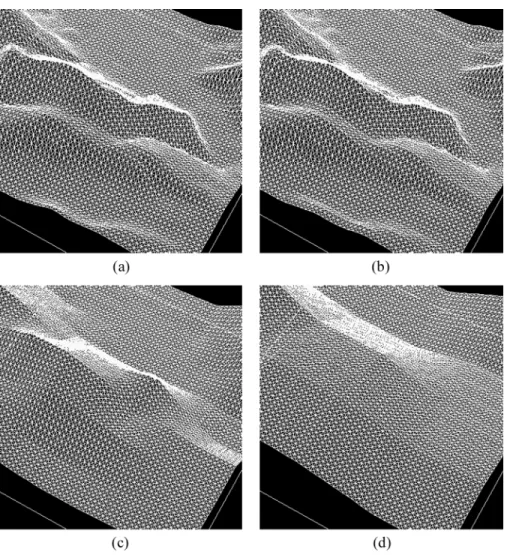
to the level 1 lowest subband of the embedded texture image Fig. 9(c) is obtained. For comparison with the original example, the 128 128 pixel magnified part is shown in Fig. 9(d). The same sequence of four figures, i.e., to , is maintained in each of the Fig. 10–12 which corresponds to the reconstruction from levels 2 to 5 lowest subbands, respectively. For subjective anal-ysis, one can visually compare the part of Fig. 7, with the same of each of Fig. 9–12. There is certainly degradation in the visual quality but it is far more less in the face of the quantity of data utilized for reconstruction, e.g. level 3 reconstruction has been carried out with only 1.56% of the total coefficients. The degra-dations in the quality of texture are presented in Fig. 13 in the form of difference images in terms of the magnified part corre-sponding to Fig. 7(c).
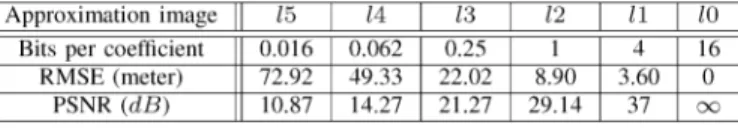
Objectivity demands a quantitative comparison which we have done in terms of the images of difference by observing the measures, like MSE or PSNR, as a function of bitrate. The results are summarized in Table I for the DEM and Table II for the texture. The effectiveness of our method is revealed by the fact that even for a bitrate as low as 0.26 bpp (corresponds to level 3 approximation image of texture, Table II) one observes
a of 25.47 dB corresponding to a for DEM
of 22.02 meters (Table I). Given the fact that being computed from a small fraction of initial data, this error is tolerable if the observation is made from a high altitude. To elaborate further, MSE has been plotted as a function of bitrate for the texture
Fig. 9. Reconstruction of the images from the approximation image at Level 1: (a) extracted altitude, (b) difference image between the original altitude and the extracted one, (c) texture, and (d) magnified part of texture corresponding to Fig. 7(c).
Fig. 10. Reconstruction of the images from the approximation image at Level 2: (a) extracted altitude, (b) difference image between the original altitude and the extracted one, (c) texture, and (d) magnified part of texture corresponding to Fig. 7(c).
Fig. 11. Reconstruction of the images from the approximation image at Level 4: (a) extracted altitude, (b) difference image between the original altitude and the extracted one, (c) texture, and (d) magnified part of texture corresponding to Fig. 7(c).
Fig. 12. Reconstruction of the images from the approximation image at Level 5: (a) extracted altitude, (b) difference image between the original altitude and the extracted one, (c) texture, and (d) magnified part of texture corresponding to Fig. 7(c).
3, and (c) Level 5.
TABLE I
RESULTSOBTAINED FORDEM AFTER THEEXTRACTION AND
RECONSTRUCTION AS AFUNCTION OF THEUSEDDATA(for level 0,
all of the transmitted data is used for reconstruction)
TABLE II
RESULTSOBTAINEDAFTER THEEXTRACTION ANDRECONSTRUCTION OF THETEXTURE AS AFUNCTION OF THEUSEDDATA
IN THEFORM OFEMBEDDEDTEXTURE
[Fig. 14(a)] and as a function of bits per coefficient for DEM [Fig. 14(b)]. In the latter case, we have plotted MSE against bits per coefficient due to the fact that rather than the whole JPEG2000 encoding only DWT has been applied to the DEM coefficients. As can be seen in Fig. 14(a) the MSE decreases as further levels of information are added to the image of approximation, e.g. for 1.06 bpp (level 2) the MSE is 107.97 and for 4.14 bpp (level 1) the MSE is 42.01. A similar trend is observed in case of for the DEM [Fig. 14(b)]. For 3-D visualization, the acceptable quality of both DEM and texture is a function of the distance between the 3-D surface and the viewpoint. The more this viewpoint is near the 3-D surface, better must be the quality of both DEM and texture.
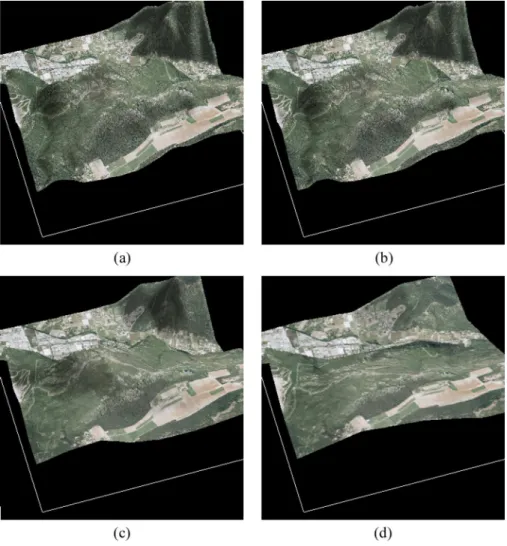
The reconstructed 3-D surfaces drawn from the various ap-proximation DEMs are shown in Fig. 15. These surfaces when overlaid by their corresponding textures effect 3-D visualiza-tions (Fig. 16). One can compare the final result between a 3-D visualization with all the data [Fig. 16(a)], after being subjected to our method, and a visualization with the level 1, 2, 3 and 4 [Fig. 16(b)–(e)], corresponding to 25%, 6.25%, 1.56%, and 0.39% of the transmitted coefficients, respectively.
B. Simulation Example
To present an application of our method it would be worth-while to run a practical visualization simulation. The inputs used in the simulation example are given in Fig. 17. The DEM (64 64) from Fig. 17(a) and its corresponding 3200 3200 aerial image [Fig. 17(b)] are subjected to our method. Two series of simulations were effected with one based on full resolution, i.e., level 0 approximation images, and the other on level four images of approximation. Some snapshots of the simulations, at regular intervals, from a transmitted image sequence of more than 300 images are presented.
Five different snapshots from the 3-D visualization of our ex-ample are illustrated Fig. 18 for level 0 (corresponding to a bi-trate of 240 Mbps) and Fig. 19 for level 4 (corresponding to a bitrate of 640 kbps). The snapshots are at regular intervals when the distant observer is coming closer and closer to the terrain and such they are taken as a function of the decreasing aerial distance of the viewer from his point of focus. The viewer’s aerial posi-tion is the same for the two bitrates (240 Mbps in Fig. 18 and 640 kbps in Fig. 19) at a given interval. The difference is obvious but not glaring given the fact that the data of Fig. 19 corresponds to only 0.39% of the number of coefficients of the data of Fig. 18. This lower than expected degradation in quality motivate us to have an effective scalable visualization. For example a 3200 3200 aerial image requires 30 MB of storage employing a 240 Mbps bandwidth requirement if only one image is to be trans-ferred per second. In other words a 100 Mbps connection would require 2.4 seconds for a single image to transfer and the same for wireless networks is arround 1200, 625, 133 and 48 seconds for EDGE (200 Kbps), 3G (384 Kbps), HSDPA (1.8 Mbps), and WIFI (5 Mbps), respectively. A level 4 approximation of the same embedded image in JPEG2000 format would have a size in the order of 80 KB implying the requirement of 640 kbps for transferring one image per second. With EDGE one can transfer one such image in about 3 s and WIFI can transmit eight such images/s. Level 5 approximation may further reduce the payload and now one can transfer one image per second over EDGE and 32 images over WIFI making the latter suitable for video based streaming.
For the level 4 approximation, a closer examination of Fig. 19 reveals that of the DEM/texture pair it is the DEM which is af-fected the most in terms of quality. This means that the DEM is
Fig. 14. Graphical display of variation in quality as a function of bitrate: (a) texture and (b) DEM.
Fig. 15. The 3-D surface representation using the extracted DEMs and obtaining their approximations at various levels. (a) Level 0 (all the data), (b) Level 1, (c) Level 3, and (d) Level 4.
Fig. 16. The 3-D visualization with the approximation images at various levels. (a) Level 0 (all the data), (b) Level 1, (c) Level 3, and (d) Level 4.
Fig. 17. Example altitude/texture pair utilized in the visualization simulation: (a) original altitude map and (b) original texture map.
more sensitive than the texture to a partial reconstruction. This sensitivity of DEM necessitates the fact that the level of wavelet decomposition could be lower for DEM than texture before em-bedding. Since the size of DEM file is much smaller than that of the texture, the lowest frequency subband at some level can be used for embedding. But this would undermine the perceptual transparency since the embedding density of the energy-richer part would be increased. Moreover, the synchronization man-agement between DEM and texture would be more difficult and this could be be costlier in terms of time.
V. CONCLUSION
In this paper we presented a new method for a scalable 3-D terrain visualization through reversible JPEG2000-based blind data hiding. This paper is focused on the topic of data synchro-nization and scalability. The results reveal that the proposed method offers at least three advantages. First is the synchro-nized integration of disparate 3-D data into one whole by the application of data hiding. The second advantage is the scala-bility in 3-D visualization through the utilization of JPEG2000 supported DWT. Last, but not the least, is the integrability of the method with the JPEG2000 encoders to result in a mono-lithic standalone JPEG2000 format file that eliminates the need to develop any additional technology or data format, thus im-plying portability and conformance which is asked by our in-dustrial constraints. In addition the approach is cost effective in terms of memory and bandwidths. The results shown in the case of our examples are witness to this fact since even with a tiny number of coefficients a comparatively better 3-D visualization was effected. The resolution scalability of wavelets enables this 3-D visualization to improve incrementally with the reception of higher frequencies/subbands. Besides, this property is helpful in real-time environment when quicker transfer of data is required. The results of 3-D visualization simulation give a useful insight
Fig. 18. Snapshots of the 3-D visualization simulation based on level 0 (for 240 Mbps) images of approximation extracted and reconstructed from the DEM embedded texture.
Fig. 19. Snapshots of the 3-D visualization simulation based on level 4 (for 640 kbps) images of approximation extracted and reconstructed from the DEM embedded texture.
to the effectiveness of our method in various network condi-tions.
In the continuation of this work it would be worthwhile to develop a method based on lossy wavelets to further decrease bitrate. This option will however eliminate, to a considerable extent, the possibility of very high quality visualization since the lossy case is not fully reversible. A situation may thus arise that losing details of texture becomes less important than that of DEM. Using a desynchronized algorithm would be a good way and should be taken into consideration in the near future. The LSB-based embedding strategy adopted in this work has to be reconsidered for the lossy case and it will be important to ex-plore some other embedding strategies, like the spread spectrum embedding [2], in order to keep DEM quality high for the recon-struction. As far as triangulation is concerned, there is also every likelihood of using a non-uniform grid on various levels of de-tails, thus allowing a considerable reduction in the number of tri-angles necessary for a good representation of the terrain. In this paper links between tiles are not managed but our future focus is likely to be on the strategies to generate a soft transition be-tween several tiles without cracks. In future, the streaming man-agement between the server and its clients is also being mulled.
REFERENCES
[1] W. Bender, D. Gruhl, N. Morimoto, and A. Lu, “Techniques for data hiding,” IBM Syst. J., vol. 35, no. 3–4, pp. 313–336, Feb. 1996. [2] I. J. Cox, M. L. Miller, and J. A. Bloom, Digital Watermarking. San
Mateo, CA: Morgan Kaufmann, 2002.
[3] I. Daubechies and W. Sweldens, “Factoring wavelet transforms into lifting steps,” Fourier Anal. Appl., vol. 4, no. 3, 1998.
[4] L. D. Floriani and E. Puppo, “Hierarchical triangulation for multires-olution surface description,” ACM Trans. Graph., vol. 14, no. 4, pp. 363–411, 1995.
[5] R. J. Fowler and J. J. Little, “Automatic extraction of irregular network digital terrain models,” in Proc. International Conference on Computer
Graphics and Interactive Techniques (ACM SIGGRAPH’79), New
York, 1979, pp. 199–207.
[6] M. P. Gerlek, The “GeoTIFF Box” Specification for JPEG 2000 Meta-data—DRAFT Version 0.0 LizardTech, Inc., 1008 Western Ave Suite 200. Seattle, WA, 98104, Apr. 2004.
[7] K. Hayat, W. Puech, and G. Gesquière, “An efficient data-hiding method based on lossless JPEG2000 for a scalable and synchronized visualization of 3D terrains,” in Proc. 15th Eur. Signal Processing
Con-ference (EUSIPCO 07), Poznan, Poland, Sep. 2007, pp. 2519–2523.
[8] K. Hayat, W. Puech, G. Gesquière, and M. Chaumont, “Wavelet based data-hiding of DEM in the context of real time 3D visualization,” in
Proc. SPIE, Electronic Imaging, Visualization and Data Analysis, San
Jose, CA, Jan. 2007, vol. 6495, no. 20, p. 64 950N(1-10), SPIE, IS&T. [9] H. Hoppe, “Progressive meshes,” in Proc. International Conference
on Computer Graphics and Interactive Techniques (ACM SIG-GRAPH’96), New Orleans, LA, 1996, pp. 99–108.
[10] ISO/IEC, ISO/IEC 15444-1: Information Technology, JPEG2000 Image Coding System, Part 1: Core Coding System ISO Central Secretariat: CH-1211. Geneva, Switzerland, 2004.
[11] X. Kong, Y. Liu, H. Liu, and D. Yang, “Object watermarks for digital images and video,” Image Vis. Comput., vol. 22, pp. 583–595, 2004. [12] D. Kundur, “Improved digital watermarking through diversity and
at-tack characterization,” in Proc. ACM Workshop on Multimedia
Secu-rity’99, Orlando, FL, Oct. 1999, pp. 53–58.
[13] D. Kundur and D. Hatzinakos, “A robust digital image watermarking scheme using the wavelet-based fusion,” in Proc. IEEE International
Conference on Image Processing (IEEE ICIP 97), Santa Barbara, CA,
Oct. 1997, vol. 1, pp. 544–547.
[14] D. Kundur and D. Hatzinakos, “Digital watermarking using multires-olution wavelet decomposition,” in Proc. IEEE Int. Conf. Acoustic,
Speech and Signal Processing (IEEE ICASSP 98), Seattle, WA, May
1998, vol. 5, pp. 2969–2972.
[15] R. Lake, D. Burggraf, M. Kyle, and S. Forde, GML in JPEG 2000 for Geographic Imagery (GMLJP2) Implementation Specification Open Geospatial Consortium (OGC), 2005, no. OGC 05-047r2.
[16] J. L. Liu, D. C. Lou, M. C. Chang, and H. K. Tso, “A robust water-marking scheme using self-reference image,” Comput. Stand.
Inter-faces, vol. 28, pp. 356–367, 2006.
[17] F. Losasso and H. Hoppe, “Geometry clipmaps: Terrain rendering using nested regular grids,” ACM Trans. Graph., vol. 23, no. 3, pp. 769–776, 2004.
[22] A. Noore, R. Singh, M. Vatsa, and M. M. Houck, “Enhancing security of fingerprints through contextual biometric watermarking,” Forensic
Sci. Int., vol. 169, no. 2–3, pp. 188–194, 2007.
[23] R. Pajarola and E. Gobbetti, “Survey on semi-regular multiresolution models for interactive terrain rendering,” Visual Comput., vol. 23, no. 8, pp. 583–605, June 2007.
[24] W. B. Pennebaker and J. L. Mitchell, JPEG: Still Image Data
Com-pression Standard. New York: Springer, 1992.
[25] A. Piva, F. Bartolini, and R. Caldelli, “Self recovery authentication of images in the dwt domain,” Int. J. Image Graph., vol. 5, no. 1, pp. 149–166, 2005.
[26] P. C. Su, H. J. Wang, and C. C. J. Kuo, “An integrated approach to image watermarking and JPEG-2000 compression,” J. VLSI Signal
Process. Syst., Special Issue on Multimedia Signal Processing, vol.
27, no. 1–2, pp. 35–53, Jun. 1997.
[27] W. Sweldens, “The lifting scheme: A new philosophy in biorthogonal wavelet constructions,” in Proc. SPIE, Electronic Imaging, Wavelet
Ap-plications in Signal and Image Processing, San Jose, CA, Sep. 1995,
vol. 2569, pp. 68–79.
[28] D. S. Taubman and M. W. Marcellin, JPEG2000: Image Compression
Fundamentals; Standards and Practice. New York: Springer, 2002. [29] H. J. Wang and C. C. Kuo, “An integrated approach to embedded image
coding and watermarking,” in Proc. IEEE International Conference on
Acoustic, Speech and Signal Processing (IEEE ICASSP 98), Seattle,
WA, May 1998, pp. 3271–3275.
[30] X. G. Xia, C. G. Boncelet, and G. R. Arce, “A multiresolution water-mark for digital images,” in Proc. IEEE Int. Conf. Image Processing
(IEEE ICIP 97), Santa Barbara, CA, Oct. 1997, pp. 548–551.
William Puech was born in December 1967 in France. He received the diploma of Electrical Engi-neering from the University of Montpellier, France, in 1991 and the Ph.D. degree in signal-Image-speech from the Polytechnic National Institute of Grenoble, France, in 1997.
He started his research activities in image pro-cessing and computer vision. He served as a Visiting Research Associate to the University of Thessa-loniki, Greece. From 1997 to 2000, he had been an Assistant Professor in the University of Toulon, France, with research interests including methods of active contours applied to medical images sequences. Since 2000, he is Associate Professor at the University of Montpellier, France. He works now in the LIRMM Laboratory (Laboratory of Computer Science, Robotic and Microelectronic of Montpel-lier). His current interests are in the areas of protection of visual data (image, video and 3-D object) for safe transfer by combining watermarking, data hiding, compression and cryptography. He has applications on medical images, cultural heritage, and video surveillance. He is the head of the ICAR team (image and interaction).
Gilles Gesquière received the Ph.D. in computer science from the University of Burgundy, France, in 2000.
He is currently an Assistant Professor at the LSIS Laboratory, Aix-Marseille University, France. His re-search interests include geometric modeling, 3-D vi-sualization and deformation. He is currently working on projects focused on 3-D geographical information systems.