Publisher’s version / Version de l'éditeur:
Lighting Research & Technology, 38, 4, pp. 358-378, 2006
READ THESE TERMS AND CONDITIONS CAREFULLY BEFORE USING THIS WEBSITE.
https://nrc-publications.canada.ca/eng/copyright
Vous avez des questions? Nous pouvons vous aider. Pour communiquer directement avec un auteur, consultez la première page de la revue dans laquelle son article a été publié afin de trouver ses coordonnées. Si vous n’arrivez pas à les repérer, communiquez avec nous à PublicationsArchive-ArchivesPublications@nrc-cnrc.gc.ca.
Questions? Contact the NRC Publications Archive team at
PublicationsArchive-ArchivesPublications@nrc-cnrc.gc.ca. If you wish to email the authors directly, please see the first page of the publication for their contact information.
Archives des publications du CNRC
This publication could be one of several versions: author’s original, accepted manuscript or the publisher’s version. / La version de cette publication peut être l’une des suivantes : la version prépublication de l’auteur, la version acceptée du manuscrit ou la version de l’éditeur.
For the publisher’s version, please access the DOI link below./ Pour consulter la version de l’éditeur, utilisez le lien DOI ci-dessous.
https://doi.org/10.1177/1477153506070994
Access and use of this website and the material on it are subject to the Terms and Conditions set forth at
Occupant use of switching and dimming controls in offices
Boyce, P. R.; Veitch, J. A.; Newsham, G. R.; Jones, C. C.; Heerwagen, J.; Myer, M.; Hunter, C. M.
https://publications-cnrc.canada.ca/fra/droits
L’accès à ce site Web et l’utilisation de son contenu sont assujettis aux conditions présentées dans le site LISEZ CES CONDITIONS ATTENTIVEMENT AVANT D’UTILISER CE SITE WEB.
NRC Publications Record / Notice d'Archives des publications de CNRC: https://nrc-publications.canada.ca/eng/view/object/?id=ca8e3c7e-da38-4eb4-97d3-e31b27c1035f https://publications-cnrc.canada.ca/fra/voir/objet/?id=ca8e3c7e-da38-4eb4-97d3-e31b27c1035f
O c c u p a n t u s e o f s w i t c h i n g a n d d i m m i n g
c o n t r o l s i n o f f i c e s
N R C C - 4 8 1 8 2
B o y c e , P . R . ; V e i t c h , J . A . ; N e w s h a m , G . R . ;
J o n e s , C . C . ; H e e r w a g e n , J . ; M y e r , M . ;
H u n t e r , C . M .
A v e r s i o n o f t h i s d o c u m e n t i s p u b l i s h e d i n
/ U n e v e r s i o n d e c e d o c u m e n t s e t r o u v e
d a n s : L i g h t i n g R e s e a r c h & T e c h n o l o g y , v .
3 8 , n o . 4 , 2 0 0 6 , p p . 3 5 8 - 3 7 8 d o i :
1 0 . 1 1 7 7 / 1 4 7 7 1 5 3 5 0 6 0 7 0 9 9 4
Occupant use of Switching and Dimming Controls in Offices
PR Boyce PhD*, JA Veitch PhD†, GR Newsham PhD†, CC JonesBFA‡, J. Heerwagen PhD‡, M Myer MS*, CM Hunter MS*
*
Lighting Research Center, Rensselaer Polytechnic Institute, Troy, NY, USA.
†
National Research Council of Canada, Institute for Research in Construction; Bldg M-24 1200 Montreal Road; Ottawa, Ontario KIA OR6; Canada. E-mail: jennifer.veitch@nrc-cnrc.gc.ca
‡
Battelle Memorial Institute / Pacific Northwest National Laboratory, Lexington, MA, USA.
Abstract
As part of a larger study sponsored by the Light Right Consortium, temporary office workers spent a day in an office working under one of four different lighting installations. For two of these installations the office workers had the freedom to adjust the lighting of the cubicles they occupied: either with a switchable desk lamp, or varying the direct component of a
continuously dimmable overhead direct / indirect luminaire. This paper examines the
illuminances chosen under these two conditions, compares the results with those found in other field and laboratory studies, and addresses pertinent questions about the behaviour of office workers when they have the freedom to adjust the lighting of their workspaces.
1. Introduction
National and international standards set specifications for office lighting based on consensus among lighting experts using knowledge of the effects of light on visual performance and visual comfort, the available lighting technology, the cost of lighting equipment and
electricity, and feedback from actual installations.1-4 However, several investigations have found that, given a choice, many office workers select illuminances that differ from those
recommended by lighting authorities, with an average illuminance that is often lower than the recommendations.5-10 This paper reports the illuminances chosen by participants in a field simulation study in which two experimental conditions allowed individual control,11 and uses comparable data from other studies to address several questions. Specifically:
• How frequently do office workers use lighting controls? • What illuminances do office workers choose?
• Are different illuminances chosen for different lighting designs? • Are different illuminances chosen for different types of task?
• What would be the optimum illuminance for a fixed office lighting installation? • How do the chosen illuminances relate to recommendations?
• What are the implications of the chosen illuminances for energy consumption? • Do the chosen illuminances have an effect on task performance?
• Does having illuminance choice affect office workers’ perceptions and moods?
2. Method
2.1 Setting
The field simulation study took place in a renovated office building in Albany, New York. A full description of the office and its furnishing is given elsewhere.11,12 The areas of relevance to this paper are the cubicles in the working area, which is where the participants spent most of their time (Figure 1). As is typical in North America, the cubicles were formed from systems furniture. The finishes and furnishings of the cubicles and the working area in which they were located are summarized in Table 1. A computer monitor was positioned at the angle of
the L-shaped work surface in each cubicle, with the CPU on the floor below the work surface and the keyboard and mouse resting on a retractable shelf that could be pulled out and raised over a limited range as desired by the user. The monitor tilt was set to 12○ from vertical and participants were not permitted to change it. The luminance of the monitor showing a white display but without any room lighting was set at 120 cd/m2. On one side of the monitor was a document holder, angled so as to place a sheet of paper in the document holder in a similar plane as the screen of the computer monitor (Figure 2). Blinds were fitted to the windows and
positioned so that there was no direct view of the sky from any of the cubicles. The combined effects of the surrounding buildings and the blinds was to severely limit the amount of daylight admitted into the space yet still to allow a view out. The average illuminance on the cubicle work surfaces from daylight alone was typically 20 lx.
2.2 Lighting Manipulations
Four different lighting installations were used in the study but only two allowed any choice. Participants were randomly assigned to a lighting condition and to a cubicle with either grey or blue panels. The lighting equipment for the cubicle area is summarized in Table 2. The two conditions relevant to this paper were called:
Switching Control: In this installation, the lighting of the cubicle area was a suspended direct / indirect luminaire, and in addition each cubicle was fitted with a free-standing desk lamp with a translucent shade, which the occupant was free to operate by changing the setting of the switch at any time (Figure 3). The settings available were 0, 13, 26 and 37 W. The lamp was set to 26 W at the start of the day. The perimeter walls had additional wall-washing.
Dimming Control: This condition provided greater control over workstation lighting to the occupant, while maintaining adequate ambient illuminance. Each cubicle had centred over it a suspended direct / indirect luminaire (Figure 2). The indirect component (1 lamp) operated at a fixed level, and the occupant could change the level of the direct portion of the luminaire output at any time using an interface on the computer in the workstation. The initial level was set to 50%, although because of the non-linear relationship between the dimming scale in percent and the actual light output, this setting did not correspond to the mid-point of the range of
illuminance. The perimeter walls had additional wall-washing.
2.3 Possible Illuminances
Illuminance measurements were made at the following positions, for every cubicle:
Open Desk: Horizontal illuminance measured at a point 10 cm from the edge of the desk located in the centre of the side of the desk without an overhead filing bin.
Keyboard: Illuminance in the middle of the keyboard
Keyboard-Screen: Horizontal illuminance on the desk between the keyboard and the monitor screen
Screen: Illuminance on the face of the monitor screen
Face of occupant: Vertical illuminance at a point equivalent to the face of a person sitting at the keyboard and facing the monitor; expected to be highly correlated to the illuminance at the eye
Document holder – L: Illuminance on the document holder when to the left of the monitor
Document holder – R: Illuminance on the document holder when to the right of the monitor
Under filing bin: Horizontal illuminance measured at a point 10 cm from the edge of the desk located in the centre of the side of the desk with an overhead filing bin
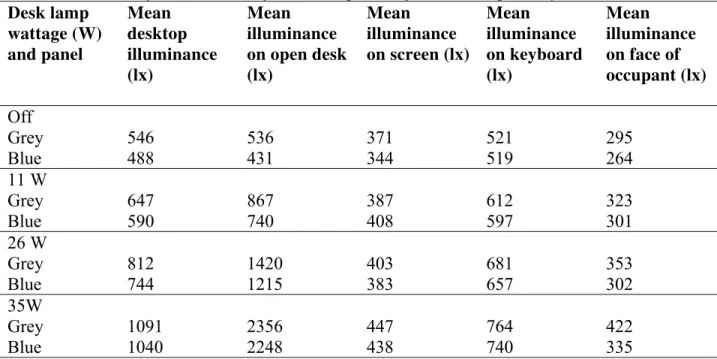
To condense these data into one number a mean desktop illuminance was calculated, this being the average of the illuminances on the open desk, the keyboard, the keyboard-screen, and under the filing bin. Table 3 shows the mean illuminances, averaged over the cubicles, with the grey and blue panels separately, for the Switching Control installation, and Table 4 shows the same data for three settings of the Dimming Control installation, averaged over all cubicles, with the grey and blue panels separately.
2.4 Participants
The participants were recruited from an office temporary services agency; and paid at the agency rate for the days they worked. They were all over 18 years of age and were required to have experience with WindowsTM-based word processing and spreadsheet software and a minimum typing speed of 30 words per minute, and have normal or corrected-to-normal vision and hearing. This paper is based on the valid lighting choice data from 33 people who
experienced the Switching Control installation and a different set of 57 people who experienced the Dimming Control installation. None of the 33 people in the Switching Control group had done the experiment under a different lighting installation. In the Dimming Control group, 13 people had previously carried out a day's work under a different lighting installation (a regular array of parabolic luminaires providing a fixed illuminance), and 44 had not previously taken part in the experiment.
2.5 Daily Schedule
The participants spent one day working in a cubicle in the office for each lighting condition they experienced. During this day, the participants undertook a range of activities designed to measure visual and cognitive task performance; mood; satisfaction; vision capability; ratings of task and environmental competence, motivation, room appraisal, and lighting
preferences. Full details of these activities are given elsewhere;11 these activities involved reading from high-contrast printed paper or from the computer and typing responses into the computer. The day was divided into four sessions by the occurrence of morning coffee break, lunch break, and afternoon coffee break. Most of the tasks and questionnaires repeated in each session in the same order. Some tasks required the participant to leave the cubicle to retrieve information from filing cabinets or to take part in a group discussion. These activities were the exception rather than the rule; the participants spent most of their time, alone, in their cubicle. The strictly scheduled pattern of work ensured that all the participants undertook the same activities at similar times throughout the day. Participants were free to use the lighting control available to them at any time.
3. Results
Changes in cubicle lighting were automatically recorded throughout the day. The
resulting data were examined to ensure that only meaningful lighting choices were included. For example, when there occurred a rapid series of changes in chosen illuminance over a two-minute period, only the last setting was retained on the assumption that a rapid series of changes
represented an attempt by the participant to hone in on the desired setting, represented by the final value. We then converted these system-saved dimming levels to equivalent illuminances using photometric measurements for each dimming level in each workstation.
3.1 How frequently do office workers use lighting controls?
The patterns of lighting control use are somewhat similar for the two forms of control. Some people never changed the lighting from the initial setting, but most who did change the lighting did so only once, usually at the start of the day (Table 5). Seventy-nine percent of the illuminances used in session 4 of the Switching Control condition were set in session 1. Eighty-two percent of illuminances used in session 4 in the Dimming Control condition were set in session 1. Similarly, other field studies in offices have observed the same pattern for the control of the whole lighting installation from a switch by the door;13 for manual switching of individual luminaires through pull cords;14 for overriding indirect luminaires that were automatically dimmed according to the level of daylight,15 and for pairs of recessed parabolic luminaires in offices in four different buildings, where each pair could be switched separately to different levels from a local signalling device.10 These findings from independent studies conducted at different times on different continents with different levels of technology imply a common, stable pattern of behaviour. This is to use the switching and dimming lighting controls to set the light level to what is expected for the day’s work at the beginning of the day, and then to change it only when essential.
3.2 What illuminances do office workers choose?
We consider the illuminances prevailing during session 4 (the last part of the day) to be the most stable indicators of lighting preferences. Several spot illuminance measurements (described above), and two average illuminances were used: mean desktop illuminance (the average of the illuminances on the open desk, the keyboard, between the monitor screen and keyboard, and under the filing bin) and mean vertical illuminance (described above). Summary statistics for these illuminances are given in Table 6. .
To determine which of these measures is the most influential in guiding the participants' choices, we examined the correlations between the various illuminance measurements. The lower left part of Table 7 shows the correlation coefficients between illuminances for the Switching Control installation. The upper right part of the table shows the correlation coefficients between illuminances for the Dimming Control installation. The correlations between the various illuminance measures are high for Dimming Control but very variable for Switching Control. This probably reflects the uniformity of the illuminance change produced. For dimming, the whole of the cubicle was affected by any change, but for switching the part of the cubicle close to the desk lamp was much more influenced by any change than areas well away from the desk lamp. Similarly, Veitch and Newsham found high intercorrelations between different photometric measurements used to characterize office lighting conditions chosen by research participants.9
The average desktop illuminance seems to be the most representative illuminance measure. It is highly correlated with all the others for Dimming Control and reasonably
correlated with the others for Switching Control, except for the illuminance under the filing bin, an area likely to be of little concern to the participants because they spent most of their time on computer-based tasks. Also, the average desktop illuminance can be easily related to the illuminance recommendations made by lighting authorities.
The percentages of participants selecting different average desktop illuminances, in 100 lx bins, for the Switching Control and the Dimming Control conditions are shown in Figure 4. The most noticeable features of Figure 4 are the wide spread of illuminances chosen by different
participants and the very different distributions for the Switching Control and the Dimming Control. This latter difference is a matter of what lighting conditions it was possible to achieve. The Switching Control condition allowed only the addition of light to the ambient illumination provided by the indirect room lighting, whereas the Dimming Control allowed the ambient illumination of the cubicle itself to be reduced. Thus the minimum possible illuminances were much lower for the Dimming Control condition than the Switching Control condition (cf. Tables 3 and 4).
The wide range of illuminance chosen by different people has been found before, in both field studies and laboratory studies.5-10,13,16-21 Figure 5 shows the frequency distribution of the average workstation illuminance chosen by 45 office workers in four different buildings in the UK that were monitored for several months.10 In these multi-occupied offices, occupants could switch individual luminaires either from their workstations or from a wall or column mounted switch. The average workstation illuminance experienced ranged from 91 lx to 770 lx. Figure 5 also shows the frequency distribution of the illuminances experienced in Session 4 of the present study11 where there was a range of illuminances from 252 lx to 1176 lx.
A Canadian laboratory study had two conditions that were somewhat similar to those of the present study and obtained similar variations in chosen illuminance conditions.22 Participants were given the opportunity to control the lighting in the last quarter of the working day. Those who had direct parabolic-louvered luminaires and an angle-arm desk lamp chose desktop illuminances across the range 188 lx to 1478 lx. Those with dimming control over a direct / indirect luminaire suspended over the centre of the workstation chose values over a range 116 lx to 1442 lx. Yet another laboratory study16 has shown large differences in the illuminance chosen by individuals to do the same tasks in a private office. The office was windowless and it was possible to dim the workstation illuminances over ranges of either 1240 lx to 12 lx or 680 lx to 7 lx. The median workstation illuminances chosen by the 18 participants for the same tasks range from 110 lx to 1230 lx for the larger control range, and from 80 lx to 630 lx for the smaller.
Taken together, these laboratory and field results support the view that although there is a stable pattern of when to use lighting, there are large differences between individuals in the illuminances they choose.
3.3 Are different illuminances chosen for different lighting designs?
Figure 4 makes evident that the Switching Control and the Dimming Control installations – two different types of lighting control – provided very different illuminance distributions in the cubicles, allowed different minimum illuminances to be chosen, and led to very different
frequency distributions of chosen illuminances. If the desire for the illuminances chosen using the Dimming Control had been absolute, most participants would have switched off the desk lamp in the Switching Control condition. Few chose to do so. Conversely, if the higher illuminances chosen when using the Switching Control had been absolute, then most people using the Dimming Control would have increased the illuminance much above the initial level. Few did so.
As for different types of electric lighting, when the lighting systems offer broadly similar luminous patterns in the working area, different lighting systems do not result in different mean illuminances being chosen. For example, Yoshida-Hunter19 examined the illuminances chosen in a private office lit by either direct or indirect electric lighting. The maximum illuminances available on the desk and on the monitor screen were very similar for both direct and indirect lighting. This was a laboratory study in which participants did the same tasks for an hour, by day
and after dark. There was no statistically significant difference in mean illuminance settings for the two types of electric lighting.
However, when the lighting systems produce very different luminous patterns, different illuminances may be chosen. For example, Newsham et al22 found that when given the
opportunity to provide extra light on the vertical partition surface of a cubicle using a custom-designed “partition washer”, participants used this luminaire to boost the vertical panel
luminance. The luminous pattern thus created was different from that chosen by the participants who had overhead direct luminaires and an angle-arm desk lamp, or only overhead direct luminaires.
A similar divergence of trends in illuminances chosen for different lighting conditions has been found with daylit offices, suggesting that room characteristics as well as the properties of the lighting installation influence lighting choices. Begemann et al17,18 found a tendency to increase the amount of electric lighting in a deep private office as the illuminance from daylight increased, possibly to increase the brightness of the back of the office well away from the window. Others have found little influence of daylight on the choice of electric lighting
illuminances.10,19 Yet others have found that people are less likely to switch on electric lighting as the illuminance provided by daylight increases,13,15,20 but once the lighting is on, there is little evidence that people tend to switch electric lighting off as the illuminance increases, until they leave the office,13,14,20 unless the lighting system is equipped with an occupancy sensor, in which case switch-off tends to be left to the control system.21
Thus, illuminance choices depend on the lighting equipment, including controls, and on the room characteristics. There is no simple luminance pattern that explains all the evidence. For any set of installations, the greater the difference in luminous patterns available, the greater will be the difference in illuminance choices (expressed as a desktop average) between the
installations.
3.4 Are different illuminances chosen for different types of task?
Given the low frequency of switching and dimming actions in this study and others, it is clear that office workers do not generally choose different illuminances for different tasks. The most likely explanation for this lack of effect of task type is that the range of visual difficulty experienced in everyday work is limited, so although people may do different tasks, the visual sizes and luminance contrasts of those tasks are sufficient to keep the office workers on the plateau and away from the escarpment of visual performance.4,23
The only situation in which some systematic change in illuminances chosen for different tasks has been found was a laboratory study in which the task varied in nature and degree.16 There were two tasks, one paper-based and one screen-based, but both requiring the same decisions. For the paper-based task, visual difficulty was manipulated by changing the stimulus from 14-point print at a luminance contrast of 0.88 to 6 point print at a luminance contrast of 0.68. For the screen-based task, visual difficulty was manipulated by changing the polarity of the display, the dark background display being more visually difficult than the bright background display because the latter masks reflected images more effectively than the former. Table 8 shows the mean illuminances selected to do these tasks under two similar lighting installations providing two different ranges of possible illuminances.16 The mean illuminances chosen were different for the two tasks but showed little difference between the two levels of task difficulty for the same kind of task (6 point versus 14 point; bright background versus dark background). The selected illuminances chosen for the two tasks are consistent with a desire to make the task
details more visible. Higher illuminances make the reflecting paper-based tasks more visible but reduce the visibility of the self-luminous screen-based tasks.
These findings suggest that there is no absolute answer to this question. Whether people will use switching or dimming to adjust the illuminance to make a task more visible will depend on the visual difficulty of the task. Field studies suggest that people in offices rarely adjust the illuminance, presumably setting the illuminance at the beginning of the day to a level that they consider adequate for the tasks they normally have to do throughout the day. The one situation in which office workers have been found to consistently adjust the electric lighting is when they choose to reduce the amount of daylight in the office so as to eliminate glare from the sun or reduce thermal discomfort.5,15
3.5 What is the optimum illuminance for a fixed office lighting installation?
This study and others show consistently that one fixed illuminance cannot satisfy everybody, in the same way that one air temperature will not make everybody thermally comfortable.24 Rather, there may be an optimal illuminance that maximizes the percentage of people who would consider the lighting comfortable.
Newsham and Veitch7 examined this question using data from 47 temporary office workers who worked for a day in a windowless office at a series of screen-based tasks under lighting conditions chosen by another participant in the experiment. The range of desktop illuminance possible was 0 lx to 800 lx. At the end of the working day, the participant who had not been given a lighting choice at the start of the day was given the opportunity to adjust the lighting conditions to what he/she desired. Fitting a linear regression line to the resulting desired change in desktop illuminance plotted against the illuminance experienced during the day revealed that a desktop illuminance of 392 lx produced no desire for change; higher experienced illuminances produced a desire for lower illuminances, and vice versa. From these desired
illuminances, it is possible to calculate the percentage of participants who would be within 100 lx of their desired illuminance at any given fixed illuminance (Figure 6). The result was a peak around 450 lx with only a slight drop between 350 lx and 550 lx, but no more than 45 percent of occupants were within 100 lx of their chosen illuminances no matter what fixed illuminance was chosen. Interestingly, participants who did not have a lighting choice at the start of the day and who experienced a desktop illuminance during the day that was within 100 lx of their preferred illuminances gave higher ratings of mood, lighting quality and overall environmental satisfaction than those who were further from their preferred illuminances.
Figure 6 also shows the percentage of subjects in the present study11 who were within 100 lx of their chosen illuminance for different fixed illuminances. It can be seen that the optimal illuminance is around 350 lx. At this illuminance 63 percent of subjects are within 100 lx of their preferred settings. Taken together, these results suggest that the optimal desktop illuminance for a fixed office lighting installation is about 400 lx. However, even at this illuminance a significant proportion of office workers is likely to be more than 100 lx from their preferred illuminances.
3.6 How do the chosen illuminances relate to recommendations?
The working plane illuminances recommended for offices in the UK are in the range 300 to 500 lx, the lower limit being recommended for mainly computer-based work and the upper limit for mainly paper-based work.2 Similarly, in North America working plane illuminances commonly range from 300 to 500 lx.1 These recommendations agree well with the range over which the largest percentage of people are within 100 lx of their individually desired illuminance
(see Figure 6). How closely these recommendations are followed is open to question, but experience suggests that most office lighting installations are designed to provide a mean illuminance between 400 and 500 lx on the working plane.
Where 500 lx is used as the design standard for an office, then it would appear from Figure 4 that a majority of those using Switching Control chose higher illuminances than the
recommended value, although given the ambient illuminance and the nature of the control they could hardly do otherwise. More interestingly, a majority of participants in this study using the Dimming Control chose illuminances lower then 500 lx. Similar results have been found in field studies where stepped or continuous dimming is available. Moore et al.6 reported that in their study of fourteen offices in the UK, 60 percent of occupants had chosen to work at an
illuminance below 300 lx in winter and 43 percent chose to do so in summer. Only 17 percent chose an illuminance above 500 lx in winter and 30 percent did so in summer. The results of this study11 are in agreement with those of Moore et al6 for the upper limit but not for the lower limit. Specifically, 27 percent of participants in the Dimming Control condition choose to work above 500 lx, but only 7 percent choose to work below 300 lx. This divergence at low illuminances may be a matter of the greater contribution of daylight in one study6 and the higher minimum illuminance in the other.11
3.7 What are the implications of the chosen illuminances for energy consumption?
For offices, where the dominant cost by far is associated with employees (pay, benefits, training etc), the main purpose for lighting energy consumption is to support workers in their tasks and to ensure that they are satisfied with the lighting conditions. These two goals are inextricably linked: Office workers are unlikely to be satisfied with the lighting if they have difficulty in seeing what they have to do or if they experience any visual discomfort, and office workers who are dissatisfied are not likely to be productive or easy to recruit and retain.
Therefore, the implicit objective of much office lighting is to maximize office workers'
satisfaction while minimizing energy consumption. Given this objective, there are two answers to this question, depending on the nature of the lighting.
For a fixed lighting installation in a space with little or no daylight contribution, the results in Figure 6 suggest that the maximum percentage of people who will be within 100 lx of their preferred illuminance, and hence who will be satisfied, occurs at a mean illuminance of about 400 lx. This implies that lighting practice that uses 500 lx as the target for maintained illuminance is excessive. By using 400 lx as a design criterion, a 20 percent decrease in energy consumption could be gained together with a likely increase in the percentage of office workers who are within 100 lx of their preferred illuminance.
For a lighting installation with an individual dimming capability, having the ability to vary the illuminance over a wide range produces an increase in the percentage of office workers who consider the lighting comfortable, from 69—71 percent for installations consisting of regular arrays of either recessed parabolic or prismatic luminaires producing a fixed illuminance to 91 percent for the Dimming Control installation.11,12 For a lighting installation with an
individual dimming capability the maximum energy consumption and the first cost are largely determined by the highest illuminance provided. The wide range of chosen illuminances shown in Figure 4 suggest that a mean illuminance above 1000 lx and the ability to dim down to 10 percent of light output is necessary to ensure that everyone will be able to adjust the illuminance to their desired level. This might be an expensive solution, and our data shows that a
people. Figure 7 shows the percentage of office workers who would be unable to achieve their desired illuminance for a given maximum mean illuminance. It can be seen that in two
studies,7,11 there is little benefit to be gained from having a maximum mean illuminance above 700 lx. Given this maximum mean illuminance, 90 to 99 percent of office workers should be able to achieve their chosen illuminance. Thermal comfort standards aim to satisfy a similar
proportion of the population.25
Whether this would save energy relative to an installation with a fixed illuminance of 400 lx will depend on the lighting equipment, the chosen illuminances, and the degree to which individuals use their controls to switch off during periods of absence. Based on the data presented here it appears likely to be energy-neutral in spaces that lack daylight and that are occupied all of the time, because some people will choose illuminances lower than 400 lx and others higher. Where these conditions do not apply, individual dimming control offers the possibility of energy savings relative to a fixed lighting installation. This is because local control allows individuals to choose whether or not to switch on when they arrive at work or to switch off during short absences. Switching off, or leaving the lighting off, is unlikely when control is not local, but are observed for local control.5,6 In addition, where some of the workstations have daylight for at least some of the time there is a possibility of manual daylight harvesting if those individuals choose lower illuminances in the presence of daylight, as some evidence suggests they will.10
3.8 Do the chosen illuminances have an effect on the task performance?
Statistical tests were carried out for the effect of the illuminances chosen on the performance measures for a series of tasks involving both visual and cognitive performance.11 None of these analyses showed any statistically significant effects of illuminance on performance for either Switching Control or Dimming Control. That is, for people who had some control over their lighting, the specific illuminances chosen did not affect their task performance.
This lack of effect of chosen illuminances is not due to lack of sensitivity in the tasks. Performance on the tasks where visibility had been manipulated by changing the visual size and contrast of the task details showed the expected changes in performance.11 Rather, the lack of an effect of illuminance can be attributed to the fact that none of the illuminances chosen would substantially impair the visibility of the high-contrast, sharply printed paper material, and the fact that the computer tasks were self-luminous and had high contrasts and large size. Further, this lack of effect of chosen illuminance on task performance has been found by others in laboratory studies.16,19,22
Thus, chosen illuminances do not affect the performance of current office tasks. This may be taken as confirmation of the finding that people are not stupid when it comes to choosing lighting conditions. They are unlikely to choose lighting conditions that make it difficult to see what they need to see, and which cause them discomfort, and will take action to modify lighting conditions that do have these effects.7,16,19,26
3.9 Does having illuminance choice affect office workers’ perceptions and moods?
That lighting conditions can affect the perceptions and moods of people working under them is well established27,28,29 and some mechanisms by which such changes in perception and mood might affect productivity and behaviour have been discussed. 30,31 Nonetheless, between-group statistical tests carried out on measures of the perceptions and moods in this study failed to show any statistically significant effects of having control.11,12 This might be a result of lower
statistical power for a between-groups statistical test than for a repeated-measures test, although the experiment overall had a far larger sample size than most comparable experiments. A more likely reason for the lack of effect was the fact that the space and the lighting were designed to be at least minimally satisfactory with or without individual control over the lighting, thereby minimizing the between-groups difference.
As part of the larger experiment, a group of participants experienced both the Dimming Control condition and a fixed illuminance condition, and repeated-measures tests were possible. For these statistical tests, the Dimming Control condition was associated with statistically significantly higher ratings of lighting quality and environmental satisfaction.11,12 A laboratory study conducted independently but using similar tasks and lighting conditions and giving control over lighting to all participants in the last quarter of the day also found evidence that giving control over lighting benefited satisfaction, mood and comfort.22 Moreover, the participants whose preferred lighting conditions were most different from the lighting conditions they had experienced earlier in the day showed the biggest benefits, suggesting that the ability to use control to obtain one’s preferred lighting conditions is the mechanism for the beneficial effect of having control. This finding is consistent with an earlier finding of the benefits to working under lighting conditions similar to one’s personal preference.7
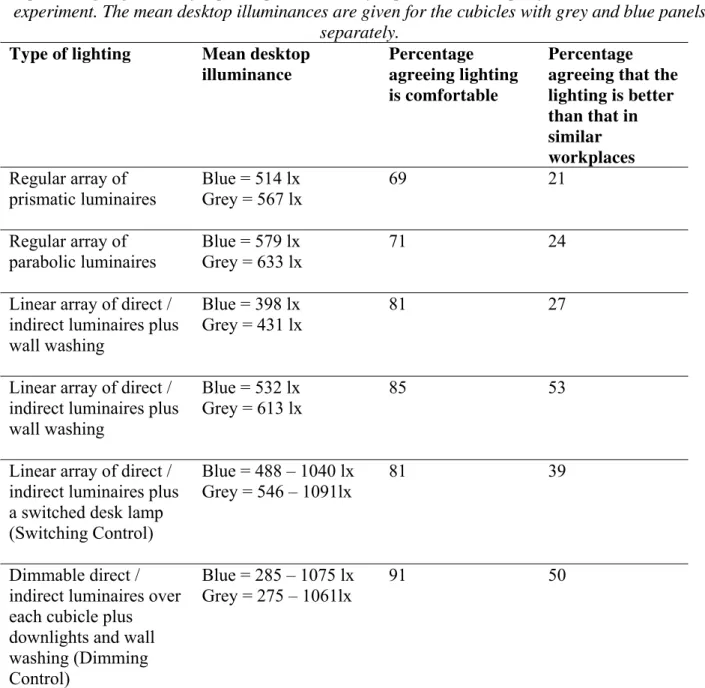
The idea that having lighting control is of benefit because it allows individuals to achieve conditions closer to their personal preferences is consistent with the ratings of the lighting designs for comfort and acceptability12 as shown in Table 9. The highest percentage of office workers considering the lighting comfortable, and hence the highest percentage likely to be satisfied with the lighting, was achieved with the direct / indirect lighting providing a degree of individual control through dimming. This is probably because of the range of illuminances that could be achieved. Simply being able to add light to an illuminance that is already considered adequate by many, which is the case for the Switching Control installation, was assessed less favourably than the fixed illuminance linear direct / indirect installation with wall-washing.11, 12
4. Discussion
A wide range of illuminances preferred by different individuals coexists with a high percentage of office workers considering a fixed illuminance lighting installation comfortable . This suggests that illuminance preferences are weak: People can tolerate deviations from their preferences, within a limited range of their desired illuminances. How large this range might be has yet to be determined, but the low maxima presented in Figure 6 suggest it is greater than 100 lx.
The high tolerance for illuminances different from one’s preference increases the need to justify the additional costs of providing individual dimming control. The obvious justification is the energy saving, but this alone might not be sufficient, depending on energy costs. Providing individual dimming control might be justified as an improvement in working conditions; being able to achieve one’s preferred lighting conditions increases satisfaction with the environment, visual comfort, rated lighting quality, and persistence at a difficult task.7,12,22 Also, a separate analysis of the data from this study concerned with the relationships between the different
measures found that people who rated the lighting quality as higher also gave better ratings to the appearance of the office, were in a more pleasant mood and showed better well-being at the end of the workday.11 Whether these findings are sustained over time in real offices, and whether they have the predicted beneficial effects on organizational efficiency, needs to be determined.
chosen illuminances were much higher than those chosen in the Dimming Control condition (Figure 4), despite the fact that the Dimming Control did allow illuminances in the range of those chosen using the Switching Control to be achieved (Tables 3 and 4). The Switching Control seemed to be used for a different purpose than the Dimming Control.
One major difference between the two conditions is in the luminous patterns they produced in the cubicle. For the Dimming Control condition, the light distribution was uniform and the only effect of using the dimming control was to change the amount of light,
proportionally, everywhere in the cubicle. For the Switching Control, switching on the desk lamp produced a brighter area in one part of the cubicle, an emphasis that was enhanced according to the power setting used. It is possible that the higher illuminances chosen in the Switching Control condition had more to do with enhancing the rather drab appearance of the cubicle, by increasing the luminance variability with a bright area around the lamp, than anything else. If this is the case, the illuminances chosen in the Switching Control condition cannot be used as a guide to preferred illuminances for uniform office lighting. It also suggests that some caution is required before concluding that the type of lighting has no influence on the chosen illuminances. It may be that there is little effect of type of lighting when comparing lighting installations that all produce a uniform illuminance across the working plane, but it would be unwise to conclude that this is the case when comparing lighting installations that produce very different light distributions in the space.
5. Implications for Practice
• For a fixed output lighting installation, the mean maintained illuminance to achieve the maximum percentage of people close to their preferred illuminance is 400 lx.
• For lighting installations providing individual control of illuminances, a maximum
maintained illuminance of 700 lx is recommended, with dimming down to at least twenty-five percent of the maximum. This minimum is a matter of judgement; 25% of 700 lx is 175 lx, and few people appear to have preferences for lower illuminances.
• The financial justification for providing individual dimming control of lighting is based on both the benefits associated with allowing people to achieve the illuminance they desire, with consequent improvements in environmental satisfaction, and on energy savings. The energy savings from individual control include the possibility of switching off when not in use, and manual daylight harvesting. Whether the environmental satisfaction benefits are sustained in real offices over time, and whether they lead to greater organisational efficiency, remains to be determined.
• Individual dimming control is unlikely to be used frequently unless there is a wide variation in the visual difficulty of the tasks done. Individual dimming control is most likely to be used by the individual to set the illuminance of the work area to the level they consider suitable for the work they usually do, after which it will be left unchanged.
• The above implications apply to lighting systems that provide a uniform pattern of illuminance across the working area. Where non-uniform luminous patterns are present different illuminances may be preferred, depending on the nature of the luminous pattern.
6. References
1. Illuminating Engineering Society of North America The IESNA Lighting Handbook, New York: IESNA, 2000.
3. British Standards Institution BSEN 12464-1 Light and Lighting. Lighting of Indoor Work
Place, London: British Standards Institution, 2002.
4. Boyce, PR. Human factors in lighting (2nd ed.). London: Taylor and Francis, 2003. 5. Maniccia D, Rutledge B, Rea MS, Morrow W. Occupant use of manual lighting controls
in private offices. Journal of the Illuminating Engineering Society 1999: 28: 42-56. 6. Moore T, Carter DJ, Slater AI. A field study of occupant controlled lighting in offices.
Lighting Research and Technology, 2002; 34: 191-206.
7. Newsham GR, Veitch JA. Lighting quality recommendations for VDT offices: A new method of derivation. Lighting Research and Technology, 2001; 33: 97-116.
8. Veitch JA, Newsham GR. Exercised control, lighting choices, and energy use: An office simulation experiment. Journal of Environmental Psychology, 2000; 20: 219-237.
9. Veitch JA, Newsham GR. Preferred luminous conditions in open-plan offices: Research and practice recommendations. Lighting Research and Technology, 2000; 32: 199-212. 10. Moore, T, Carter, DJ, Slater AI. Long-term patterns of use of occupant controlled office
lighting, Lighting Research and Technology, 2003; 35: 43-59.
11. Boyce PR, Veitch JA, Newsham GR, Myer M, Hunter C. Lighting quality and office
work: A field simulation study, A report for the Light Right Consortium, September 2003. (Available at www.lrc.rpi.edu and http://irc.nrc-cnrc.gc.ca/fulltext/b3214.1/)
12. Boyce PR, Veitch JA, Newsham GR, Myer M, Hunter C. Lighting quality and office work: Two field simulation experiments, Lighting Research and Technology, 2006;in press. 13. Hunt DRG. The use of artificial lighting in relation to daylight levels and occupancy,
Building and Environment, 1979; 14: 21-33.
14. Boyce PR. Observations of the manual switching of lighting, Lighting Research and
Technology, 1980; 12: 195-205.
15. Reinhart CF, Voss K. Monitoring manual control of electric lighting and blinds, Lighting
Research and Technology, 2003; 35: 243-260.
16. Boyce PR, Eklund NH, Simpson SN. Individual lighting control: Task performance, mood, and illuminance. Journal of the Illuminating Engineering Society, 2000; 29: 131-142. 17. Begemann SHA, Tenner A, Aarts M. Daylight, artificial light and people, Proceedings,
IES Lighting Convention, Sydney, Australia: Illuminating Engineering Societies of Australia, 1994.
18. Begemann SHA, van den Beld GJ, Tenner AD. Daylight, artificial light and people, Part
2, Proceedings of the CIE 23rd Session, New Delhi, India, Vienna: CIE, 1995.
19. Yoshida-Hunter M. The influence of type of lighting and visual task on dimming, MSc Thesis, Troy, NY: Rensselaer Polytechnic Institute, 2003.
20. Love JA. Manual switching patterns observed in private offices, Lighting Research and
Technology 1998; 30: 45-50.
21. Pigg S, Eilers M, Reed J. Behavioural aspects of lighting and occupancy sensors in private offices: A case study of a university office building, Proceedings of the 1996 ACEEE
summer study on energy efficiency in buildings, 8: 8.161=8.171, 1996.
22. Newsham GR, Veitch, JA, Arsenault, C, Duval CL. Effect of dimming control on office worker satisfaction and performance, Proceedings of the IESNA 2004 Annual Conference,
Tampa FL, New York: IESNA, 2004
23. Boyce PR, Rea MS. Plateau and escarpment: The shape of visual performance,
Proceedings of the CIE 21st Session, Venice, Vienna, CIE, 1987. 24. McIntyre DA. Indoor climate, London: Applied Science, 1980.
25. American Society of Heating, Refrigerating and Air-conditioning Engineers, ASHRAE
Standard 55-2004 Thermal Environmental Conditions for Human Occupancy, Atlanta, GA: ASHRAE, 2004.
26. Rea MS, Ouellette MJ, Kennedy ME, Lighting and task parameters affecting posture, performance and subjective ratings, Journal of the Illuminating Engineering Society, 1985; 15: 231-238.
27. McCloughan CL. Aspinall PA, Webb RS. The impact of lighting on mood. Lighting
Research and Technology, 1999; 31: 81-88.
28. Loe DL, Mansfield KP, Rowlands E. Appearance of lit environment and its relevance in lighting design: Experimental study. Lighting Research and Technology, 1994; 26: 119-133. 29. Shepherd AJ, Julian WG, Purcell AT. Measuring appearance: parameters indicated from
gloom studies, Lighting Research and Technology, 1992; 24: 203-214.
30. Veitch JA. Psychological processes influencing lighting quality, Journal of the
Illuminating Engineering Society, 2001; 30, 124-140.
31. Isen AM, Baron RA. Positive affect as a factor in organizational behavior. In Staw BM, Cummings LL editors, Research in Organizational Behavior, Greenwich, CT: JAI Press, 1991: 1-53.
7. Acknowledgements
This investigation was supported by the Light Right Consortium, managed by Pacific Northwest National Laboratory under RFP # 404141, through contracts to Rensselaer
Polytechnic Institute’s Lighting Research Center (RPI # A11106) and the National Research Council of Canada’s Institute for Research in Construction (NRC # B3214). This phase of the Light Right Consortium was supported by the Alliance to Save Energy, the Illuminating
Engineering Society of North America, the International Association of Lighting Designers, the International Facility Management Association, Johnson Controls, the National Electrical Manufacturers Association, the New York State Energy Research and Development Authority, Steelcase, Inc., the US Department of Energy, and the US Environmental Protection Agency. The Light Right Consortium and the researchers gratefully acknowledge the contributions of lighting equipment provided by (in alphabetical order) Birchwood Lighting, Cooper Lighting, Day-Brite Lighting, Engineered Lighting Products, General Electric Lighting, Ledalite
Architectural Products, Lightolier, Lutron, Osram Sylvania, Peerless Lighting, and Philips Lighting. Furnishings were provided by Armstrong World Industries Inc. and Steelcase, Inc. The authors would like to thank Leslie Nicholls at PNNL for her contributions to the project. Other staff at the National Research Council of Canada - Institute for Research in Construction who contributed to this project were Chantal Arsenault and Roger Marchand. The researchers are grateful to staff from NRC's Institute for Information Technology who assisted with the
development of cognitive performance tasks: Berry De Bruijn, Alain Désilets, Joel Martin, and Peter Turney. At the Lighting Research Center, thanks are due to Martin Overington and Owen Howlett for their contributions to the project.
Table 1. Description, location and reflectance of the surfaces of the cubicles and working area.
Surfaces Description Reflectance
Ceiling Fibre tiles 2.90 m above floor Tiles = 0.88 Walls White painted plasterboard or brickwork Walls = 0.73
Floor Grey carpet Carpet = 0.20
Cubicle Square in plan of side 2.28 m, Side panels either 1.67 m or 1.37 m high. 5 cubicles had grey side panels. 4 cubicles had dark blue side panels
Grey panels = 0.30 Blue panels = 0.05
Work surface L-shaped grey work surface attached to two panels of the cubicle, 0.75 m above floor
Work surface = 0.52
Filing bin Rectangular, grey, 0.48 m above work surface
Door = 0.52 Chairs Wheeled and adjustable in seat height,
back position, and arm height. Blue fabric seat and back, black plastic frame
Seat and back = 0.11 Plastic frame = 0.04
Table 2. Characteristics of lighting installations.
Switching Control Dimming Control
Cubicle Area Luminaire
continuous suspended direct / indirect, 400 mm below
ceiling
individual1200 mm, 3 lamp suspended direct / indirect, 1 lamp indirect, 2 lamps direct
Layout 5 rows
co-ordinated to furnishings & architecture centred on workstation Lamp 1200 mm, 54W, T5 HO, CCT =3,500K, CRI = 85 1200 mm, 54W, T5 HO, CCT =3,500K, CRI = 85 Ballast electronic dimming electronic dimming Switchable Desk Lamp translucent shade, 40W 2D CFL (CCT = 3,500K and CRI = 82) switchable to 0W, 13W, 26W and 37W levels - Individual Control
- Direct only: 0 - 100 % through computer interface Perimeter
Wall-washing
track-mounted linear luminaires, one 50W 600 mm twin tube CFL
(CCT = 3,500K, CRI = 82)
track-mounted linear luminaires, one 50W 600 mm twin tube CFL
Table 3. Mean illuminances (lx) for four switching levels in the Switching Control installation, for all cubicles, for the two panel reflectances separately..
Desk lamp wattage (W) and panel Mean desktop illuminance (lx) Mean illuminance on open desk (lx) Mean illuminance on screen (lx) Mean illuminance on keyboard (lx) Mean illuminance on face of occupant (lx) Off Grey Blue 546 488 536 431 371 344 521 519 295 264 11 W Grey Blue 647 590 867 740 387 408 612 597 323 301 26 W Grey Blue 812 744 1420 1215 403 383 681 657 353 302 35W Grey Blue 1091 1040 2356 2248 447 438 764 740 422 335
Table 4. Mean illuminances (lx) at three dimming levels of the Dimming Control installation, for all cubicles, for the two panel reflectances separately.
Dimmer setting and panel Mean desktop illuminance (lx) Mean illuminance on open desk (lx) Mean illuminance on screen (lx) Mean illuminance on keyboard (lx) Mean illuminance on the face of the occupant (lx) 0% Grey Blue 275 285 279 300 166 181 270 283 171 181 50% Grey Blue 355 374 358 378 244 263 368 377 215 218 100% Grey Blue 1061 1075 945 964 853 874 1151 1156 588 579
Table 5. Frequency of switching or dimming during the day. Frequency 0 1 2 3 4 5 6 7 Total Switching N 11 12 3 2 2 1 1 1 33 % 33 36 9 6 6 3 3 3 Dimming N 6 36 6 3 4 2 57 % 11 63 11 5 7 4
Table 6. Summary statistics of illuminances chosen in the occupied cubicles (lx) (M = Mean, SD = Standard deviation)
Open Desk Keyboard Keyboard - Screen Screen Face of Occupant Switching Min 351 422 453 246 234 Max 2497 812 736 545 459 Median 1679 684 614 416 338 M 1701 691 616 408 349 SD 611 85 70 80 51 Dimming Min 243 248 242 146 144 Max 1075 1279 1341 853 604 Median 384 390 394 258 251 M 435 485 489 327 278 SD 171 230 235 175 99 Document Holder – L Document Holder – R Under Filing Bin Mean Desktop Mean Vertical Switching Min 345 366 371 399 356 Max 636 582 649 1131 585 Median 513 506 533 869 510 M 510 513 529 884 512 SD 66 48 74 187 54 Dimming Min 185 179 257 252 191 Max 1129 1115 1010 1176 10900 Median 326 310 354 375 3110 M 416 392 424 458 404 SD 218 205 176 201 210
Table 7. Intercorrelations among measured illuminances. Above diagonal: Dimming Control. Below diagonal: Switching Control.
Open Desk Key- board Key- board- Screen
Screen Face Doc Holder – L Doc Holder – R Under Bin Average Vertical Ave Desktop Open Desk 0.98 0.97 0.95 0.89 0.94 0.97 0.95 0.96 0.98 Keyboard 0.70 1.0 0.99 0.90 0.99 0.99 0.98 0.99 1.0 Keyboard- Screen 0.77 0.88 0.98 0.89 0.99 0.99 0.98 0.99 1.0 Screen 0.44 0.82 0.72 0.87 0.99 0.97 0.96 0.99 0.98 Face 0.51 0.74 0.75 0.56 0.88 0.85 0.88 0.87 0.90 Document Holder-L 0.47 0.88 0.75 0.72 0.60 0.97 0.97 0.99 0.98 Document Holder-R 0.68 0.89 0.88 0.86 0.68 0.77 0.97 0.99 0.99 Under Filing Bin 0.09 0.64 0.35 0.69 0.60 0.59 0.54 0.98 0.99 Average Vertical 0.59 0.94 0.85 0.83 0.67 0.96 0.92 0.61 0.99 Average Desktop 0.98 0.83 0.86 0.59 0.63 0.61 0.79 0.28 0.73
Table 8. Mean workplane illuminances (and associated standard deviations) chosen for four task types in a windowless private office.16 The office was lit by recessed parabolic luminaires that
could be dimmed to one percent of light output.
Task Windowless private office
(maximum illuminance 680 lx)
Windowless private office (maximum illuminance 1240 lx)
14 point paper task 440 (210) 630 (420) 6 point paper task 450 (200) 660 (420) Bright background screen
task
350 (230) 380 (380)
Table 9. Percentage of occupants who agree that the lighting is comfortable and who agree that the lighting is better than in similar workplaces, for five different types of office lighting.12 The
percentages given are for participants who only experienced that specific installation in the experiment. The mean desktop illuminances are given for the cubicles with grey and blue panels
separately.
Type of lighting Mean desktop
illuminance
Percentage agreeing lighting is comfortable
Percentage agreeing that the lighting is better than that in similar workplaces Regular array of prismatic luminaires Blue = 514 lx Grey = 567 lx 69 21 Regular array of parabolic luminaires Blue = 579 lx Grey = 633 lx 71 24
Linear array of direct / indirect luminaires plus wall washing
Blue = 398 lx Grey = 431 lx
81 27
Linear array of direct / indirect luminaires plus wall washing
Blue = 532 lx Grey = 613 lx
85 53
Linear array of direct / indirect luminaires plus a switched desk lamp (Switching Control)
Blue = 488 – 1040 lx Grey = 546 – 1091lx
81 39
Dimmable direct / indirect luminaires over each cubicle plus downlights and wall washing (Dimming Control)
Blue = 285 – 1075 lx Grey = 275 – 1061lx
List of Figures
Figure 1. General view of cubicles with a single dimming direct / indirect luminaire centred over each cubicle and wall washing around the edge of the space.
Figure 2. Typical cubicle configuration with single dimmable direct / indirect luminaire centred above and wall washing luminaires in the background.
Figure 3. The switchable desk lamp used with rows of continuous suspended direct / indirect luminaires providing the ambient lighting.
Figure 4. Percentage of participants choosing a mean desktop illuminance in 100 lx bins for the Switching Control and the Dimming Control conditions. For the Switching Control condition N = 33. For the Dimming Control condition, N = 56.
Figure 5. Percentage of office workers choosing to work at different illuminances, in a long-term field study,10 and a short-term laboratory study.11
Figure 6. Percentage of participants within 100 lx of their selected illuminance for two studies.7,
11
Figure 7. Percentage of participants who are unable to achieve their selected illuminance by dimming plotted against the maximum illuminance provided by the installation. The data are taken from two independent studies conducted in North America.7,11
Figure 1. General view of cubicles with a single dimming direct / indirect luminaire centred over each cubicle and wall washing around the edge of the space.
Figure 2. Typical cubicle configuration with single dimmable direct / indirect luminaire centred above and wall washing luminaires in the background.
Figure 3. The switchable desk lamp used with rows of continuous suspended direct / indirect luminaires providing the ambient lighting.
Figure 4. Percentage of participants choosing a mean desktop illuminance in 100 lx bins for the Switching Control and the Dimming Control conditions. For the Switching Control
Figure 5. Percentage of office workers choosing to work at different illuminances, in a long-term field study,10 and a short-term laboratory study.11
Figure 6. Percentage of participants within 100 lx of their selected illuminance for two studies.7, 11
Figure 7. Percentage of participants who are unable to achieve their selected illuminance by dimming plotted against the maximum illuminance provided by the installation.