HAL Id: hal-02413409
https://hal.archives-ouvertes.fr/hal-02413409
Submitted on 25 Nov 2020HAL is a multi-disciplinary open access archive for the deposit and dissemination of sci-entific research documents, whether they are pub-lished or not. The documents may come from teaching and research institutions in France or abroad, or from public or private research centers.
L’archive ouverte pluridisciplinaire HAL, est destinée au dépôt et à la diffusion de documents scientifiques de niveau recherche, publiés ou non, émanant des établissements d’enseignement et de recherche français ou étrangers, des laboratoires publics ou privés.
Fluorescent and magnetic stellate mesoporous silica for
bimodal imaging and magnetic hyperthermia
Francis Perton, Mariana Tasso, Guillermo Muñoz Medina, Mathilde Ménard,
Cristina Blanco-Andujar, Enrique Portiansky, Marcela B. Fernandez van
Raap, Dominique Begin, Florent Meyer, Sylvie Bégin-Colin, et al.
To cite this version:
Francis Perton, Mariana Tasso, Guillermo Muñoz Medina, Mathilde Ménard, Cristina Blanco-Andujar, et al.. Fluorescent and magnetic stellate mesoporous silica for bimodal imaging and magnetic hyper-thermia. Applied Materials Today, Elsevier, 2019, 16, pp.301-314. �10.1016/j.apmt.2019.06.006�. �hal-02413409�
Fluorescent and Magnetic Stellate Mesoporous Silica for
Bimodal Imaging and Magnetic Hyperthermia
Francis Perton1,§, Mariana Tasso2,§*, Guillermo A. Muñoz Medina3, Mathilde Ménard1,4, Cristina
Blanco-Andujar1, Enrique Portiansky5, Marcela B. Fernández van Raap3, Dominique Bégin6, Florent
Meyer4, Sylvie Begin-Colin1*, Damien Mertz1*
1Institut de Physique et Chimie des Matériaux de Strasbourg (IPCMS), UMR-7504
CNRS-Université de Strasbourg, 23 rue du Loess, BP 34 67034, Strasbourg Cedex 2, France.
2Instituto de Investigaciones Fisicoquímicas Teóricas y Aplicadas (INIFTA), Departamento de
Química, Facultad de Ciencias Exactas, Universidad Nacional de La Plata - CONICET, Diagonal 113 y 64, 1900 La Plata, Argentina.
3Instituto de Física de La Plata, CONICET-UNLP, Diagonal 113 y calle 63, La Plata, Argentina. 4Institut National de la Santé et de la Recherche Médicale, UMR 1121 FMTS, 11 rue Humann,
67085 Strasbourg, France.
5Institute of Pathology, School of Veterinary Sciences, University of La Plata, calle 60 y 118, 1900
La Plata, Argentina.
6Institut de Chimie et Procédés pour l'Energie, l'Environnement et la Santé (ICPEES), UMR-7515
CNRS-Université de Strasbourg, 25 rue Becquerel, 67087 Strasbourg, Cedex 2, France.
§ authors contributed equally
E-mails: [email protected], [email protected], [email protected]
KEYWORDS : fluorescent and magnetic silica; large pore mesoporous silica and albumin coatings; magnetic hyperthermia; bimodal imaging probes; specific and non-specific cell/nanoparticle interactions
ABSTRACT. There is currently a crucial need of innovative multifunctional nanoparticles combining, in one formulation, imaging and therapy capacities allowing thus an accurate diagnosis and a therapy monitored by imaging. Multimodal imaging will ensure to speed up diagnosis, to increase its sensitivity, reliability and specificity for a better management of the disease. Combined with a therapeutic action, it will enable also to treat the disease in a specific personalized manner in feedback mode. The mastered design of such bioprobes as well as the demonstration of their efficiency are still challenges to face in nanomedicine. In this work, novel fluorescent and magnetic core-shell nanocomposites have been designed to ensure in one nanoformulation, bimodal fluorescence and MRI imaging coupled with therapy by magnetic hyperthermia. They consist in the coating of a magnetic iron oxide (IO) core (ca. 20 nm diameter to ensure magnetic hyperthermia) by an original large pore stellate mesoporous silica (STMS) shell to produce uniform and mono-core magnetic core-shell nanocomposites denoted IO@STMS NPs. To confer fluorescence properties, CdSe/ZnS quantum dots (QDs) NPs were grafted inside the large pores of the IO@STMS nanocomposites. To provide biocompatibility and opsonization-resistance, a tightly-bound human serum albumin (HSA) coating is added around the nanocomposite using an original IBAM based strategy. Cellular toxicity and non-specific cell-nanomaterial interactions allowed to determine a concentration range for safe application of these NPs. Cellular endosomes containing spontaneously-uptaken NPs displayed strong and photostable QD fluorescent signals while magnetic relaxivity measurements confirm their suitability as contrast agent for MRI. HeLa cell-uptaken NPs exposed to a magnetic field of 100
kHz and 357 Gauss (or 28.5 kA.m-1) display an outstanding 65% cell death at a very low iron
concentration (1.25 μg Fe.mL-1), challenging current magnetic hyperthermia nanosystems.
Furthermore, at the particularly demanding conditions of clinical use with quite low field/frequency (100 kHz, 117 Gauss or 9.3 kA.m-1), magnetic hyperthermia combined with the
delivery of chemotherapeutic drug, doxorubicin, allowed 46% cell death, which neither the drug nor the NPs alone yielded, evidencing thus the synergistic effect of this combined treatment.
INTRODUCTION
In nanomedicine, the move towards accurate personalized diagnosis [1] and therapies[2,3] alternative to the injection of chemotherapeutic agents leading to harmful side effects, requires now the development of highly efficient theranostic tools. Such challenging nanoplatforms will help to diagnose and monitor the evolution of the pathology, to evaluate the structural and physiological changes in tissues and cells, to treat the diseases and to follow the effect of treatments by imaging. Furthermore, multimodal imaging with two or more imaging modalities would allow integration of their individual strengths while overcoming their limitations. Multimodality imaging ensures better understanding of physiological status and therapeutic response of tumor tissue at molecular and cellular levels. For example, optical imaging is a very promising imaging technique that uses near-infrared light to assess optical properties of tissues. Major advantages of optical imaging are rapid frame rates, very high sensitivity, relatively inexpensive, easily accessible, and it does not use any radioactive components. Furthermore, optical imaging has the potential to be combined in a multimodal approach with other technologies such as mammography, ultrasound, MRI, and positron emission tomography. Indeed, anatomical imaging technologies such as MRI provide complementary unparalleled
structural detail, excellent soft-tissue contrast and multidimensional functional, structural and morphological information.
To face these challenges, engineering approaches are needed to develop such multimodal imaging agents combining therapeutic functions while ensuring nanoparticle stability in biological media, resistance to opsonization, low non-specific interactions with cells, minimal effects onto cell viability, performances suitable for clinical uses... .
In that stimulating context, nanoplatforms based on magnetic iron oxide core-mesoporous silica shell nanocomposites have witnessed a tremendous interest this last decade.[4–8] Such nanomaterials can be defined as one or several magnetic core NPs embedded in a porous silica inorganic matrix. The extension of this concept to the combination of two inorganic components with different properties enables new and complementary properties for biomedical applications. Indeed, while the magnetic core brings the remote magnetic features ensuring magnetic resonance imaging (MRI) properties and/or magnetic hyperthermia (MH) and magnetic manipulation, the porous silica shell brings high colloidal stability in aqueous solution, a high degree of surface functionalization and the ability for drug loading but also for encapsulating other inorganic NPs. Indeed incorporating NPs such as quantum dots to add fluorescence imaging is promising for multimodal imaging. Such hierarchically designed nanoparticles are thus promising as theranostic nanoplatforms but it is necessary to master the design of each components and hierarchical steps and their scaling-up production.
There are various methods to synthesize magnetic core NPs with various sizes or shapes, which are mainly: co-precipitation[9], thermal decomposition[10,11] or hydrothermal /solvothermal synthesis.[12] Besides, among the various coatings of iron oxide (IO) NPs including dendrons,[10,13] siloxane[14,15] or non-porous silica,[16,17], the coating with mesoporous silica (MS) shells emerged impressively this last decade as a relevant approach to design
powerful nanoplatforms for theranostic applications.[18–20] In addition, the recent possibility to increase and modulate the MS pore raises again a strong interest for such core-shell NPs.[21] Such development paved the way towards the loading of these large pores with large biological molecules, such as nucleic acids or proteins, but also inorganic NPs. A first approach to increase the pore size of MS shells covering ca. 10 nm diameter IO NPs was developed by Zhang et al.[22]. They showed that by using triisopropylbenzene/decane as pore swelling agents instead of cetyltrimethylammonium bromide (CTAB), the MS shell pore size could be increased from 2.5 nm (CTAB) up to ca. 6 nm. Aside this work, the design of MS shells around magnetic (or plasmonic) cores with a pore size above 10 nm still remains scarcely explored and requires new strategies. Recently, Zhang et al.[23] introduced a facile and large scale method to synthesize large pore stellate MS (STMS) NPs (without a magnetic core) with a diameter of ~100 nm and a pore size of ~ 15 nm). This method used cetyltrimethylammoniumtosylate (CTATos) as the porogen surfactant instead of CTAB. This facile sol-gel process led to STMS NPs with a high yield and a good reproducibility. A translation of this method was recently applied to small IO cores made by co-precipitation.[24,25] However, because of the co-precipitation method, the IO NPs had a size distribution not well controlled and the resulting composites displayed a lack of uniformity from one core-shell to another. Also, to the best of our knowledge, the coating of iron oxide NPs synthesized by the thermal decomposition method by a stellate large pore MS shell was not carried out to date.
The incorporation of fluorescent probes, mainly of organic nature, in magnetic silica nanocomposites was reported in various works these last decennia for complementary bimodal MRI and fluorescence bioimaging. The combination of these two imaging modes is particularly attractive as the fluorescence properties bring a high sensitivity of detection (associated however to a weak penetration depth (≤ several mm)) while MRI brings a good spatial resolution without
concerns regarding the magnetic wave penetration. Among the possible fluorophores that can be used for this purpose, quantum dots (QDs) semiconductor nanocrystals are good candidates thanks to their remarkably narrow and controllable range of emission,[26] as well their brightness and high resistance to photobleaching. These properties altogether make them a good alternative to molecular organic dyes.[27] Recent works reported on the design of fluorescent and magnetic composites by co-encapsulation methods including reverse emulsion routes.[28,29] Such methods have however some limitations: a lack of control over QDs' content and of QDs’ localization in the nanocomposite and a sol-gel approach limiting the scaling up of the process. Hence, the covalent grafting of QDs within large pore MS NPs would be a relevant way to control the composition of the resulting nanocomposite. Moreover, such a strategy is promising for a scale-up process. To the best of our knowledge, the covalent grafting of small QDs NPs in large pore silica shells around IO NPs for multimodal applications has not been reported yet.
Herein, the strategy of stellate silica NPs is translated for the first time to cover hydrophobic IO NPs made by thermal decomposition to form a novel class of magnetic silica composites having large pore sizes (Figure 1). To confer fluorescence properties, small carboxylated CdSe/ZnS QDs NPs are grafted (ca. 6 nm in diameter and 630 nm max. fluorescence emission) within the large pores of the magnetic composites through the efficient carbo-diimidation reaction. Then, with the aim of obtaining a biocompatible and opsonization-resistant outer layer, the surface of the magnetic composites with grafted QDs (IO@STMS@QDs) is modified with isobutyramide (IBAM) groups that enable the formation of a tightly-bound layer of human serum albumin (HSA). Indeed, we showed that IBAM groups grafted at the surface of MS NPs behave as suitable non-covalent protein cross-linkers ensuring a tight protein coating and the formation of self-supported capsules after silica dissolution.[30–33] This work describes thus the hierarchical synthesis and thorough characterization of innovative hybrid fluorescent-magnetic
nanocomposite core-shell NPs, denoted IO@STMS@QDs@IBAM-HSA. Then a serie of proof-of-concept experiments is carried out to demonstrate the dual bioimaging and therapeutic potential of these nanocomposites. The evaluation of their longitudinal and transversal relaxivities confirmed their suitability as contrast agent for MRI. SAR measurements performed at various frequencies and magnetic field amplitudes highlightedtheir potential for magnetic hyperthermia applications. Cellular studies have allowed establishing working concentrations without cytotoxic effects. The spontaneous internalization of the NPs by HeLa cells is demonstrated as well as the preservation of the NPs’ fluorescence inside cellular endosomes. Furthermore, magnetic hyperthermia experiments on HeLa cells with internalized NPs were conducted under magnetic field conditions of either clinical relevance (117 Gauss or 9.3 kA.m-1; 100 kHz) or not
(357 Gauss or 28.5 kA.m-1; 100 kHz). Indeed the hyperthermia potential of magnetic NPs is rarely
demonstrated under conditions of clinical use : the product of the amplitude and the frequency (H · f) of the applied magnetic field has to be lower than 5 × 10⁹ Am−1 s−1) ,. Finally, the
combination of the injection of an anti-cancer drug (doxorubicin) with a magnetic hyperthermia treatmentin conditions of clinical relevance evidenced a synergistic action of both treatments. These results demonstrated that such designed nanoplatforms represent innovative and valuable tools for combining multimodal diagnosis by MRI and fluorescent imaging and therapy based on magnetic hyperthermiain clinical conditions.
Figure 1. Scheme showing the different steps of the synthesis process of fluorescent and
MATERIALS AND METHODS
Chemicals. Iron stearate (9.47% Fe), oleic acid (99%), dibenzylether and squalane (97%) were
respectively obtained from Strem Chemicals, Alfa-Aesar and Fluka. Tetraethyl orthosilicate (TEOS), 2-amino-2-(hydroxymethyl)-1,3-propanediol (AHMPD), 3-aminopropyltriethoxysilane (APTS), 1-ethyl-3-(3-dimethylaminopropyl)carbodiimide (EDC), N-hydroxysuccinimide ester (NHS), isobutyrylchloride (IBC), ethanol (EtOH), N,N-dimethylformamide (DMF), dimethylsulfoxide (DMSO), triethylamine (Et3N), isopropanol, Triton X-100, hydrochloric acid (37%) solution, sodium bicarbonate, phosphate buffer saline, 16 vol% formaldehyde solution, fluorescein isothiocyanate (FITC), sodium hydrogen carbonate (NaHCO3), human serum albumin
(HSA) and Dulbecco's Modified Eagle Medium (DMEM) high glucose in powder with and without phenol red were obtained from Sigma Aldrich (France). Carboxylated quantum dots (QDs; emission 630 nm) were also obtained from Sigma Aldrich and cetyltrimethylammoniumtosylate (CTATos) from Roth (France). The MTT reagent (3-(4,5-Dimethylthiazol-2-yl)-2,5-Diphenyltetrazolium Bromide), the BCA protein assay kit, the Lab-Tek 8 well chambers and the cell culture dishes were purchased at Thermo Scientific. Doxorubicin hydrochloride (Dox, purity 99%) was purchased from OChem Inc. (Des Plaines, IL), vectashield mounting medium with DAPI from Vector Laboratories and cell culture products (except for DMEM powder) from Thermo Scientific.
Fluorescent labeling of HSA. Fluorescein isothiocyanate (531 µL, 10 mg.mL-1) in DMSO was
mixed to HSA (30 mL, 10 mg.mL-1) in sodium bicarbonate (0.1 M) (NaHCO3) buffer (pH 8.5). The
mixture was stirred overnight and then dialyzed (membrane pore size: 10 kDa) in MilliQ water to remove free FITC. The final volume was adjusted to 60 mL to reach an HSAFITC concentration of 5
Synthesis of spherical IO NPs by a thermal decomposition method. Uniform 18 nm size iron
oxide nanoparticles (IO NPs) were synthesized by adapting reported methods.[11,34] Briefly, iron stearate (1.85 g, 2.0 mmol) was thermally decomposed in a mixture of dibenzylether (0.53 g) and squalane (20 mL) in the presence of oleic acid (1.90 g, 6.7 mmol). First, the mixture was heated to 130 °C under stirring for 1h to dissolve the reactants and remove water residues. Then, by applying a heating rate of 5 °C min-1, the solution reached the boiling temperature (ca. 340 °C)
and was thereafter kept under reflux for 1h. After washing the final product by centrifugation (14,000 rpm, 5 min) with a mixture of chloroform/acetone (1/4), the IO NPs stabilized with oleic acid were dispersed in chloroform at a concentration of 4 mg Fe mL-1 measured by relaxometry.
Synthesis of IO@STMS nanoparticles. The protocol was adapted and modified from Zhang et
al.[23] In a typical procedure, CTATos (480 mg) was dissolved in water (50 mL) at 80°C for 1h.
Then, 2-amino-2-hydroxymethyl-1,3-propanediol (AHMPD, 55 mg) was added and dissolved at 80°C and the solution was stirred during 15 min. This solution was brought to 65°C for 1h and then the previous IO NPs (5 mL, 4 mg Fe.mL-1) dispersed in chloroform were added drop by drop
under vigorous stirring for 20 min. The solution obtained after chloroform evaporation became dark. The sol-gel reaction starts after addition of TEOS (4 mL) while the temperature is increased from 65 to 80 °C. The mixture is then stirred for 2h. The NPs were then collected by centrifugation (10,000 g, 10 min) and dispersed in water: EtOH (1:1). CTATos extraction from the silica pores was done by mixing the NPs with NH4NO3 (20 mL, 20 mg.mL-1 in EtOH) followed by
stirring and heating at 60 °C during 1h. The CTATos extraction was done several times and followed by Zeta Potential analysis. Finally, the nanoparticles were dispersed in EtOH or water (10 mL), were denoted IO@STMS NPs and were stored at room temperature until further use.
Silanisation of IO@STMS NPs. In a typical procedure, the previous IO@STMS NPs dispersed in
EtOH (8 mg.mL-1; 30 mL) were mixed to NH3 (1.4 mL, 25% aqueous solution), aminopropyl
triethoxysilane (APTS, 5 mL) and stirred for 2h. The amino-modified IO@STMS NPs were washed by centrifugation (10,000 g, 10 min) twice with EtOH and twice with water before QDs' grafting or twice with DMF before reaction to form IBAM groups. When QDs were grafted, the IO@STMS NPs were dispersed in water at a concentration of ca. 10 mg.mL-1. For NPs without QDs,
re-suspension was in DMF at a concentration of ca. 11 mg.mL-1.
Grafting of QDs on large pores of IO@STMS NPs. QDs were grafted onto the large pores of
IO@STMS@APTS NPs at ca. 2 wt.%. In a typical procedure, carboxylated QDs (1 mL, 1 mg.mL-1)
were added to a tube containing the previous IO@STMS@APTS nanoparticles (ca. 50 mg) dispersed in water (5 mL, pH ~7). The mixture was let under stirring for 24h to ensure the optimum diffusion of the QDs to the ammonium groups of IO@STMS@APTS. Then, EDC (2.85 mg, 100 equivalents) and NHS (4.85 mg, 250 equivalents) were added to the previous mixture together with a PBS buffer (500 µL). After 4h of stirring, the mixture was centrifuged (8,000 g; 8 min) and the supernatant conserved for analysis to estimate the QDs' grafting yield. The IO@STMS NPs with grafted QDs were then washed three times with water (8,000 g ; 8 min) and stored in DMF (10 mg.mL-1) at 4°C until further use.
Surface modification of IO@STMS NPs with isobutyramide (IBAM). The previous
amino-modified IO@STMS NPs (ca. 50 mg) with or without grafted QDs were initially dispersed in a solution of DMF (4.5 mL) and Et3N (420 uL) after centrifugation for buffer-exchange. Afterwards, a solution containing IBC (81 µL) in DMF (4.5 mL) was added (IBC:Et3N = 1:4) and, after 2 h reaction, deionized water (1 - 2 mL) was in turn added to dissolve the formed precipitate. When the IBC:Et3N ratios had to be changed to restore QD fluorescence, the volume of Et3N was kept
constant and the volume of IBC reduced without altering any other reaction parameter. The resulting particles modified with IBAM were collected by centrifugation (10,000g, 10 min.) and washed three times with DMF prior resuspension in DMF at a 50 mg.mL-1 concentration.
Adsorption of HSAFITC on IO@STMS NPs modified with IBAM to trace HSA adsorption profile. IO@STMS NPs without grafted QDs and thereafter surface-modified with IBAM were
exposed to various concentrations of HSAFITC (0 - 10 mg.mL-1) to determine the amount of
immobilized protein as a function of protein concentration in solution. Briefly, NPs (2.5 mg) were mixed with the HSAFITC protein solution (244 µL) in water at various concentrations. Defined
volumes of the stock HSAFITC solution were taken and brought to 244 µL by addition of water so
that the final reaction medium always consisted of a DMF:water mixture of ratio 17:83. The protein immobilization reaction was left to proceed for one hour at room temperature and under rotation. One centrifugation at 10,000 g during 10 min followed and the first supernatant, S1 (ca. 300 µL), was recovered. 300 µL of a 17:83 DMF:water mixture were subsequently added, the NPs vortexed to redisperse and centrifuged again. The second and third supernatants (S2 and S3, respectively, both of ca. 300 µL) were obtained this way. After the last centrifugation step, the NPs were resuspended in 300 µL of water and stored at 4ºC without preservatives until use.
Adsorption of HSAFITC on IO@STMS@QDs NPs modified with IBAM for the cell imaging study. In a typical protocol, the previous IBAM-modified IO@STMS@QDs NPs (20 mg) were
concentrated in DMF (5% wt, 400 µL) and incubated with HSAFITC (2 mL, 2 mg.mL-1) in deionized
water for 1 h (DMF:water mixture of ratio 17:83). The NPs were collected by centrifugation (10,000 g, 10 min), washed twice with sterile water and finally dispersed in 10 mL of sterile water. The NPs with the adsorbed protein layer were stored at 4ºC in water without preservatives until further use.
Determination of protein content on particle. The amount of immobilized protein (HSAFITC)
onto IO@STMS NPs without grafted QDs and thereafter surface-modified with IBAM was assessed via two distinct approaches: 1) the analysis of the supernatants' absorbance and 2) the bicinchoninic acid assay (BCA) test. For the first, the supernatants after rinsing, S1 to S3, were analyzed to determine the FITC absorbance at 492 nm in a microplate reader (Safas Xenius XLM, Safas Monaco). The HSAFITC concentration in the supernatants was back-calculated by means of a
calibration curve made in a 17:83 DMF:water mixture (as for the supernatants). Then, those concentrations were employed to determine the mass (µg) of protein immobilized per mg of NPs. Alternatively, the amount of protein effectively immobilized onto the NPs was estimated by using the bicinchoninic acid assay (BCA) test. For that, 25 or 50 µL of the protein-modified NPs in water were mixed with 100 or 75 µL, respectively, of the BCA reagent in a 96 well plate and incubated during 15 min at 40ºC. Thereafter, the well plate was centrifuged (2,000 rpm, 5 min; Beckman Coulter centrifuge) to enable the separation of the NPs from the reacted BCA reagent. 75 µL per well were then extracted, replaced in a 96 well plate and the absorbance at 562 nm measured in a microplate reader. Only the converted/reacted BCA reagent was measured to avoid adding the absorbance of the NPs to that of the BCA product. In parallel, a calibration curve for HSA complexed with the BCA reagent in water was obtained. Protein concentrations per well were then determined by using the absorbance at 562 nm and the calibration curve. Finally, the protein concentrations per well were converted to µg of protein immobilized per mg of NPs. As for the analysis of supernatants, one sample per condition was employed.
Cell culture. HeLa cells (cervical cancer cell line) were cultured under standard conditions (37°C,
5% CO2) in DMEM medium high glucose GlutaMAX with sodium piruvate (Gibco), supplemented
For the magnetic hyperthermia experiments only, cell medium was RPMI 1640, supplemented with 10 vol% fetal bovine serum (FBS) and 1 vol% antibiotic-antimycotic (100X).
Cell-nanoparticle interactions. Cell-nanoparticle interactions were assessed by exposing cells
to various NPs concentrations (0.25 - 250 µg.mL-1) and during variable times. For that, HeLa cells
were seeded in 24 well plates containing a glass coverslip deposited on the bottom of the wells. 24h after cell seeding, the cell medium was removed and replaced with 400 µL of DMEM medium containing the NPs (IO@STMS@QD@IBAM-HSAFITC) at the desired concentrations. Since the NPs
are not originally dispersed in cell medium but in water, any NPs’ dilution done by mixing a given volume of the NPs with cell medium inevitably induces a dilution of the latter, which may see the serum concentration reduced substantially. To avoid this (or the alternative method of buffer-exchanging the NPs), a double concentrated cell medium, named DMEM 2X, was employed. DMEM 2X was obtained from powder DMEM (High glucose) and contained 20 vol% FBS and 2 vol% p/s. For each NPs’ concentration, half of the volume per well corresponds to DMEM 2X and the other half is a mixture between PBS and the required volume of NPs to yield the desired final NPs’ concentration. At the end of the corresponding incubation times, the well was emptied, the glass coverslip taken out to another well plate, rinsed three times with PBS (gentle rinsing) and finally fixed with 4 vol% formaldehyde in PBS for 10 min. Three rinses with PBS followed after which the coverslip was mounted for microscopic observation (Vectashield mounting medium with DAPI). Microscopic observation was carried out in a Nikon Eclipse Ti-S epifluorescence microscope equipped with a Nikon Digital Sight camera and using the standard FITC and TRITC filter cubes for the detection of HSAFITC and the QDs, respectively. Images were analyzed with the
software Fiji (ImageJ).[35] These experiments were repeated three times with one sample per condition each time. Furthermore, NPs containing or not the QDs were inspected. Control wells consisted of cells not exposed to the NPs.
Cell viability and toxicity assays. Cell viability after 24 and 48 h exposure to variable
concentrations of the NPs in solution (10 - 500 µg.mL-1) was evaluated by using the MTT Test.
For that, HeLa cells were seeded in 96 well plates and left to reach ca. 60 % confluency before addition of the NPs (IO@STMS@QD@IBAM-HSA; 100 µL), diluted as explained for the cell-nanoparticles interactions with DMEM 2X and PBS. Three replicates per condition (concentration, incubation time) and two distinct nanoparticles, with and without QDs, were considered. Control wells consisted of cells not exposed to the NPs (100% metabolic activity control) as well as of wells with the highest NPs' concentration evaluated (MTT-NPs parasitic reactions control). At the end of the corresponding incubation times, the wells were emptied, rinsed once with DMEM cell medium during 5 min and thereafter exposed to 100 µL of DMEM containing 10 vol% of the MTT reagent (5 mg.mL-1 in water). During the incubation time with the
MTT reagent, cells were imaged by bright field microscopy to get an insight onto their morphology and number after exposure to the NPs. After two hours incubation with the MTT reagent, wells were emptied and let dry prior addition of 100 µL of a cell lysis solution (90 vol% isopropanol, 10 vol% Triton X-100, 0.1 vol% hydrochloric acid 37%). The absorbance at 562 nm of the dissolved formazan crystals was determined in a microplate reader (Safas Xenius XLM, Safas Monaco) and expressed as a percentage of the absorbance of the control wells not exposed to the NPs. These experiments were repeated twice with a same batch of NPs. Reported mean values are the means of both experiments (three replicates per condition). Error bars correspond to error propagation.
Cell uptake. The internalization of NPs by HeLa cells in culture was experimentally implemented
as for the cell-NPs interactions but with NPs' concentrations between 0.25 and 10 µg.mL-1.
IO@STMS@QD@IBAM-HSAFITC NPs were used. The internalization process was followed over 24
the onset of internalization. At each time point, cells were fixed and mounted as explained for the cell-NPs interactions. Microscopic observation of the slides was carried out in a Zeiss LSM 710 confocal microscope and with a Plan Apochromat 63X/1.40 oil objective. The following conditions were defined: QD excitation = 405 nm (diode laser), emission = 600 - 660 nm; DAPI excitation = 405 nm, emission = 410 - 490 nm; FITC excitation = 488 nm (argon laser), emission = 496 - 560 nm. Images were analyzed with the software Fiji (ImageJ).[35]
Magnetic hyperthermia experiments at clinical conditions (100 kHz, 117 Gauss or 9.3 kA.m-1). These experiments were carried out in a portable Alternating Magnetic Field (AMF)
applicator with forced air convection cooling, a device designed and built to allow frequencies and magnetic field amplitudes compatible with those used in clinical trials as well as to hold large (animal) samples for in-vivo experiments.[36,37] The device possess a cylindrical receptacle (30 mm diameter, 76 mm length) to hold the sample inside the resonant inductor during field application. In these experiments, HeLa cells were cultured and exposed to the magnetic field in Lab-Tek 8 well chambers (55 mm length, 25 mm width, 12 mm height) that were placed inside a plastic holder and the whole inside the cylindrical receptacle. The plastic holder served as a thermal bath where warm (37ºC) water was added to be in contact with the Lab-Tek during field application. The Lab-Tek was then centered inside the resonant inductor to guarantee field uniformity. Two equivalent Lab-Tek chambers were employed, one to be exposed to the magnetic field and the other one not to be exposed to it (control no field). Prior field application, HeLa cells were seeded (400 µL per well) on the multi-well chamber and were let to reach ca. 60 % confluency inside a cell culture incubator (37°C, 5% CO2). Thereafter, cell medium was removed
and replaced with medium doped with the bimodal NPs (IO@STMS@QD@IBAM-HSA) at a concentration of 25 µg.mL-1 during 24 h. NP's dilution was as for the cell-nanoparticle
interactions experiments. Control wells were exposed to the same medium (DMEM 2X, PBS) in which the NPs were diluted. After 24 h, wells were emptied, rinsed once with DMEM cell medium during 5 min and thereafter exposed to either a) 400 µL of cell medium (DMEM supplemented with sodium bicarbonate; final concentration = 25 mM) or b) 400 µL of cell medium as in a) but with added doxorubicin (DOX) at two concentrations, 50 and 150 ng.mL-1 (DOX stock solution =
0.5 mg.mL-1 in water). Two wells exposed to the NPs were treated with b) at 50 ng.mL-1 while
other two wells were treated with 150 ng.mL-1 (NPs + DOX). One well exposed to the NPs was
treated with a) (NPs no DOX). One control well was exposed to b) at 150 ng.mL-1 (DOX only).
Two additional control wells were exposed to a) (control cells). Wells were kept 20 min inside the incubator to reach 37 ºC prior positioning inside the AMF applicator. Five cycles of 30 min field exposure (100 kHz, 117 Gauss or 9.3 kA.m-1) followed by 10 min inside the incubator (and
without magnetic field) were applied while the control no field was kept all the time inside the incubator. At the end of the five cycles, cells exposed to the magnetic field were brought back to the incubator and were left there for 24 h, time at which the MTT assay was performed as explained in the cell viability and toxicity section. 400 µL of DMEM containing 10 vol% of the MTT reagent (5 mg.mL-1 in water) and 200 µL of the lysis solution were used per well. A BioTeck
µQuant (Gen 5TM software) microplate reader was employed to measure absorbance at 562 nm.
Cells were microscopically observed before field application and before the MTT assay. Metabolic activity values are expressed as a percentage of the absorbance of the control no field wells, thus reflecting the effect of the magnetic field application onto the metabolic activity of each evaluated condition. These experiments were repeated twice with a same batch of NPs. Reported mean values are the means of both experiments. Error bars correspond to the standard deviation of the percentages.
Magnetic hyperthermia experiments at higher magnetic field strength (100 kHz, 357 Gauss or 28.5 kA.m-1). The field generator used for these experiments consists of a resonant
RLC circuit Hüttinger (2.5/300) with a water-refrigerated 5-turn coil of 7 cm diameter.[37,38] The device can work at frequencies up to 265 kHz and with a maximum field of 56 kA.m-1, both
attainable by changing capacitors and inductances. A glass double-wall cylindrical flask is positioned inside the vertical 5-turn coil and serves as a sample holder. A circulating warm (37 ºC) water system feeds the double-wall flask to maintain the sample at 37 ºC. Four cell culture dishes of 23 mm diameter are considered on each experiment, with cells not exposed (control
cells) or exposed previously to the NPs (NPs). One set of cases is submitted to the magnetic field
and the other one remains inside the cell incubator (control no field) during field application. HeLa cells were seeded onto the dishes as explained for the experiments under clinical conditions. 2 mL cell suspension was used per dish. Cell exposure to the NPs (IO@STMS@QD@IBAM-HSA) and posterior rinsing after 24 h incubation were also as described for the clinical conditions. After rinsing, cells were exposed to 2 mL of cell medium supplemented with sodium bicarbonate (final concentration = 25 mM). Cell dishes were kept 20 min inside the incubator to reach 37 ºC prior positioning inside the field generator. Control cells and NPs dishes were placed inside the Dewar and appropriately centered to ensure field uniformity. Five cycles of 30 min field exposure (100 kHz, 357 Gauss or 28.5 kA.m-1) followed by 10 min without
magnetic field were applied while the control no field was kept all the time inside the incubator. At the end of the five cycles, magnetically-treated cells were given 30 min inside the incubator prior exposure to the MTT reagent. The MTT assay and the statistical analysis of the results were as for the experiments under clinical conditions. These experiments were repeated twice with a same batch of NPs.
Transmission Electron Microscopy (TEM), Scanning Transmission Electron Microscopy (STEM) and Energy dispersive X-ray (EDX) analysis. The IO and IO@STMS NPs were deposited on
carbon-coated copper grids. TEM, STEM images and EDX spectra were acquired with a JEOL 2100 TEM instrument operating at 200 kV coupled with energy dispersive X-ray (EDX) spectroscopy. The size distribution of NPs was determined by measuring more than 200 nanoparticles using the image analysis software ImageJ.
N2 isotherm adsorption. The STMS shell characteristics were determined by nitrogen
adsorption-desorption analysis with the Brunauer-Emmett-Teller (BET) method to determine surface area and with the Barrett-Joyner-Halenda (BJH) method to determine pore size and volume. All analyses were done on a Tristar 3000 Gas Adsorption Analyzer by Micromeritics Instruments. Before the tests, samples were outgassed under vacuum at 150°C for about 4h.
Dynamic Light Scattering (DLS). The size distribution in solution and colloidal stability of NP
suspensions was assessed by measuring the particle size distribution using a Malvern Nanosizer (Nano ZS) device in triplicate and at a NPs' concentration of 0.5 mg.mL-1 in water.
Spectrofluorimetry. A Horiba scientific Fluorolog spectrophotometer was used to measure the
amount of QDs grafted within the IO@STMS NPs. For that, QD suspensions were incubated with IO@STMS NPs and the amount of chemically grafted QDs was estimated after spectrofluorimetry analysis of the fluorescent supernatant and the construction of a calibration curve. Measurements were performed using 350 nm as excitation and an emission range from 500 to 690 nm.
Relaxivity measurements. T1 and T2 relaxation time measurements of IO@STMS NPs were
MHz (1.41 T) at 37°C. The longitudinal and transverse relaxivity values, r1 and r2, respectively,
were obtained according to the general equation of relaxivity: R=R0+r*[CA] where R is the
relaxation rate (1/T) in the presence of the contrast agent (CA), R0 the relaxation rate of the
aqueous medium (in the absence of the CA) and r the relaxivity value of the CA.
Iron dosage by NMR 1H-relaxometry. T1 relaxation time measurements were used to quantify iron
in solution. The longitudinal relaxivity r1 of a standard solution of iron III nitrate at 2vol.% HNO3
was previously determined to construct a calibration curve relaxation rates (1/T1) as a function
of [Fe3+] from 0 to 3.6 mmol.L-1. The IO@STMS nanocomposite suspension of interest was
digested with concentrated nitric acid overnight. After dilution to reach 2 vol.% HNO3, the T1
relaxation time was measured and compared with the calibration curve to determine the iron content.
Specific absorption rate (SAR) measurements for magnetic hyperthermia. The SAR measurements
from magnetic hyperthermia experiments at high fields and frequencies were obtained through a calorimetric method from a DM 100 instrument and DM applicator (Nanoscale BiomagneticsTM,
nB) under MaNIaC software. Vials adapted for magnetic hyperthermia measurements and filled with 0.5 mL of the samples (IO@STMS@QDs@IBAM-HSA) at 1 mg.mL-1 of iron were submitted to
alternating magnetic fields at different fixed frequencies (in the range 395-796 kHz) and field amplitudes (in the range 100-200 Gauss). Iron concentrations were inferred from the NPs' concentration by relaxometry (see paragraph above). The increase of temperature was monitored for 2 min. A second order polynomial function was used to fit the plot and to determine [dT/dt]t=0 as described by Perigo et al.[39] to finally calculate the SAR value by using
the following equation:
where ms and Cs are respectively the mass (kg) and the heat capacity (J. kg-1..K-1) of the sample,
mFe (g) is the mass of iron element present in the sample and (dT/dt)t=0 the derivative function of
the temperature at t = 0 (K.s-1).
RESULTS and DISCUSSION
Synthesis and characterization of magnetic stellate nanocomposites: IO@STMS NPs.
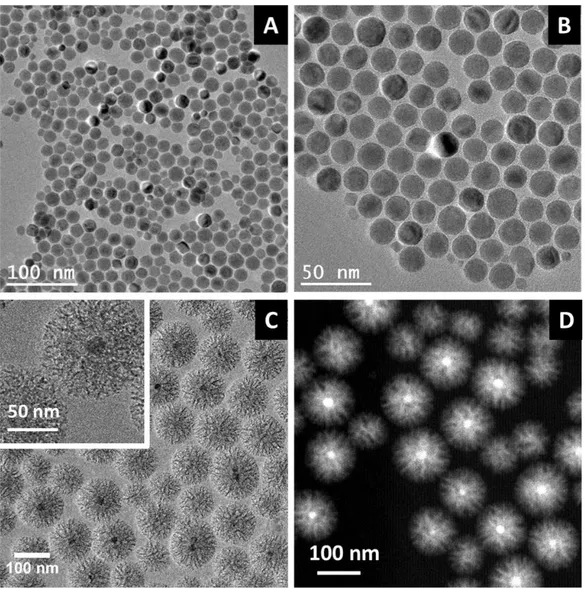
Spherical monodisperse IO NPs of 18 ± 4 nm coated with oleic acid were synthesized by thermal decomposition of an iron-stearate precursor in a high boiling point solvent in presence of oleic acid as surfactant. Such size is suitable to use these IO NPs as heating agent by magnetic hyperthermia. Spherical morphology and size distribution were characterized by TEM (Figures
2.A and B at different magnifications). XRD analysis confirmed the formation of the spinel phase
with a lattice parameter 8.391 ± 1 Å suggesting a composition close to that of the stoichiometric magnetite Fe3O4 phase (0.8396 nm, JCPDS file 19-629) (Figure S1).The washing process after the
synthesis step was carefully controlled and provided IO NPs with, at maximum, one oleic monolayer at the surface of IO NPs. Then, these IO NPs were incorporated into a stellate MS by applying an adapted procedure from Zhang et al.[23]. It consists in the condensation of tetraethylorthosilicate (TEOS) in the presence of CTATos used as structure directing surfactant and amino-2-(hydroxymethyl)-1,3-propanediol (AHMPD) as a growth inhibitor. Unlike the usual assembly of small pores found with the use of the CTAB surfactant, in this process, the stronger interactions of Tosylate (Tos-) counter ions with CTA+ micelles results in a partial packing of CTA+ micelles around which the TEOS species polymerize into a silica framework ensuring thus the formation of large pores of ca. 10-15 nm. Extraction of the surfactant was achieved by incubation in NH4NO3 ethanolic solutions and was followed by Zeta Potential measurements (ZP)
where the ZP decreased from the positively charged CTAB-coated surface up to a constant negative value of ZP of silica as previously reported[19,40,41] In a typical and reproducible synthesis, monodisperse core-shell IO@STMS NPs of ca. 107 ± 16 nm as shown by TEM imaging were obtained (Figure 2.C). A large porosity in the silica porous matrix can be clearly observed from the TEM image, as highlighted in a zoomed image (in inset).
Scanning transmission electron microscopy-annular dark field imaging (STEM-ADF) was also performed in order to ensure a better visualization of the core-shell nanocomposite thanks to an enhanced contrast based on a higher atomic number for iron vs. silicon elements. Hence, the IO core appears as white spheres whereas the stellate morphology of the STMS shell can be clearly distinguished from the core. STEM allowed to confirm the formation of individual monocores and to validate the extremely limited presence of silica NPs without magnetic core (Figure 2.D). A local Fe/Si EDX elemental analysis of individual IO@STMS NPs was also performed by STEM imaging (see Figure S2) over two subsets of ca. 25 core-shell NPs. For each subset analysis of IO@STMS NPs, an individual Fe/Si ratio was determined. Fe and Si elements were simultaneously found for most of NPs (more than 90%) and an average ratio of Fe/Si at ca. 3/97 % was determined by local EDX analysis.
The characteristics of the porous IO@STMS core-shell magnetic silica nanocomposites were investigated by BET nitrogen adsorption. A specific surface area of 472 m2.g-1 associated with a
pore volume of 108.5 cm3.g-1 and with an average pore size of ca. 10 nm were obtained by using
the adsorption model (Figure S3.A). The colloidal stability in water (pH=7) of the IO@STMS NPs nanocomposites was investigated by dynamic light scattering (DLS, Figure S3.B). Very stable suspensions of these NPs in water were obtained for several weeks with an average
hydrodynamic size of 164 nm. Although a slight NPs' sedimentation can be evidenced over time, it remained reversible by mild sonication.
Figure 2. TEM images of 18 nm size IO spherical NPs over (A) a large zone and (B) at a higher
magnification. (C) TEM image of stellate porous core shell IO@STMS NPs. The inset shows an image at higher magnification. (D) STEM-ADF image of stellate porous core shell IO@STMS NPs.
Characterization of the QDs coupling, IBAM grafting and HSA coatings
To confer fluorescence properties, carboxylated CdSe/ZnS QDs (ca. 6 nm core size, maximum fluorescence emission at 630 nm) were grafted on IO@STMS nanocomposites. First, the surface
of IO@STMS NPs was modified with aminopropyltriethoxysilane (APTS) according to a well-established procedure of surface silanization (cf. Materials and Methods section) to cover the porous surface with amine groups. Then, carboxylate-modified CdSe/ZnS QDs were activated with EDC/NHS to ensure the efficient coupling of the QDs with the amine functions of the IO@STMS NPs to form strong amide bonds. In order to quantify the amount of QDs grafted within the IO@STMS NPs, a photoluminescence (PL) intensity calibration curve was established (see
Figure S4) by measuring the photoluminescence intensities (exc/em: 350/630 nm) of QDs
samples of various concentrations in water. Then, to estimate the mass ratio of QDs per mass of nanocomposites, the supernatant resulting from the QDs' grafting step was analyzed after centrifugation of the reacted IO@STMS@QDs NPs. By reacting CdSe/ZnS QDs (1 mg) with IO@STMS NPs (50 mg), ca. 99% grafting efficiency was measured leading then to ca. 2% mass ratio of QDs relative to the nanocomposite mass.
Subsequently, to ensure colloidal stability in blood serum, longer blood circulation times and anti-fouling properties, a human serum albumin (HSA) coating was deposited at the surface of the IO@STMS@QDs nanocomposites. For that, we adapted an original IBAM-mediated protein assembly method recently developed by us and others on the silica surface.[30–33] In this method, IBAM groups are formed by reacting (128.nm-2) isobutyrylchloride (IBC) and
triethylamine (Et3N) (molar stoichiometry IBC:Et3N of 1:4) with the amine groups of the silanized IO@STMS@QD NPs. The amine groups are still present in large majority after QDs' grafting and are assumed at a grafting density of ca. 2 amines.nm-2.[42] The stoichiometry of the
ratio IBC:Et3N of 1:4 was optimized to preserve QDs from dissolution in the harsh acidic conditions of IBC and ensure suitable fluorescence while having enough IBAM grafts for HSA coating (see supporting information S5, S6 and S7)
Then, the optimization of the surface coverage by human serum albumin (HSA) was performed onto IBAM-modified IO@STMS composites by spectrophotometric methods. The profile of HSA protein adsorption onto the IO@STMS@IBAM nanocomposites was investigated as a function of the protein concentration used during immobilization. Those IBAM-modified IO@STMS composites were used without grafted QDs and with the same IBAM surface-modification treatment required to keep QD fluorescence as described above. The IO@STMS@IBAM NPs were first exposed to variable concentrations (0 - 10 mg.mL-1) of FITC-labeled HSA in a water:DMF
(83:17) mixture, then rinsed three times and the corresponding three supernatants (S1 - S3) collected. S1 corresponds to the HSAFITC impregnation supernatant while S2 and S3 correspond
to the supernatants of the two sequential washings with water:DMF (83:17). The amount of protein present in the recovered supernatants was determined by measuring the FITC absorbance (calibration curve in Figure S8.A) and was utilized to back-calculate the amount of protein effectively remaining on particle (Figure 3.A, Supernatants). As observed in Figure 3.B, the protein amounts found in the supernatants drastically diminished from the second rinsing onwards. The supernatant S3 absorbance values are comparable to the instrument error; the calculation of protein content on-particle was therefore limited to the analysis of S1 and S2 contributions. Noteworthy, there was an initial protein concentration range (< 2 mg.mL-1) for
which both, S1 and S2 are very low, indicating that most of the protein used during immobilization was retained on the NPs. For the higher protein concentrations (> 2 mg.mL-1), the
yield of the reaction diminishes, with more protein being recovered in S1 as the protein concentration used during immobilization increases (e.g. 28% recovered for 3 mg.mL-1 vs. 75%
for 10 mg.mL-1). Interestingly, S2 remains low in the whole concentration range, which highlights
the strong binding affinity of the immobilized protein layer to the IBAM-modified silica surface as well as the efficacy of the rinsing protocol. This protocol achieves to remove unbound protein in
three rounds of centrifugation. The adsorbed HSA amount (Figure 3.A) shows an initial increase in protein amount on-particle and reaches a plateau at ca. 200 µg protein per mg of NPs.
The quantification of immobilized protein amount was also carried out by directly exposing the protein-modified NPs to the commercial BCA (bicinchoninic acid) reagent kit. The BCA test is a colorimetric assay that measures protein concentrations in solution by relying on two reactions: first, the reduction of Cu(II) to Cu(I) ions from the reagent by protein peptide bonds and then formation of Cu(I)-BCA2 complex having a strong purple-color measured by absorbance at 562
nm (see calibration curve in Figure S8.B). The amount of Cu2+ reduced is proportional to the
amount of protein present in the suspension at the NPs surface. As observed in Figure 3.A, the BCA and supernatants data provide very close results in the low concentration range (< 2 mg.mL -1), although they differ in the plateau region, with a value of 150 vs. 200 µg protein per mg of
NPs for the BCA and for the supernatant method, respectively. We will then assume a 150 - 200 range for the µg protein per mg of NPs. At ca. 3 mg.mL-1, a distinctive difference between both
methods can be observed, which may be due, in this specific sample, to the recovery after rinsing of a lower amount of NPs.
Figure 3. (A) HSA adsorption profile representing the mass of immobilized HSA per mass of
composite (µg HSA.mg-1 composite) as a function of the HSA concentration during
immobilization. Results correspond to the application of two methods: the BCA assay to directly measure protein amounts on-particle and the analysis of the supernatants by absorbance spectroscopy after protein immobilization. (B) Protein concentration in the three supernatants obtained by rinsing the IO@STMS@IBAM-HSA-FITC NPs after HSA-FITC adsorption.
In the next experiments, we proceeded to the synthesis of IO@STMS NPs with grafted QDs (at 2 wt.%) and with an adsorbed protein layer obtained only at one HSA concentration during protein immobilization, 1.67 mg.mL-1. This concentration was chosen by taking into account that the
corresponding immobilized protein amount was similar to the one found in the plateau region (i.e. 150 - 200 µg protein per mg of NPs). This batch bearing QDs was denoted IO@STMS@QDs@IBAM-HSA and was employed in all MRI tests and biological assays described below.
The resulting IO@STMS@QDs@IBAM-HSA nanocomposites were thereafter imaged by TEM. All the components: iron oxide core, stellate mesoporous silica, QD spots and HSA coating (displaying an elastic-like nature) were clearly identified (Figure 4.A and 4.B). A TEM image in a zoomed area unveils the small QDs' black spots and the polymer-like nature of the HSA coating at the surface of the composite (Figure 4.B). The white arrow highlights a location where two IO@STMS@QDs@IBAM-HSA NPs are "glued" together by HSA. To complete the characterization of the IO@STMS@QDs@IBAM-HSA NPs, the colloidal stability of these NPs was assessed in water (pH=7) by DLS. A mean hydrodynamic diameter in water of 194 nm was obtained showing a monomodal dispersion of the albumin-modified nanocomposites (Figure 4.C). Furthermore, zeta potential measurements performed at pH=7 before (i.e. on IO@STMS@QDs NPs; ZP = + 2.7 mV)
and after IBAM-HSA coating (i.e. on IO@STMS@QDs@IBAM-HSA NPs; ZP = - 22.9 mV) evidenced the charge reversal obtained during this build-up. This charge reversal is in agreement with the positive (or near neutral surface) charge of APTS-modified composites (isoelectric point, IEP, close to 7) and with the negative charge of HSA (IEP 4.7) at this pH. Furthermore, protein modification of these composites was found to have no effect onto the fluorescence emission properties of the nanocomposites (Figure 4.D, fluorescence spectrum).
Figure 4. (A) Large zone and (B) zoomed TEM images of stellate porous magnetic core-shell
IO@STMS@QDs@IBAM-HSA NPs. The white arrows indicate the presence of the HSA coating having a polymeric consistency in TEM. The small black spots correspond to the CdSe/ZnS QDs. (C) DLS size distribution of IO@STMS@QDs@IBAM-HSA NPs in water (pH=7). (D) Fluorescence spectrum of IO@STMS@QDS@IBAM-HSA NPs (excitation at 350 nm). At the right: a picture of the red fluorescent NP suspension under UV lamp excitation.
MRI properties: relaxivity measurements
The properties of the HSA-coated IO@STMS NPs as MRI contrast agents were assessed in water with and without grafted QDs. The longitudinal (T1) and transverse (T2) relaxation times of water protons were measured by NMR relaxometry (1.41T or 60 MHz at 37°C) in water at various Fe concentrations. For that, the iron amount in HSA-coated IO@STMS NPs was obtained by a relaxometric dosage in HNO3 2 vol.% after digesting the iron core in HNO3 39 vol.%. The
curves corresponding to the relaxation rates 1/T1 and 1/T2 as a function of [Fe] in IO@STMS NPs were then traced for the NPs without (Figure 5.A and B) and with (Figure 5.C and D) QDs in water at pH 7.5, 37°C and 1.41 T. The slopes of the curves provided the transversal and longitudinal relaxivity values of HSA-coated IO@STMS NPs, which were calculated at r2=196 mM -1s-1 and r1=4.2 mM-1s-1 without grafted QDs whereas for nanocomposites with grafted QDs, values
of r2= 197 mM-1s-1 and r1=1.9 mM-1s-1 were found. These 18 nm IO NPs, coated instead with
dendron molecules were shown to have r1 and r2 values of about 12 and 189 mM-1s-1,
respectively.[43] The silica shell has thus no impact on the relaxivity r2 suggesting a good water diffusion around the magnetic nanocomposite. The decrease of the r1 relaxivity is in agreement with the presence of the silica shell at the surface of magnetic NPs.[20,44] Furthermore, as
expected, the presence of QDs within the silica layer did not affect the transversal relaxation times.
Figure 5. Transversal R2=1/T2 (s-1) and longitudinal R1=1/T1(s-1) relaxation rates as a function of
[Fe] (mM) for IO@STMS@IBAM-HSA (A and B, respectively) and for IO@STMS@QDs@IBAM-HSA (C and D, respectively) in water at pH 7.5, 37°C and 1.41 T.
Magnetic fluid hyperthermia. Specific absorption rate measurements
The magneto-thermal properties of the HSA coated IO@STMS NPs with grafted QDs were then evaluated. The temperature increase of a 500 µL nanocomposite suspension with an iron concentration of 1 mg.mL-1 under an alternating magnetic field with various frequencies and field
amplitudes was recorded. Specific absorption rate (SAR) results are plotted in Figure 6 (see associated temperature profiles in Figure S9). As expected, SAR measurements increase
regularly with field amplitude and frequency. SAR values are significant, even with the product H*f below 5.109 A.m-1.s-1 (e.g., 120 W.g-1
Feobtained with a field amplitude of 150 G (12 kA.m-1)
and a frequency of 395 kHz), which is one criteria to fix a threshold in terms of magneto-thermal dose applied for a safe use in the clinics.[45]
The nanocomposites exhibited also a SAR of 209 W.g-1
Fe at 796 kHz and 150 G (H*f = 9.6.109
A.m-1.s-1). This SAR value is similar to that of the nanocomposite without QDs showing that QDs
have no effects as expected considering their low size and volume compared to the nanocomposite volume. However this SAR value is lower than that of dendronized 20 nm iron oxide NP without silica coating (400 W.g-1
Fe). This diminution might be attributed to the silica
shell, which is expected to be an insulating media, and yet reducing the energy transfer from the NPs to the media. A maximum value of 350 W.g-1Fe is obtained with the highest frequency / field possible with the apparatus: 796 kHz and 200 G (16 kA.m-1). However despite the presence of the
silica shell, a relevant heating transfer is still achieved in suspension, demonstrating the potential of such composites as therapeutic tools by magnetic hyperthermia.
Figure 6. Specific absorption rates for various frequencies (395, 579 and 796 kHz) and various
field amplitudes (100, 150 and 200 Gauss).
Biological studies
Then, we proceeded to evaluate cell-nanoparticle interactions and any possible NPs' toxicity. The cytotoxicity was evaluated by exposing cells to increasing concentrations of the nanocomposites. Briefly, HeLa cells were exposed during 24 and 48 h to two types of NPs, either containing or not the QDs. The samples without QDs were surface-modified with HSA at the already-established concentration of 1.67 mg.mL-1 during protein immobilization and with the same IBAM
surface-modification treatment required to keep QD fluorescence. When referring to the cytotoxicity of the nanocomposites (as determined by the MTT assay and expressed as metabolic activity relative to the control cells), a concentration-dependent effect was observed for both types of NPs and it was more pronounced at the longest incubation time (Figures 7 and S10.A and B).
Figure 7. Metabolic activity of HeLa cells exposed to variable concentrations of
and 48h. The metabolic activity is expressed as a percentage of the control cells and it corresponds to the conversion of the MTT reagent by cells after NP exposure.
After 48h incubation with the NPs, the concentration corresponding to a 50% metabolic activity, C50, is 50 µg.mL-1 for the samples with QDs and it is higher than 100 µg.mL-1 for the samples
without QDs. Except for the 500 µg.mL-1 case, a statistically significant difference between both
types of NPs was found for all concentrations at 48h (p < 0.01; two-sample T-test), implying the existence of distinct properties on both types of NPs. Finally, for concentrations 500 µg.mL-1 and
beyond (we've also tested 1000 µg.mL-1), the total number of NPs appears overwhelming to cells
irrespective of the NPs' type: non-specific cell-nanoparticle interactions and NPs' sedimentation irreversibly affect cell survival and equally diminish metabolic activity to ca. 10% in both cases (Figures S10 and S11). As observed by epifluorescence microscopy in Figure S12 non-specific cell-nanoparticle interactions diminish and become negligible as expected by decreasing NPs’ concentration. Altogether, the applicability range of these multimodal NPs from a cell-nanomaterial interactions' point of view is restrained to concentrations below 30 µg.mL-1 for
which almost negligible non-specific interactions with HeLa cells could be confirmed as well as reasonable low cytotoxicity levels (91% metabolic activity for 10 µg.mL-1 at 48h, as seen in
Figure 7).
Furthermore, at a concentration of 25 µg.mL-1 and below that, active transport mechanisms of
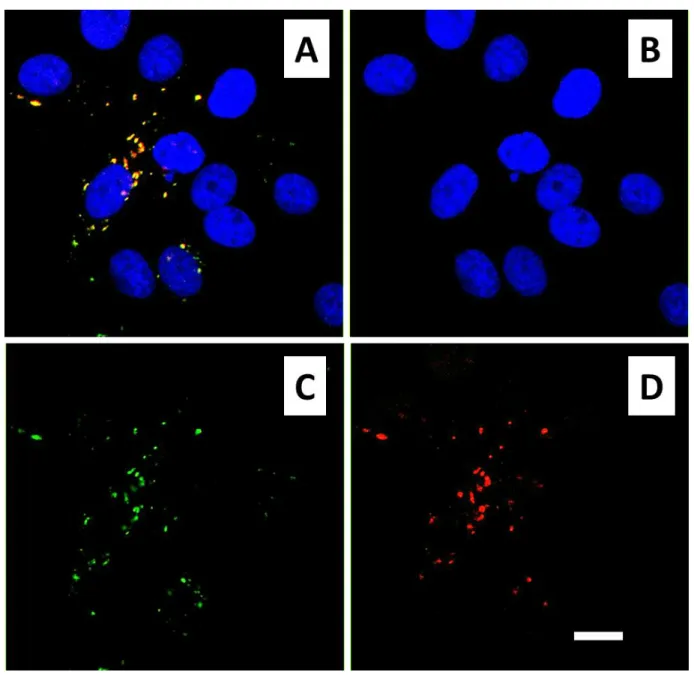
these multimodal nanocomposites by HeLa cells have been ellucidated by confocal microscopy already at times as short as 60 minutes. Endosome-like structures where the QDs (red fluorescence) and FITC (green fluorescence) signals are co-localized have been consistently observed with these nanocomposites in a concentration range of 0.1 - 25 µg.mL-1 (Figure 8.A for
FITC and QD signals implies that the protein layer remained bound to the NPs during the active cellular transport process and the endosomal confinement, thus withstanding low pH conditions and adequately resisting the action of cellular proteases. Furthermore, for the QD’s signal, it remains bright and sharp in such intracellular compartments even after 48h incubation (Figure
8.B); That indicates that these bimodal NPs have a remarkable resistance to QDs’ photobleaching
within the vesicular/endosomal compartment.
Figure 8. Confocal microscopy images showing the spontaneous internalization of the
multimodal nanocomposites (IO@STMS@QD@IBAM-HSAFITC NPs) by HeLa cells exposed to these
NPs at a concentration of 10 µg.mL-1 during (A) 24 h and (B) 48 h. (A) Internalized NPs present in
endosome-like compartments. Note the colocalization of the green (HSAFITC) and red (QDs)
signals that give an orange merge. In this image, the fluorescence detection threshold was set low in the green channel so as to allow visualization of the green cell autofluorescence in the cytoplasm and of the more intense green fluorescent vesicles. (B) QD channel image superimposed to a bright field image highlighting the sharpness and brightness of the QD signal recorded inside the endosome-like compartments after 48 h. Here, the fluorescent threshold was set high in the green channel, hence avoiding cell autofluorescence. Fluorescent colors: DAPI
(blue, cell nucleus), FITC (green, corresponding to the HSAFITC protein layer around the NPs) and
QD (red, QDs’ emission). Scale bars = 10 µm.
Figure 9. Confocal microscopy images of HeLa cells exposed to 25 µg.mL-1 of the multimodal
nanocomposites (IO@STMS@QD@IBAM-HSAFITC NPs) during 24h and visualized as a merged
image (A) with its three constituents: DAPI (B), FITC (C) and QD (D) channels. Note the colocalization between FITC and QD signals and the presence of a higher number of NP-containing endosome-like structures per cell at this higher concentration (compared to Figure
8). In this image, the cell autofluorescence remains below the intensity threshold employed for
the green channel and it is therefore not detected. Scale bar = 10 µm.
Magnetic hyperthermia on 2D cell cultures at two distinct magnetic field conditions
To demonstrate the potential of these NPs for magnetic hyperthermia applications, we exposed HeLa cells that had already internalized the NPs to two magnetic field conditions: one that served the purpose of proof-of-concept under a high field amplitude and frequency (100 kHz, 357 Gauss or 28.5 kA.m-1) and the other one that simulates the more challenging conditions
found in clinical settings (100 kHz, 117 Gauss or 9.3 kA.m-1). Prior field application, HeLa cells
were exposed to IO@STMS@QD@IBAM-HSA NPs at a concentration of 25 µg.mL-1 during 24 h to
trigger NPs' internalization and vesicular accumulation by cells. This NP concentration was chosen due to the obtained high levels of NP uptake (see Figure 7) and acceptable viability values (78%) at 24 h. At the end of the incubation with the NPs, cells were exposed to the magnetic field in five cycles, each of 30 min field ON, 10 min field OFF with controlled cell holder temperature (37 ºC). As observed in Figure 10 (NO clinical, red labels), cells exposed to a magnetic field of high amplitude and frequency (100 kHz, 357 Gauss) were substantially affected by the magnetic treatment: cells incubated with the NPs had 35 ± 8 percent of the metabolic activity (as determined by the MTT test) of equally pre-treated cells that were not exposed to the field while control cells (not incubated with the NPs) had 83 ± 16 percent of the metabolic activity of their equally pre-treated counterpart without magnetic field. By using magnetic NPs trafficked to lysosomal compartments and applying an alternating magnetic field of 275 kHz and 400 Gauss during two hours, Clerc et al. reported 32.3 ± 2.7% cell death, determined as here by the MTT test.[46] We achieved ca. 65% cell death with lower field frequency and amplitude, a cyclic instead of continuous application of the field, and, importantly, a NPs concentration that is
at least ten times lower (16 μg Fe.mL-1 versus our 25 µg NPs.mL-1 that corresponds to 1.25 μg
Fe.mL-1).
Under high field conditions, microscopic observation of all tested samples prior and after field application pointed at a loss of cell adhesion in the magnetically-treated samples, for which a subset of cells was found detached and floating whereas samples not exposed to the field had their cell adhesion unaltered. In addition, the remaining metabolic activity after magnetic field application is significantly lower for cells incubated with the NPs as compared to those without NPs (control cells), thus underlining the detrimental effect of NP's uptake followed by magnetic treatment onto cell metabolic activity. Based on previous results,[38] we hypothesized that the bimodal NPs present in cell vesicles are responsible for a localized temperature increase that reduces cell viability and metabolic activity when subjected to a magnetic field. While this occurred for the high magnetic field condition, no substantial differences could be observed between the treated and no-treated samples when field application was carried out under clinical conditions (see Figure 10, clinical, NPs and control cells bars). The metabolic activity of cells pre-incubated with the NPs and exposed to the magnetic field was of 97 ± 2 percent of their counterpart without field. Control cells exposed to the field had 98 ± 3 percent. Noteworthy in the clinical case, cellular metabolic activity was determined 24 h after field application and not right-after as in the "NO clinical" case.
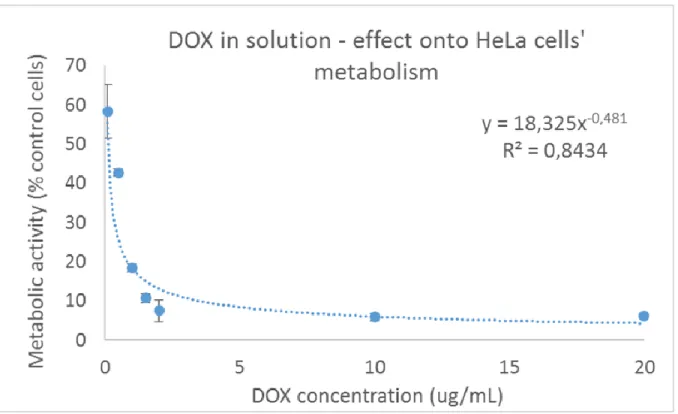
Nevertheless substantial metabolic activity losses after AMF treatment could be evidenced when a drug, doxorubicin, was added to the cells during field application and kept in the cell medium the following 24 h prior metabolic activity testing. Doxorubicin (DOX) is a well-known chemotherapeutic drug valuable in clinics for the treatment of different tumors.[47–49] Two DOX concentrations were screened, 150 and 50 ng.mL-1, taking into account a previously-obtained

![Figure 5. Transversal R 2= 1/T 2 (s -1 ) and longitudinal R 1= 1/T 1 (s -1 ) relaxation rates as a function of [Fe] (mM) for IO@STMS@IBAM-HSA (A and B, respectively) and for IO@STMS@QDs@IBAM-HSA (C and D, respectively) in water at pH 7.5, 37°C and 1.41](https://thumb-eu.123doks.com/thumbv2/123doknet/14700432.564619/30.918.147.770.187.659/figure-transversal-longitudinal-relaxation-rates-function-respectively-respectively.webp)