EUROCK 2006 – Multiphysics Coupling and Long Term Behaviour in Rock Mechanics – Van Cotthem, Charlier, Thimus & Tshibangu (eds) © 2006 Taylor & Francis Group, London, ISBN 0 415 41001 0
The role of rock mechanics in analysing overbreak: application to the
Soumagne tunnel
R.M. Schmitz, S. Viroux , R. Charlier Université de Liège, Liège, Belgium S. Hick
SM-Soumagne, Belgium
ABSTRACT: Overbreak is a considerable cost factor in underground construction. In literature virtually no information is available relating rock mechanical parameters quantitatively to overbreak. During the construction (drilling, blasting & mucking) of the Soumagne hard rock tunnel, a high-speed railway tunnel connecting Brussels to Cologne, the overbreak was studied. Together with sparse information from literature, it was shown that overbreak can be related to rock mechanical parameters, like the rock mass rating.
1 INTRODUCTION
Overbreak is a considerable cost factor in underground construction. Up to date there are no efficient methods to predict overbreak during tunnel construction. There-fore it is difficult for the appointed rock mechanical engineer to find out ways to reduce it. A literature survey was started to understand overbreak and to investigate its rock mechanical background. These results were published by Schmitz (2003). The prac-tical application of this knowledge, based on Viroux (2003) is discussed in this contribution. The goal was to find a practical method to predict overbeak on the basis of the geomechanical properties of the rock mass on a day-to-day basis at the construction site. This problem was analysed during the construction of the Soumagne tunnel, which is part of the high-speed rail link between Brussels, Liège, Aachen and Cologne (see figure 1).
Figure 1. The high-speed rail link between the large cities in Western Europe. Paris-Brussels is operational since 1993. The Link Brussels-Antwerp-Amsterdam is currently under construction. Brussels-Liège is nearly terminated. The con-nection from Liège to the German border is at present under construction.
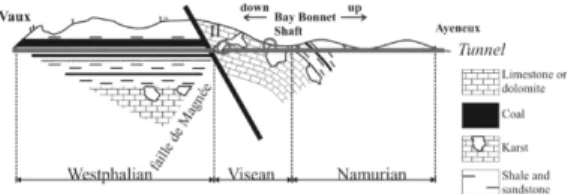
The geology of the Soumagne tunnel (located in Westphalian, Visean and Namurian formations) was described by Schmitz and Schroeder (2003).
2 DATA
The acquisition of geological, geometrical data, infor-mation about the excavation etc. is an important step in the development of an analysis relating overbreak to geomechanical properties like: the RMR, the stratig-raphy, drilling rate of blast holes or reconnaissance drilling ahead of the tunnel front etc.
The analysis of Viroux (2003, et al 2004) concen-trated principally on the:
– geological characteristics of the tunnel front, such as the UCS, RQD, stratification, RMR,… measured by the engineering geologists on site
Figure 2. The Soumagne tunnel traverses from the West to the East: Westphalian (Exploited coal seams, filled with rub-ble, shale and SST) Visean (LST), Magnée fault, Paleokarts Visean-Namurian contact, Namurian (thin coal seams and shales). Figure from Schmitz and Schroeder (2003).
– overbreak measurements measured by the geodetic team
– information on drilling rates (reconnaissance drilling)
At the time of the investigations (end 2002 to September 2003) the tunnel was still excavated at 4 tunnel fronts at the same time. Therefore data was not yet available for the entire tunnel. A detailed study was performed on a stretch of several 100 m length in the zone relating Vaux-sous-Chêvremont (in the West) to the shaft at Bay Bonnet.Although this zone is limited in length it shows a variety of geomechanical properties, which characterise the other zones as well.
We would like to stress that the data used in this analysis is based only on that type of data that can be measured during active tunnel construction without causing obstruction or additional costs.
3 DIGITALISATION
After each blasting cycle the tunnel front is analysed by the local team of engineering-geologist. The for-mations are identified, structural features are marked, the general constitution of the rock is described and the RMR is estimated. This information is available in hand-drawn images (of each tunnel front after blasting) like the one shown in figure 3.
This information, contained in handwritten forms, has to be digitised first. The figures are scanned, the circumference of the tunnel is characterised by sev-eral points of known (x,y) coordinates. The part of the discontinuities (like bedding planes, fractures, fold axis etc.) close to the tunnel circumference are char-acterised by at least 4 coordinates. The orientation of these discontinuities is determined by linear regres-sion based on the least squared error method to find functions in the x,y coordinate system. Once the func-tion describing the orientafunc-tion of the discontinuities and the tunnel circumference are known, it is easy to treat the data (calculate angle between discontinuities from the vertical or horizontal; the angle with the circumference; the angle between different discontinu-ities; division of discontinuities in families according to their orientation; etc.) with standard spreadsheet programmes.
Besides the information gathered by the engineering-geologists, the geodetic staff measures the actual cir-cumference of the excavation blasted into the host rock. An example of such a measurement is shown in figure 4.
These overbreak measurements have to be digitised as well. Once both the engineering geological data and the geodetic data are digitised and transformed to a unique coordinate system (from 0◦right tunnel wall to 180◦left tunnel wall) the first analysis can be started.
Figure 3. Tunnel front drawing with important geomechan-ical features made by the engineering-geologists after each blasting cycle. Figure from Viroux (2003).
Figure 4. The theoretic tunnel circumference and the mea-sured tunnel profile after excavation. Figure from Viroux (2003).
4 FIRST RESULTS
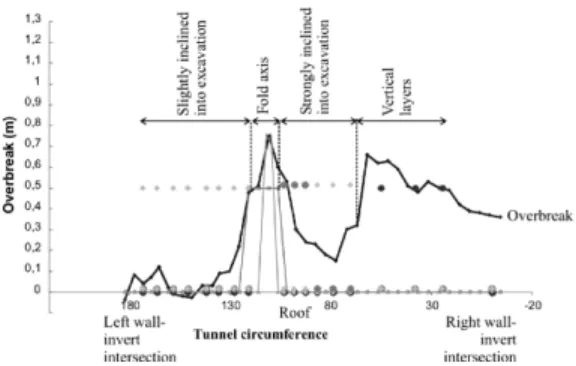
A first comparison between overbreak and geome-chanical data is shown in figure 5 (based on the same tunnel front shown in figures 3 and 4). The overbreak is negligible in the left tunnel wall, increases to a max-imum left of the crown decreases and increases again and remains stable along the right tunnel wall. The maximum corresponds to the presence of a fold axis, the second to maximum overbreak is located in the region with vertical layers. The least overbreak is found in the tunnel wall with layers dipping slightly into the excavation. The same analysis performed on several tunnel fronts provides correlations between structural features and the occurrence of overbreak (described in section 8). The same digitisation and treatment in spreadsheet programmes can be used to extend the
Figure 5. Digitised geodetic overbreak data and digitised geomechanical data superposed. Minimum and maximum overbreak occurrences can be related directly to discontinuity orientation.
Figure 6. RMR versus overbreak, data from a stretch of the Soumagne tunnel (figure from Viroux 2003).
analysis to correlate overbreak to RMR etc. This will be shown in the following section.
5 CAN THE RMR BE RELATED TO OVERBREAK?
The relationship between the RMR and overbreak is not straightforward (Schmitz 2003). The non-linearity between the RMR and overbreak as shown for a stretch of the tunnel in figure 6 is therefore not surprising.
In figure 6, two different humps can be recog-nised. The reason for the presence of the first hump is discussed in the next section.
6 A CAVE-IN IS NOT OVERBREAK
As discussed in Schmitz (2003) a cave-in is not an overbreak. The geological situation at Soumagne is at several locations dominated by Paleokarst (Schmitz and Schroeder 2003). If tunnelling through such a ter-rain, major “overbreak” can be produced by puncturing karst pockets during excavation (see figure 7).
Figure 7. Cave ins in karst can be caused by excavation using drilling and blasting but even during TBM driving or roadheader cutting.
In these cases the overbreak can mount quasi infinitely. Although the regions were Paleokarst could be found are known in advance, the exact location with a precision sufficient for construction is difficult (or impossible). In the tunnel of Soumagne, Paleokarst can be found wherever the Visean meets the Namurian and in those locations where the Magnée fault is crossed. A similar form of cave-in can be found where old filled-in mine galleries are found in the Westphalian. This shows that in two out of three formations passed by the Soumagne tunnel, situations such as shown in figure 7 can occur. Such zones are, by the nature of the infill, characterised by a very low RMR and at the same time by a very large overbreak. These two factors are responsible for the left hump shown in figure 6.
7 GENERAL APPEARANCE DATA: RMR
As discussed in the sections above, the relationship between the RMR and overbreak is not linear. The rela-tionship is marked by two humps. The hump at low RMR values is due to cave-in (section 6) the hump at higher RMR values to “genuine” overbreak (see figure 8).
If the “genuine” overbreak is regarded separately one can clearly see the resemblance to the relation-ship between the discontinuity spacing (replacing the RMR for discontinuity spacing) and the overbreak found by Müller (1978) reproduced in figure 9. The curve of the second hump passes through the the-oretical points (RMR,overbreak): (0,0) and (100,0). Rock masses with a RMR equal to 0 represent either a rock mass with a sheer endless amount of discon-tinuity families, a soil, which does not suffer from overbreak sensu stricto but from shear failure. A RMR equal to 100 represents a homogenous rock mass (lacking discontinuities), which theoretically could be blasted without producing an overbreak which follows existing discontinuity sets.
Figure 8. The relationship between RMR and overbreak (HP).
Figure 9. Prediction of the amount of overbreak on the basis of the average discontinuity spacing, the form of the rock blocks, and the degree of separation of the rock blocks from the rock mass matrix (x). Modified after Müller 1978.
The dashed line in figure 8 represents the general trend of the average overbreak observable while con-structing, without the theoretical separation between genuine overbreak and cave-in.
With this system a RMR can be related to a maxi-mum overbreak. Now a method is needed to determine the RMR in advance (see section 11).
8 GENERAL APPEARANCE DATA: STRATIGRAPHY
Besides the relationship between the RMR and break, a relationship between stratigraphy and over-break – as was already shown in figure 5 – exists as
Figure 10. Relationship between the stratigraphy and the overbreak (+/− standard deviation).
Figure 11. Lithologies related to overbreak (+/− standard deviation).
well. The analysis (details inViroux 2003) of many tun-nel stretches led to the summary shown in the figure below.
In figure 10 it is shown clearly that in horizontal lay-ered rock mass, the magnitude of overbreak is less than in inclined rock masses. If the rock mass is inclined and directed into the excavation the maximum amount of overbreak can be found.
9 GENERAL APPEARANCE DATA: LITHOLOGY
Figure 11 shows the relationship between the different lithologies and the overbreak. Figure 11 resembles fig-ure 8. The resemblance is caused by the relationship between the RMR and a specific lithology (table 1). In Soumage, the clayey materials (A) have a lower RMR than the LST (C), which has the highest rating. Between these two extremes the influence of disconti-nuities and other factors entering the RMR obscure the direct relationship between the RMR and lithology.
Table 1. Average RMR and its standard deviation for the different lithologies encountered in the tunnel.
Lithology A SAS SLG SG CA SAS/SLG C RMR 10 34 42 47 48 51 64 Stan. 0 7.1 9.5 3.5 7.1 3.6 4.5 dev. 10 DIFFERENT GEOMECHANICAL RELATIONSHIPS
Up to here relationships between the overbreak and the:
– RMR (figure 8) – stratigraphy (figure 10) – lithology (figure 11)
– discontinuity spacing (figure 9; not for Soumagne) have been presented. It has already been described that these properties are interrelated. These relationships are unique for each construction site. For the Sou-magne tunnel these relationships will not be described here but can be found in Viroux (2003). It has to be noted that the relationship between the overbreak and the RMR (figure 8) gives the maximum overbreak and the relationship between the stratigraphy and the over-break (figure 10) and the lithology and the overover-break (figure 11) give the average overbreak. These rela-tionships are nice as such but the goal was to give a prediction of the overbreak while tunnelling. There-fore either the RMR or the stratigraphy or the lithology must be known in advance. This will be discussed in the following section.
11 PREDICTION OVERBREAK AHEAD OF TUNNEL FRONT
The famous mining expression “Vor der Hacke ist es Dunkel” applies as well to modern tunnelling. But, there are ways to enlighten our knowledge of what lies ahead of us. One of these tools is reconnaissance drilling ahead of the tunnel front over a length of more than 20 m as applied in the Soumange tunnel dur-ing each weekend when normal excavation stops for maintenance. These reconnaissance drilling are used to recognise possible water inflow and to obtain infor-mation about the lithology by analysing rock chips. At the same time the drilling rate tells something about the geomechanical properties of the rock mass. Because the drilling rate is not a point measurent but a function of the length drilled and the distance to the blasted zone etc. many corrections need to be made. In figure 13 the correction proposed by Viroux (2003) is
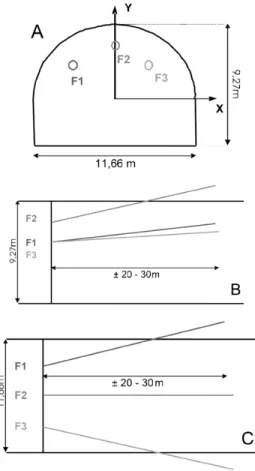
Figure 12. The orientation of the reconnaissance drill holes. A: view towards the tunnel front. B: section, through the tunnel front. C: plan view.
Figure 13. The drilling rate is corrected for the length drilled (figure from Viroux et al 2003).
shown in which the drilling rate is corrected for the drilled length.
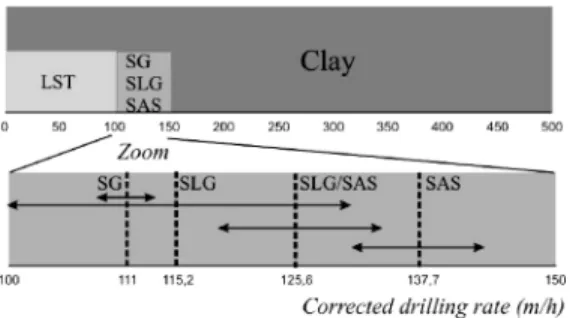
Each lithology is characterised by a specific range of drilling rates (figure 14). Once the lithology has been recognised the average expected overbreak can be determined (figure 11). Once the lithology is known, the maximum overbreak can be predicted (figure 8) on the basis of the relationship between the lithol-ogy and the RMR (table 1). The reconnaissance drilling cannot be used to determine the stratigraphy in advance therefore other tools should be used (e.g. creation of a virtual tunnel front using all available structural geological data).
Figure 14. Relationship between lithology and drilling rate measured during reconnaissance drilling.
Figure 15. Block diagram showing the information needed as input to determine the average and maximum overbreak.
12 CONCLUSION
A relationship between the available rock mechanical data and the overbreak is not straightforward. It is how-ever possible to determine the range of the overbreak to be encountered in advance of the tunnel front.
What should be remembered: overbreak is related to the RMR and more in detail to the discontinuity spacing (see as well Müller 1978) and the orientation of the discontinuities with respect to the tunnel and gravity.
With the drilling rate measured during reconnais-sance drillings one can estimate the maximum and
average value of the overbreak one can encounter (sticking to the same blasting scheme). The effect of the stratigraphy has to be added directly or by a cor-rective factor. Schematically this can be represented as shown in figure 15.
The results of the work presented here are encour-aging. The appearance of overbreak can be related to different rock mechanical parameters. If these rock mechanical parameters are known on the basis of a site investigation, the amount of overbreak that will be attained (with a certain error), can be predicted before construction starts. 13 ABBREVIATIONS A Clay C Limestone CA Argillaceous limestone HP Overbeak LST Limestone RMR Rock mass rating RQD Rock quality designation SAS Clayey-silty shale SG Sandy shale SLG Slightly sandy shale SST Sandstone
UCS Unconfined compressive strength
LITERATURE
Müller, L. 1978. Der Felsbau. Dritter Band. Enke Verlag. Stuttgart.
Schmitz, R.M. 2003. Line infrastructure and the role of engi-neering geology in analysing overbreak, part I: theoretical considerations. Ingeokring Newsletter, published by the Dutch association of engineering geology. 10(2): 31–40. Schmitz, R.M. & Schroeder, C. 2003. Line infrastructure and
the role of engineering geology in the Belgian karst belt. Ingeokring Newsletter, published by the Dutch association of engineering geology. 10(2): 10–19.
Viroux, S. 2003. Caractérisation géotechnique de l’apparition de hors profils lors du creusement d’un tunnel. MSc-Eng thesis. Department: GéomaC. Université de Liège. Viroux, S., Schmitz, R.M., Charlier, R. 2004.
Caractérisa-tion géotechnique de l’appariCaractérisa-tion de hors profils lors du creusement d’un tunnel : application au tunnel de Soumagne. Tunnels et Ouvrages Souterrains. 181: 47–48.