Publisher’s version / Version de l'éditeur:
Vous avez des questions? Nous pouvons vous aider. Pour communiquer directement avec un auteur, consultez la première page de la revue dans laquelle son article a été publié afin de trouver ses coordonnées. Si vous n’arrivez pas à les repérer, communiquez avec nous à [email protected]. Questions? Contact the NRC Publications Archive team at
[email protected]. If you wish to email the authors directly, please see the first page of the publication for their contact information.
https://publications-cnrc.canada.ca/fra/droits
L’accès à ce site Web et l’utilisation de son contenu sont assujettis aux conditions présentées dans le site LISEZ CES CONDITIONS ATTENTIVEMENT AVANT D’UTILISER CE SITE WEB.
2006 IEEE Congress of Evolutionary Computation (CEC 2006) [Proceedings],
2006
READ THESE TERMS AND CONDITIONS CAREFULLY BEFORE USING THIS WEBSITE. https://nrc-publications.canada.ca/eng/copyright
NRC Publications Archive Record / Notice des Archives des publications du CNRC :
https://nrc-publications.canada.ca/eng/view/object/?id=df4c8d02-60f3-42aa-951d-93c8d69b0a07
https://publications-cnrc.canada.ca/fra/voir/objet/?id=df4c8d02-60f3-42aa-951d-93c8d69b0a07
NRC Publications Archive
Archives des publications du CNRC
This publication could be one of several versions: author’s original, accepted manuscript or the publisher’s version. / La version de cette publication peut être l’une des suivantes : la version prépublication de l’auteur, la version acceptée du manuscrit ou la version de l’éditeur.
Access and use of this website and the material on it are subject to the Terms and Conditions set forth at
Virtual Reality Spaces for Visual Data Mining with Multiobjective
Evolutionary Optimization: Implicit and Explicit Function
Representations Mixing Unsupervised and Supervised Properties
National Research Council Canada Institute for Information Technology Conseil national de recherches Canada Institut de technologie de l'information
Virtual Reality Spaces for Visual Data
Mining with Multi-objective Evolutionary
Optimization: Implicit and Explicit Function
Representations Mixing Unsupervised and
Supervised Properties *
Valdés, J., Barton, A.
July 2006
* published at the IEEE Congress on Evolutionary Computation (CEC) Special Session of IEEE World Congress on Computational Intelligence. Vancouver, British Columbia, Canada. July 16-21, 2006. NRC 48507.
Copyright 2006 by
National Research Council of Canada
Permission is granted to quote short excerpts and to reproduce figures and tables from this report, provided that the source of such material is fully acknowledged.
Virtual Reality Spaces for Visual Data Mining with Multiobjective
Evolutionary Optimization: Implicit and Explicit Function
Representations Mixing Unsupervised and Supervised Properties
Julio J. Vald´es and Alan J. Barton,
Abstract— Multi-objective optimization is used for the com-putation of virtual reality spaces for visual data mining and knowledge discovery. Two methods for computing new spaces are discussed: implicit and explicit function representations. In the first, the images of the objects are computed directly, and in the second, universal function approximators (neural networks) are obtained. The pros and cons of each approach are discussed, as well as their complementary character. The NSGA-II algo-rithm is used for computing spaces requested to minimize two objectives: a similarity structure loss measure (Sammon’s error) and classification error (mean cross-validation error on a k-nn classifier). Two examples using solutions along approximations to the Pareto front are presented: Alzheimer’s disease gene expressions and geophysical fields for prospecting underground caves. This approach is a general non-linear feature generation and can be used in problems not necessarily oriented to the construction of visual data representations.
I. INTRODUCTION
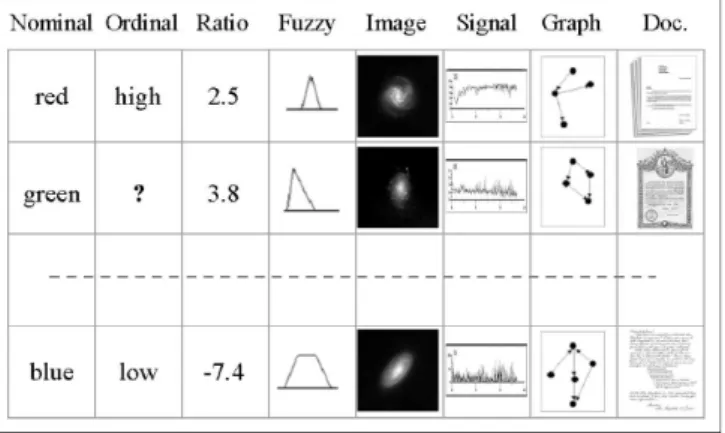
The role of visualization techniques in the knowledge discovery process is well known. The increasing complexity of the data analysis procedures makes it more difficult for the user to extract useful information out of the results generated by the various techniques. This makes graphical representation directly appealing. Data and patterns should be considered in a broad sense. There are different kinds of data (relational, graphical, symbolic, etc.). An example of a heterogeneous database is shown in Fig. 1. The increasing rates of data generation require the development of proce-dures facilitating the understanding of the structure of this kind of data more rapidly and intuitively.
Virtual Reality (VR) is a suitable paradigm for visual data mining. It is flexible: allows the choice of different ways how to represent the objects according to the differences in human perception. VR allows immersion: the user can navigate inside the data and interact with the objects in the world. It creates a living experience: the user is a passive observer, but an actor in the world. VR is broad and deep: the user may see the VR world as a whole, or concentrate on details. Very important is that its use does not require any special background. A virtual reality technique for visual
Julio J. Vald´es is with the National Research Council Canada, Institute for Information Technology, 1200 Montreal Rd, M50, Ottawa, ON K1A 0R6, Canada (phone: 613-993-0887; fax: 613-993-0215; email: [email protected]).
Alan J. Barton is with the National Research Council Canada, Institute for Information Technology, 1200 Montreal Rd, M50, Ottawa, ON K1A 0R6, Canada (phone: 613-991-5486; fax: 613-993-0215; email: [email protected]).
Fig. 1. An example of a heterogeneous database. Nominal, ordinal, ratio, fuzzy, image, signal, graph, and document data are mixed. The symbol? denotes a missing value.
data mining on heterogeneous, imprecise and incomplete information systems was introduced in [17], [18].
One of the steps in the construction of a VR space for data representation is the transformation of the original set of attributes describing the objects under study, often defining a heterogeneous high dimensional space, into another space of small dimension (typically 2-4) with intuitive metric (e.g. Euclidean). The operation usually involves a non-linear transformation; implying some information loss. There are basically two kinds of spaces sought: i) spaces preserving the structure of the objects as determined by the original set of attributes, and ii) spaces preserving the distribution of an existing class defined over the set of objects. Since in many cases the set of descriptor attributes does not necessarily relate well with the decision attribute, both types of spaces are usually conflicting. Moreover, they are created by different non-linear transformations. This situation creates confusion, because the same set of objects has a different distribution and different properties in two separate spaces. It would be better to construct spaces where several criteria could be simultaneously covered and with a unique metric.
This paper explores the construction of VR spaces for visual data mining using multi-objective optimization based on genetic algorithms (MOGA) and implicit and explicit function representations. This approach provides solutions for the previously discussed problems and the possibility of obtaining sets of spaces in which several properties (objectives) are expressed in different degrees. This strategy
is a conceptual improvement w.r.t. computing spaces using single-objective optimization algorithms in which the objec-tive function is a weighted composition of different criteria. The possibility of computing either implicit or explicit map-pings based on the same principles adds flexibility and the possibility of choosing the mapping strategy best suited for the type of problem and data.
This approach is illustrated with two real world problems: the representation of a very high dimensional genomics dataset (Alzheimer’s disease gene expressions), and the study of the effectiveness of a given set of geophysical fields in detecting the presence of underground caves.
II. VIRTUALREALITYREPRESENTATION OF
RELATIONALSTRUCTURES
A visual, data mining technique based on virtual reality oriented to general relational structures was introduced in [17], [18], (see also http://www. hybridstrategies.com). It is oriented to the under-standing of large heterogeneous, incomplete and imprecise data, as well as symbolic knowledge. The notion of data is not restricted to databases, but includes logical relations and other forms of both structured and non-structured knowledge. Different information sources are associated with the at-tributes, relations and functions. They are described by the so called source sets (Ψi), constructed according to the nature
of the information to represent. Source sets also account for incomplete information.
Definition 1: A heterogeneous domain [19] is a Cartesian product of a collection of source sets: ˆHn= Ψ
1× · · · × Ψn
, where n > 0 is the number of information sources to consider. For example, in a domain where objects are described by continuous crisp quantities, discrete features, fuzzy features, time-series, images, and graphs, they can be represented as Cartesian products of subsets of real numbers( ˆR), nominal ( ˆN ) or ordinal sets( ˆO), fuzzy sets( ˆF ), sets of images ( ˆI), sets of time series ( ˆS) and sets of graphs ( ˆG), respectively (all extended to allow missing values, indicated by
ˆ
). The heterogeneous domain is ˆHn = ˆNnN׈
OnO × ˆRnR× ˆFnF × ˆInI × ˆSnS × ˆGnG
, where nN is the
number of nominal sets,nOof ordinal sets,nRof real-valued
sets , nF of fuzzy sets , nI of image-valued sets, nS of
time-series sets, and nG of graph-valued sets, respectively
(n = nN + nO+ nR+ nF+ nI+ nS+ nG).
Definition 2: A virtual reality space is the tuple Υ =< O, G, B, ℜm, g
o, l, gr, b, r >, where O is a relational
structure (O =< O, Γv >, O is a finite set of objects, and
Γv
is a set of relations); G is a non-empty set of geometries representing the different objects and relations; B is a non-empty set of behaviors of the objects in the virtual world; ℜm⊂
R
m
is a metric space of dimension m (euclidean or not) which will be the actual virtual reality geometric space. The other elements are mappings:go: O → G, l : O → ℜm,
gr: Γv→ G, b : O → B.
A. A Taxonomy of the Virtual Reality Spaces
If the objects are in a heterogeneous space,l : ˆHn→ ℜm
. Several desiderata can be considered for building a trans-formed space either for constructing visual representations or as new generated features for pattern recognition purposes. The property which the objects in the space must satisfy, the mapping can be:
• Unsupervised: The location of the objects in the space
should preserve some structural property of the data, dependent only on the set of descriptor attributes. Any class information is ignored. The space sought should have minimal distortion.
• Supervised: The goal is to produce a space where the
objects are maximally discriminated w.r.t. a class distri-bution. The preservation of any structural property of the data is ignored, and the space can be distorted as much as required in order to maximize class discrimination.
• Mixed: A space compromising the two goals is sought.
Some amount of distortion is allowed in order to exhibit class differentiation and the object distribution should retain in a degree the structural property defined by the descriptor attributes. Very often these two goals are conflicting.
From the point of view of their mathematical nature, the mappings can be:
• Implicit: the images of the transformed objects are
computed directly and the algorithm does not provide a function representation.
• Explicit: the function performing the mapping is found
by the procedure and the images of the objects are obtained by applying the function. Two sub-types are:
– analytical functions: for example, as an algebraic representation.
– general function approximators: for example, as neural networks, fuzzy systems, or others.
Explicit mappings can be constructed in the form of analytical functions (e.g. via genetic programming), or us-ing general function approximators like neural networks or fuzzy systems. An explicit l is useful for both practical and theoretical reasons. On one hand, in dynamic data sets (e.g. systems being monitored or incremental data bases) an explicit transform l will speed up the update of the VR information space. On the other hand, it can give semantics to the attributes of the VR space, thus acting as a general dimensionality reducer.
B. The unsupervised perspective: Structure preservation
Data structure is one of the most important elements to consider and this is the case when the location and adjacency relationships between the objects O in Υ should give an indication of the similarity relationships [3], [1] between the objects in ˆHn
, as given by the set of original attributes [19]. l can be constructed to maximize some metric/non-metric structure preservation criteria as has been done for decades in multidimensional scaling [12], [1], or to minimize some error measure of information loss [15]. Ifδijis a dissimilarity
measure between any two i, j ∈ U (i, j ∈ [1, N ], where N is the number of objects), and ζivjv is another dissimilarity
measure defined on objects iv, jv ∈ O from Υ (iv =
ξ(i), jv= ξ(j), examples of error measures frequently used
are: S stress = sP i<j(δ2ij− ζij2)2 P i<jδ4ij , (1) Sammon error = P 1 i<jδij P i<j(δij− ζij)2 δij (2) Quadratic Loss = X i<j (δij− ζij)2 (3)
Classical algorithms have been used for directly opti-mizing these measures, like Steepest descent, Conjugate gradient, Fletcher-Reeves, Powell, Levenberg-Marquardt, and others. The number of different similarity, dissimilarity and distance functions definable for the different kinds of source sets is immense. Moreover, similarities and distances can be transformed into dissimilarities according to a wide variety of schemes, thus providing a rich framework. In particular, for heterogeneous data involving mixtures of nominal and ratio variables, the Gower similarity measure [9] has proven to be suitable. This similarity between objects i and j is given by
Sij = p X k=1 sijk/ p X k=1 wijk (4)
Ifvk(i), vk(j) are the values of attribute k for objects i and j
respectively, an invalid comparison occurs when at least one them is missing. For quantitative attributes, the scores sijk
are assigned as sijk = 1 − |vk(i) − vk(j)|/Rk, where Rk
is the range of attribute k. For nominal attributes sijk = 1
if vk(i) = vk(j), and 0 otherwise. The weight (wijk) of the
attributek is set equal to 0 if the comparison is invalid or 1 otherwise .
If Eqs-1-2-3 are optimized by setting the collection of coordinates in the new space as the unknowns of the error measures the l mappings are implicit, as functional repre-sentations are not obtained. When 3D spaces with Euclidean metric are targeted, the genetic algorithms can use linear real-valued chromosomes . Their length is set toN · M where N is the number of objects and M the dimension of the new space (Fig. 2). Thus, each chromosome represents the result of an implicit mapping l : ℜN → ℜM.
C. The supervised perspective: Class Separability
In the supervised case, a natural choice for representing the l mapping is a non-linear discriminant analysis neural net-work (NDA) [23], [11]. One strong reason is that classes are often either only separable with nonlinear boundaries, or not separable at all. Another is the generalization capability of neural networks which allows the placement of new unseen objects. When learning the mapping the neural network last hidden layer creates new nonlinear features for the mapped objects, such that they are separated into classes by the output
Fig. 2. Chromosome representation for the multi-objective optimization.
layer. These nonlinear features could be used independently by other data mining algorithms. The typical architecture of such networks is shown in Fig. 3.
Fig. 3. Feed forward neural network for 2-objective optimization. ~xiis an input pattern to the network, ciis the network-predicted class membership of the input vector as coded by the output network layer and ~xt
iis the output of the last hidden layer, representing a transformation of the input vector into another space.
The number of input nodes is set to the number of features of the data objects, and the number of neurons in the output layer to be the number of pattern classes, whereas the number of neurons in the last hidden layer (m) is the dimensionality of the new space. Since the classical approach to building NDA networks suffers from the known problem of local extrema entrapment, the construction of NDA networks can be done by using hybrid stochastic-deterministic feed for-ward networks where training is based on a combination
of simulated annealing with conjugate gradient [13] [21]. Alternatively, networks based on evolutionary algorithms can use, for instance, genetic algorithms, or particle swarm opti-mization combined with classical optiopti-mization techniques as proposed in [20].
D. The multi-objective approach: A hybrid perspective
The relationship between the original descriptor variables and the class membership may be partial, or poor. Thus, a space that satisfactorily preserves the similarity structure does not necessarily maximize class separability. If classi-fication is all that matters, then it can be achieved at the cost of distorting the space much more than another one compliant with the similarity structure. In so doing, the kind and amount of nonlinearity and distortion introduced may be so large that the data distribution in the two spaces may bear no resemblance at all. These two goals are usually in conflict and multi-objective optimization can bring a new perspective to the problem. In a first approximation, the minimization of a measure of similarity information loss between the original and the transformed spaces and a classification error measure over the objects in the new space can be used as objectives. More requirements can be imposed on the solution by adding the corresponding objective functions. This paper will con-sider the use of only two criteria: Sammon’s error (Eq-2) for the unsupervised case and mean cross-validated classification error with a k-nearest neighbour pattern recognizer for the supervised case using Euclidean distance.
III. MULTI-OBJECTIVEOPTIMIZATION
USINGGENETICALGORITHMS
An evolutionary algorithm constructs a population of in-dividuals, which evolve through time until stopping criteria is satisfied. At any particular time, the current population of individuals represent the current solutions to the input prob-lem, with the final population representing the algorithm’s resulting output solutions.
An enhancement to the traditional evolutionary algorithm, is to allow an individual to have more than one measure of fitness within a population. One way in which such an enhancement may be applied, is through the use of, for example, a weighted sum of more than one fitness value [2]. MOGA, however, offers another possible way for enabling such an enhancement. In the latter case, the problem arises for the evolutionary algorithm to select individuals for inclusion in the next population because a set of individuals contained in one population exhibits an approximation to a Pareto Front [14] – hereafter called the locus of the non-dominated solutions (LNDS) – of best current individuals, rather than a single best individual. Most [2] multi-objective algorithms use the concept of dominance.
A solution↼x(1) is said to dominate [2] a solution
↼
x(2) for
a set ofm objective functions < f1(
↼ x), f2( ↼ x), ..., fm( ↼ x) > if
1) ↼x(1) is not worse than
↼
x(2) over all objectives.
For example, f3( ↼ x(1)) ≤ f3( ↼ x(2)) if f3( ↼ x) is a minimization objective.
2) ↼x(1)is strictly better than
↼
x(2)in at least one objective.
For example, f6( ↼ x(1)) > f6( ↼ x(2)) if f6( ↼ x) is a maximization objective.
One particular algorithm for MOGA is the elitist non-dominated sorting genetic algorithm (NSGA-II) [4], [5], [6], [2]. It has the features that it i) uses elitism, ii) uses an explicit diversity preserving mechanism, and iii) emphasizes the non-dominated solutions. The procedure is as follows: i) Create the child population using the usual genetic algorithm operations. ii) Combine parent and child populations into a merged population. iii) Sort the merged population according to the non-domination principle. iv) Identify a set of fronts in the merged population (Fi, i = 1, 2, ...). v) Add all complete
fronts Fi, for i = 1, 2, ..., k − 1 to the next population. vi)
There may now be a front, Fk, that does not completely
fit into the next population. So select individuals that are maximally separated from each other from the front Fk
according to a crowding distance operator. vii) The next population has now been constructed, so continue with the genetic algorithm operations.
IV. A MULTI-OBJECTIVEIMPLICITMAPPINGEXAMPLE
This approach is illustrated with gene expression data from a genomic research on Alzheimer’s disease. Alzheimer’s disease (AD) is an incurable chronic, progressive, debili-tating condition which, along with other neurodegenerative diseases, represents the largest area of unmet need in modern medicine. A total of 12 samples from clinically diagnosed AD patients and 11 from ”normal” patients of similar age were used in this study. Each sample is characterized by a 9600 attributes describing expression intensities of a corre-sponding number of genes [22]. Clearly, direct inspection of the structure of this 9600-dimensional data, and of the relationship between the descriptor variables (the genes) and the class (Normal or Alzheimer), is impossible. The need for a visual representation respecting at the same time the object interrelationships as defined by the 9600 genes and the class differentiation, makes this problem suitable for a MOGA approach. The collection of parameters describing the application of the NSGA-II algorithm is shown in Table-I. A modest population size and number of generations were used, with a relatively high mutation probability in order to enable richer genetic diversity. Randomization of the set of data objects was applied in order to reduce the bias in the composition of the cross-validated folds by providing a more even class distribution between successive training and test subsets. The number of folds was set in consideration of the sample size.
The set of non-dominated solutions obtained by the NSGA-II algorithm is shown in the scatter plot of Fig. 4, where the horizontal axis is the mean cross-validated knn error and the vertical axis the Sammon error. The approx-imate location of the Pareto front is defined by the convex polygon joining the solutions provided by chromosomes 0, 3, 2, 4, 1 (Table-II). Chromosome 0 defines a space with a perfect resolution of the supervised problem in terms of the
TABLE I
EXPERIMENTAL SETTINGS FOR COMPUTING THE PARETO-OPTIMAL SOLUTIONS BY THEMOGA.
population size 100 number of generations 200 chromosome length 69
ga seed 4001
objective functions should be minimized chromosome data representation real crossover probability 0.8
crossover type uniform (prob. 0.6) mutation probability 0.4
mutation type gaussian selection type tournament tournament probability 0.6 perform mutation and crossover yes
population initialization random, bounded lower bound for initialization 0
upper bound for initialization 7
fitness values raw objective values stopping criteria maximum iterations restart ga during execution no
number of objectives 2 number of constraints 0
pre-computed diss. matrix Gower dissimilarity evaluation functions mean cross-validated error
Sammon error cross-validation (c.v.) 5 folds randomize before c.v. yes
knn seed -101
k nearest neighbors 3 non-linear mapping measure Sammon dimension of the new space 3
Normal and Alzheimer classes (knn error= 0), but at the cost of a severe distortion of the space. Whereas, chromosome 1 approximates a pure unsupervised solution (with low Sammon error). Its classification error is large indicating that few non-linear features preserving the similarity structure lacks classification power. This may be due to the large amount of attribute noise, redundancy, and irrelevancy within the set of9600 original genes.
TABLE II
SELECTEDMULTI-OBJECTIVESOLUTIONS
multi-objective mean cross-validation Sammon error GA solution k-nn error chromosome 0 0.0000 1.1712 chromosome 3 0.0500 0.8900 chromosome 2 0.0800 0.6924 chromosome 4 0.1700 0.5480 chromosome 1 0.3100 0.4926
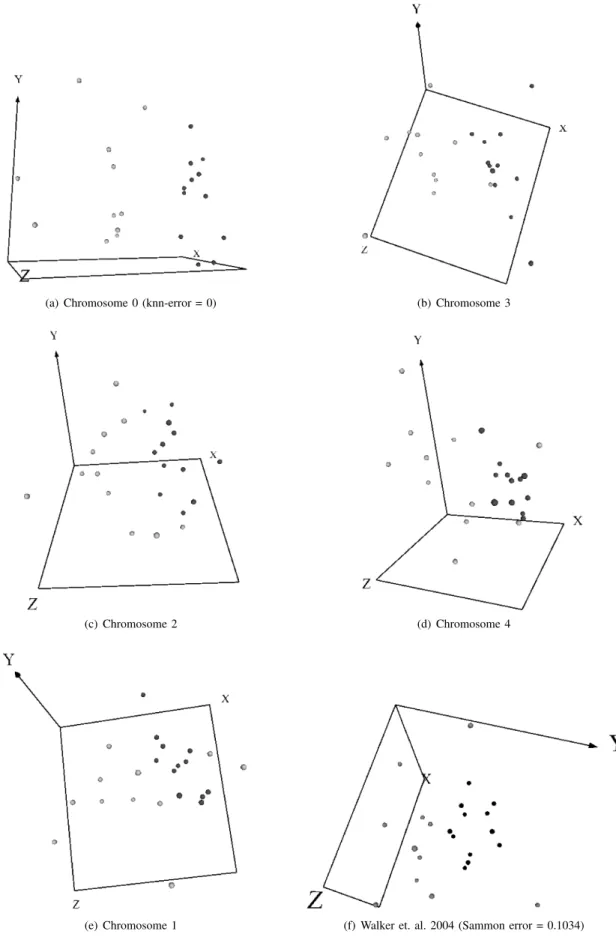
Clearly, it is impossible to represent virtual reality spaces on a static medium. However, a composition of snapshots of the VR spaces using the solutions along the LNDS is shown in Fig. 5.a-5.e. For comparison Fig. 5.f corresponds to an unsupervised single-objective solution obtained with deterministic optimization (Newton’s method) using Sam-mon’s error (Eq-2), Gower’s similarity in the original space (Eq-4), and normalized Euclidean metric in the new space was obtained in [22]. The error obtained was 0.1034 after 335 iterations. This error is much better than the equivalent
Fig. 4. Different solutions along the LNDS progressively spanning the extremes given by minimum classification error, and minimum dissimilarity loss. The errors corresponding to the two objective functions are shown in parenthesis.
MOGA result (error =0.49), obtained with a reduced number of generations a small population size, which considerably reduces the search space. However, the space defined by chromosome 1 (Fig. 5.e) captures most of the features of the purely unsupervised solution obtained with deterministic methods and a much larger number of iterations. This in-dicates the potential room for improvement of the MOGA results. Chromosome 2, according to Fig. 4 and Fig. 5.c, can be considered to be the best MOGA compromised solution in which both error criteria are simultaneously as low as possible. It shows a reasonable class discrimination with a non-large similarity structure distortion, which is a very meaningful result.
V. A MULTI-OBJECTIVEEXPLICITMAPPINGEXAMPLE
Here a explicit representation in the form of a neural network will be constructed, although from a MOGA per-spective. The output of the neural network is used for obtaining a classification, and the output of the last hidden layer is used for computing Sammon error (Fig. 3).
This approach was applied to geophysical data in an investigation about the detection of underground caves. Sometimes they are opened to the surface, but typically they are buried, requiring the use of geophysical methods. Cave detection is a very important problem in civil and geological engineering. The studied area contained an accessible cave and geophysical methods complemented with a topographic survey were used with the purpose of finding their relation with subsurface phenomena [16]. This is a problem with
partially defined classes: the existance of a cave beneath a measurement station is either known for sure or unknown (i.e. only one class membership is defined).
The set of geophysical methods included 1) the sponta-neous electric potential (SP) at the earths surface measured in the dry season, 2) the vertical component of the electro-magnetic field in the very low frequency region of the
electromagnetic spectrum, 3) the SP in the rainy season, 4) the gamma radioactive intensity and 2) the local topography. In order to eliminate the data distortion introduced by the different units of measure for the physical fields, to reduce the influence of noise and regional geological struc-tures a data preprocessing process was performed con-sisting of several steps: i) conversion of each physical field to standard scores. ii) each physical field f was modeled as composed of a trend, a signal and additive noise: f (x, y) = t(x, y) + s(x, y) + n(x, y) where t is the trend, s is the signal, and n is the noise component.
iii) a least squares linear trend ˆt(x, y) = c0 + c1x +
c2y , was estimated, and a residual obtained: ˆr(x, y) =
f (x, y) − ˆt(x, y). The residual was convolved with a low pass two-dimensional filter to attenuate the noise component: ˆ
s(x, y) = PN
k1=−N
PN
k2=−Nh(k1, k2)ˆr(x − k1, y − k2),
where ˆr(x, y) is the residual, ˆs(x, y) is the signal approxi-mation, andh(k1, k2) is the low-pass zero-phase shift digital
filter. The filtered residuals fields were clustered using the leader algorithm [10] and the parameters shown in Table-III. As a result,648 leaders (cluster representatives) were found from the 1225 original objects. They retain most of the original similarity structure because of the high threshold value.
TABLE III
EXPERIMENTAL SETTINGS FORi)THE INPUT DATAii)THE LEADER ALGORITHM, iii)THE EVOLUTIONARY MULTI-OBJECTIVE OPTIMIZATION ALGORITHM(NSGA-II),ANDiv)THE OBJECTIVE FUNCTIONS(E.G.THE
NON-LINEAR DISCRIMINANT ANALYSIS).
Number of attributes 5 Number of objects 1225 Leader Algorithm variant: closest Similarity Gower Similarity Threshold 0.97 Number of Leaders 648 Population Size 400 Max. No. Iterations 2000
Chromosome Length Determined by NN layout
Seed Exp-1:816, 523
Exp-2:325, 617 Exp-3:192, 893 Probability of Crossover 0.8
Probability of Mutation 0.4
Optimization Direction Minimize (for all objectives) Crossover Type Uniform, prob.= 0.6 Mutation Type Gaussian
Selection Tournament, prob.= 0.6 Mutation and crossover yes
Initialization bounds [−100, 100] per allele Fitness Type Raw
Stopping Rule After max. iterations
Restart GA No
2 Objectives Classification Error and Sammon Error
Network Layout 1 hidden layer (3 neurons) output layer (2 neurons) Activation Functions tanh for both layers NN Output Threshold 0
A series of MOGA experiments were performed. The experimental settings are shown in Table-III, which comprise
a description of the data, the leader algorithm options, the MOGA options, and the two objective function parameters, including the parameters used for non-linear discriminant analysis.
Each MOGA experiment generate approximately 10 dis-tinct multi-criteria solutions, which lead to a total of approx-imately 30 distinct solutions for the multi-criteria problem. Fig. 6 shows the solutions and the resulting LNDS.
Fig. 6. Different multi-objective solutions for the geophysical prospecting example, with an approximation to the Pareto front.
Three solutions were selected from Fig. 6 that represent the two extremes and a compromise of these two objectives. These selections were then each visualized by constructing a 3-dimensional VR space from the hidden layer of the neural network solutions as shown in Fig. 7. The representation at the top in Fig. 7 shows the best MOGA Sammon error solution, with the property of preserving data structure. While the bottom representation shows the best MOGA classification error solution; a space in which objects should be maximally separated in terms of their class membership (cave or unknown). The middle representation demonstrates a MOGA compromised solution exhibiting intermediate prop-erties of the two extreme solutions.
VI. CONCLUSIONS
MOGA was applied to the computation of virtual reality spaces for visual data mining, using implicit and explicit function representations. In both cases MOGA solutions range from purely unsupervised solutions to purely super-vised, providing a variety of spaces s.t. each one fulfills these properties in different degree within a single metric. Implicit solutions are more suitable when the number of objects is reduced, the number of attributes is large and only the visualization of a single sample is needed. When the number of objects is large, the number of attributes not so large and new objects besides those covered by the sample are expected, explicit solutions are appropriate. The effectiveness of a MOGA approach was shown with examples from genomics and geophysical prospecting. A more thorough experimental study of this approach is necessary across other domains in order to assess the technique’s general behaviour.
Fig. 7. Selected MOGA solutions. Top: best Sammon error solution. Mid-dle: Solution compromising both error measures. Bottom: best classificaton error solution. Dark objects represent measuring stations over the known surveyed cave location. Light objects represent measuring stations where the existance of a cave is unknown.
ACKNOWLEDGMENT
The authors would like to thank Robert Orchard from the Integrated Reasoning Group (National Research Council Canada, Institute for Information Technology) for his con-structive criticism of the first draft of this paper.
REFERENCES
[1] I. Borg and J. Lingoes, Multidimensional similarity structure analysis. Springer-Verlag, 1987.
[2] E. K. Burke and G. Kendall, Search Methodologies: Introductory
Tutorials in Optimization and Decision Support Techniques. Springer Science and Business Media, Inc. New York, 2005.
[3] J. L. Chandon and S. Pinson. Analyse typologique. Th´eorie et
applica-tions. Masson, Paris, 1981.
[4] K. Deb, A. Pratap, S. Agarwal, and T. Meyarivan, “A fast and elitist multi-objective genetic algorithm: Nsga-ii,” Technical Report 2000001,
Kanpur Genetic Algorithms Laboratory(KanGAL), Indian Institute of Technology Kanpur, 2000.
[5] K. Deb, S. Agarwal, A. Pratap, and T. Meyarivan, “A fast elitist non-dominated sorting genetic algorithm for multi-objective optimization: Nsga-ii,” Proceedings of the Parallel Problem Solving from Nature VI
Conference, pp. 849–858, Paris, France, 16-20 September 2000. [6] K. Deb, S. Agarwal, and T. Meyarivan, “A fast and elitist multi-objective
genetic algorithm: Nsga-ii,” IEEE Transaction on Evolutionary
Compu-tation, vol. 6 (2), pp. 181–197, 2002.
[7] R. O. Duda and P. E. Hart, Pattern Classification and Scene Analysis. Wiley New York, 1972.
[8] K. Fukunaga, Introduction to Statistical Pattern Recognition. Academic Press, 1972.
[9] J. C. Gower, “A general coefficient of similarity and some of its properties,” Biometrics, vol.1 no.27, pp.857–871, 1971.
[10] J. Hartigan, Clustering Algorithms. John Wiley & Sons, 1975. [11] A. K. Jain and J. Mao, “Artificial neural networks for nonlinear
projection of multivariate data,” 1992 IEEE joint Conf. on Neural
Networks, pp. 335–340, Baltimore, MD, 1992.
[12] J. Kruskal, “Multidimensional scaling by optimizing goodness of fit to a nonmetric hypothesis,” Psichometrika, vol. 29 pp.1–27, 1964. [13] T. Masters. Advanced Algorithms for Neural Networks. John Wiley &
Sons, 1993.
[14] V. Pareto, Cours D’Economie Politique, volume I and II. F. Rouge, Lausanne, 1896.
[15] J. W. Sammon, “A non-linear mapping for data structure analysis,”
IEEE Trans. Computers, C18 pp.401–408, 1969.
[16] J. J. Vald´es, J. L.Gil J.L, “Application of geophysical and geomathe-matical methods in the study of the Insunza karstic area (La Salud, La Habana),” Proceedings of the First International Colloquium of
Physical-Chemistry and Karst Hydrogeology in the Caribbean Region, UNESCO, La Habana, pp. 376-384, 1982.
[17] J. J. Vald´es, “Virtual reality representation of relational systems and decision rules,” In P. Hajek, editor, Theory and Application of Relational
Structures as Knowledge Instruments, Meeting of the COST Action 274. Prague, Nov 2002.
[18] J. J. Vald´es, “Virtual reality representation of information systems and decision rules,” Lecture Notes in Artificial Intelligence, vol. 2639 LNAI, pp. 615–618. Springer-Verlag, 2003.
[19] J. J. Vald´es, “Similarity-based heterogeneous neurons in the context of general observational models,” Neural Network World, vol. 12(5) pp. 499–508, 2002.
[20] J. Vald´es, “Building virtual reality spaces for visual data mining with hybrid evolutionary-classical optimization: Application to microarray gene expression data,” 2004 IASTED International Joint Conference
on Artificial Intelligence and Soft Computing, ASC’2004, pp. 161–166, Marbella, Spain, Sept 2004. ACTA Press, Anaheim, USA.
[21] J. J. Vald´es, A.J. Barton, “Virtual Reality Visual Data Mining with Nonlinear Discriminant Neural Networks: Application to Leukemia and Alzheimer Gene Expression Data,” Proceedings of the IJCNN’05
International Joint Conference on Neural Networks. July 31-August 4, 2005, Montreal, Canada
[22] P. Walker, B. Smith, Y. Qing, F. Famili, J. J. Vald´es, L. Ziying, and L. Boleslaw, “Data mining of gene expression changes in alzheimer brain,” Artificial Intelligence in Medicine, vol. 31, pp.137–154, 2004. [23] A. R. Webb and D. Lowe, “The optimized internal representation of
(a) Chromosome 0 (knn-error = 0) (b) Chromosome 3
(c) Chromosome 2 (d) Chromosome 4
(e) Chromosome 1 (f) Walker et. al. 2004 (Sammon error = 0.1034)
Fig. 5. Snapshots of vr-spaces computed with different solutions along the LNDS progressively spanning the extremes given by minimum classification error, and minimum dissimilarity loss. Light spheres = normal samples, dark spheres = Alzheimer samples.