Publisher’s version / Version de l'éditeur:
IceTech '11, 2014
READ THESE TERMS AND CONDITIONS CAREFULLY BEFORE USING THIS WEBSITE. https://nrc-publications.canada.ca/eng/copyright
Vous avez des questions? Nous pouvons vous aider. Pour communiquer directement avec un auteur, consultez la
première page de la revue dans laquelle son article a été publié afin de trouver ses coordonnées. Si vous n’arrivez pas à les repérer, communiquez avec nous à PublicationsArchive-ArchivesPublications@nrc-cnrc.gc.ca.
Questions? Contact the NRC Publications Archive team at
PublicationsArchive-ArchivesPublications@nrc-cnrc.gc.ca. If you wish to email the authors directly, please see the first page of the publication for their contact information.
NRC Publications Archive
Archives des publications du CNRC
This publication could be one of several versions: author’s original, accepted manuscript or the publisher’s version. / La version de cette publication peut être l’une des suivantes : la version prépublication de l’auteur, la version acceptée du manuscrit ou la version de l’éditeur.
Access and use of this website and the material on it are subject to the Terms and Conditions set forth at
Updated temperature, salinity and strength distributions for old ice
Johnston, M.; Frederking, R.
https://publications-cnrc.canada.ca/fra/droits
L’accès à ce site Web et l’utilisation de son contenu sont assujettis aux conditions présentées dans le site LISEZ CES CONDITIONS ATTENTIVEMENT AVANT D’UTILISER CE SITE WEB.
NRC Publications Record / Notice d'Archives des publications de CNRC:
https://nrc-publications.canada.ca/eng/view/object/?id=94a371a7-ff32-4870-8d4e-cec940874a80
https://publications-cnrc.canada.ca/fra/voir/objet/?id=94a371a7-ff32-4870-8d4e-cec940874a80
Updated Temperature, Salinity and Strength Distributions for Old Ice
M. Johnston and R. Frederking
National Research Council of Canada (NRC) - Ocean, Coastal and River Engineering (OCRE) Ottawa, ON, Canada
michelle.johnston@nrc-cnrc.gc.ca
ABSTRACT
This paper presents updated distributions of the temperatures, salinities and borehole strengths of old ice, as a function of time of year. Thousands of measurements are compiled from old ice floes across the Arctic. Probability of exceedance curves are used to show the more ‘extreme’ values that can occur at various depths in the ice, whereas properties over the full ice thickness are obtained from (i) the means of populations and (ii) by depth-averaging measurements from the same borehole. Ice temperature and borehole strength show strong seasonal variability (temperature and borehole strength being inversely proportional), whereas the mean salinity of old ice varies little over the course of a year (on average, 1.8‰ for all months). The compilation showed that temperatures colder than approximately -34°C have not been measured in old ice in the marine environment during the three coldest months of the year. Borehole strengths upwards of 40MPa have been measured at various depths in old ice. Since such cold temperatures (-34°C) and high strengths (40MPa) are not representative of the full thickness of old ice, particular attention is paid to the range of depth-averaged ice temperatures spanning all months (0 to -20°C). Flexural strengths calculated from the Timco and O’Brien equation (for old ice having a mean salinity of 1.8‰ – which incidentally is also the mean bulk salinity of old ice from the data compilation – are comparable to the limited number of flexural strengths measurements from multi-year ice specimens. Normalized values of mean borehole strength and calculated flexural strength (for 1.8‰ ice) exhibit similar trends of decreasing strength with increasing ice temperature however, the Timco and O’Brien equation tends to underestimate the flexural strength of old ice near the melting point (ice temperatures warmer than -3°C). That, coupled with the relatively constant bulk salinity of old ice throughout the year, suggests that brine volume plays a lesser role in the deterioration of old ice than first-year ice. As a rough rule of thumb, the mean depth-averaged strength of old ice with a bulk ice temperature of -10°C, -5°C and 0°C decreases to respectively ~85%, 70% and 30%, relative to its maximum winter strength (-20°C ice temperature). On average, the mean, depth-averaged borehole strength of old ice is 30 times higher than the calculated flexural strength of 1.8‰ old ice, over the ice temperature range -1°C to -20°C. Caution should be exercised when applying results in this paper, given the considerable variability in old ice strength with temperature.
KEY WORDS:
old ice; ice temperature; salinity; borehole strength; flexural strength; probability of exceedance.
INTRODUCTION
Multi-year ice is one of the most significant design and operational concerns for future exploration, development and shipping systems in the Beaufort Sea. There are many unknowns surrounding multi-year ice – the lack of information about its thickness and physical properties being the most critical. Johnston et al. (2009) address multi-year ice thickness by compiling on-ice thickness measurements from multi-year floes sampled Arctic-wide, over the past 50 years. Here, a companion study of the temperature, salinity and strength (borehole and flexural) of old ice floes is presented. The companion studies of multi-year ice thickness (Johnston et al., 2009) and old ice properties (this paper) will produce more reliable statistical distributions of old ice properties (for input into probabilistic load models) and improved force calculations from equations such as those in ISO 19906. For example, ISO 19906 states that an ‘ice strength parameter’ (CR) can be used to calculate
global average pressures. CR values of 2.8 and 1.8 are given for ice in
arctic and sub-arctic areas, respectively. ISO allows for CR to be
modified, should evidence exist that ice strength in the region of interest differs from the values specified above. That evidence should be based on actual ice strength measurements or information about the thickness, temperature and salinity of the ice–which are addressed here.
WHAT EXACTLY, IS OLD ICE?
Old ice is defined as ‘sea ice that has survived one or more melt seasons’ (WMO, 1985), hence includes both second-year ice and multi-year ice. Second-multi-year ice has survived one summer’s melt season and is up to 2.5m thick, sometimes more. Multi-year ice has survived at least two summer melt seasons and can be 3m thick, or more. It is important to distinguish between second-year and multi-year ice because they have different material properties, but often the distinction cannot be made reliably (Johnston and Timco, 2008). This paper draws upon the temperatures, salinities and strengths of old ice so, in principle, differentiating second-year ice from multi-year ice should be easier than using ice thickness measurements alone. But, still, the non-uniformity of multi-year makes the distinction challenging. ‘Age-related’ and ‘deformation-‘Age-related’ effects contribute to the variability of old ice, in space and time. Age-related effects can sometimes be seen as annual layers of ice growth in vertical thin sections of ice, in springtime. Bjerkelund et al. (1984) use that technique to show the clear boundary between ‘two-year old ice’ and ‘one-year old ice’ in bona fide second-year ice. Multi-year ice also has annual growth layers, but the boundaries are less evident due to years of ice
desalination and ice ablation. Deformation-related effects complicate the matter further. As old ice floes grind against other floes or the coastline, they become a heterogeneous mixture of weathered, jumbled ice blocks that, over time, consolidate to varying degrees. The non-uniformity of second-year and multi-year ice floes, and the need to define the floe’s properties over its full thickness, make ‘old ice’ an apt description for the ice discussed here.
OLD ICE DATA INCLUDED IN THE COMPILATION
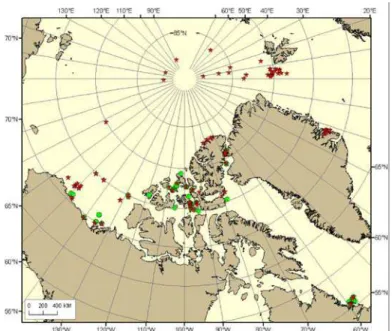
This paper is based upon the temperatures, salinities and densities of old ice (from 33 studies) and the borehole strengths of old ice (from 28 studies) measured from 1973 to 2013. These data were collected on level and deformed old ice floes across the Arctic and in the sub-Arctic (Fig. 1) in winter, spring, summer and fall (Fig. 2). Data were obtained from the open literature and the less accessible, grey literature.
Figure 1. Locations where old ice floes were sampled. Stars show floes where only temperature, salinity and/or density were measured; circles show where borehole strength tests were conducted in old ice floes. The complete suite of measurements was seldom made on every floe.
Ice Temperature: Compiled Data
Ice temperatures (n=4161) were obtained from ice cores and from in situ temperature chains that were frozen into the ice for an extended period. When multiple cores were obtained from the same floe, all of the temperatures were included in the compilation for that floe. Measurements from the temperature chains were included for every month that the temperature chain functioned, but only one sample per month was taken from each measurement depth (mid-month, either at early morning or midnight). Temperature chains account for ~80% (n=3312) of the temperatures reported in Fig. 2 and, in fact, they are the most common source of data below an ice depth of 6m. Five temperature chains were installed on old ice floes in the Beaufort Sea, four of which were instrumented during the SHEBA program (Perovich et al., 2003) and one by Gladwell (1977). Four temperature chains were installed on multi-year ice floes in the Canadian Arctic Archipelago and the eastern Arctic (Johnston, 2009; 2011). The remaining ~20% (n=849) of temperatures were obtained from extracted ice cores, most of which represent the uppermost 6m of ice. The compilation includes all of the studies to date on which temperatures have been measured over the full thickness of multi-year ice floes more than 10m thick (Gladwell (1977), Vaudrey (1981), Johnston (2009, 2011, 2014)).
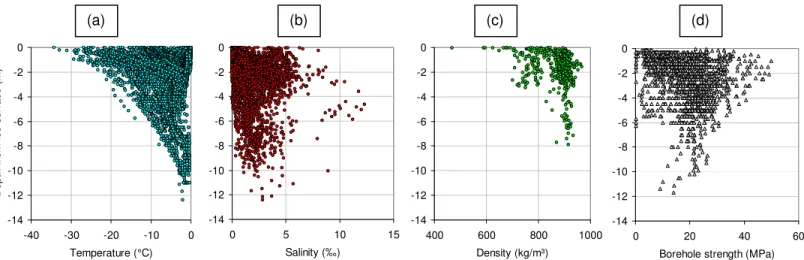
Ice temperatures were measured in all months, fewer measurements having been collected in winter than summer (Fig. 2). The plot of ice temperatures for all months and all depths (Fig. 3-a) shows that (i) the coldest temperature in the compilation (-34.3°C) was measured near the top ice surface, (ii) -10°C was the coldest temperature measured at the 6m ice depth and (iii) near melting temperatures were measured below a depth of 10m in the 7 thickest multi-year ice floes. The thickest ice in the data compilation was a 12.4m hummock (Johnston, 2011), but multi-year ice thicker than that occurs in most geographic regions (Johnston et al., 2009).
Ice Salinity: Compiled Data
All of the salinities in this compilation (n=4348) were measured on extracted ice cores. Old ice salinities have been collected most often in April, May and June; no salinity measurements exist from November to February (Fig. 2). More than half of the salinities for the month of June (829 of the 1252 measurements) come from the 10 multi-year ice floes that were sampled during the MV Arctic ramming trials (Lapp et al., 1984). The fine sampling interval (~20 to 30mm) used in that study is unusual; no other study of old ice salinity was resolved to such detail. Fig. 3-b shows the salinity of old ice to be variable with depth, there being no trend evident in the data. Typically the salinity of old ice is less than 5‰, but salinities up to 12.3‰ have been measured at certain depths in some floes.
0 500 1000 1500 1 2 3 4 5 6 7 8 9 10 11 12 Month N u m b e r o f o ld i ce sam p
les temperature (n = 4161)salinity (n = 4348)
density (n = 447)
borehole strength (n = 1441)
Figure 2. Histogram of months in which old ice properties were measured.
Ice Density: Compiled Data
Most of the old ice densities in this study (n=447) were measured in April, May, August and September (Fig 2) and range from 468 to 966kg/m³ (Fig. 3-c). The figure does not include the hundreds of ice densities that Cox et al. (1984; 1985) measured on carefully machined specimens of multi-year ice under the controlled conditions of a laboratory, but those results (653 to 918kg/m³) are comparable to the densities in Fig. 3-c. In this paper, relatively little consideration is given to ice density because measuring the density of small specimens of sea ice is challenging, extremely labour intensive (especially in the field) and, invariably, produces a great deal of scatter (Timco and Frederking, 1996). Accuracy is paramount however, since a 5% error in the ice density can produce errors of up to 60% in the volume fraction of gases calculated from Cox and Weeks’ (1983) equations (Shokr and Sinha, 1995), which is important for ice strength. In addition, relating the density and/or porosity of small ice specimens to the overall floe strength (i.e. through its full thickness) is problematic – particularly for the borehole strengths discussed in this paper. That is because, during a borehole strength test, the area of influence extends beyond ice adjacent to the borehole indentor (Masterson, 1996; Shkhinek et al., 2010). The bulk density of the ice has been proposed as a more relevant parameter for evaluating borehole strength (Johnston, 2014), but it is seldom available.
Ice Borehole Strength: Compiled Data
The borehole indentor system is recognized as a means for obtaining in situ ice strength (ISO, 2010). Typically, borehole strength tests are conducted at specified depths in a borehole until the full ice thickness has been penetrated or until the bottom of the borehole has been reached. The strengths measured at various depths in a borehole can be averaged to obtain the overall floe strength (i.e. depth-averaged strength). Often, boreholes extend only part-way through the ice thickness, which introduces uncertainty in using this approach to determine the ‘overall strength of a floe’, as shown later in the paper. The borehole strengths in this compilation (n=1441) come from the 79 old ice floes that have been sampled since 1973. Two borehole indentor systems have been used to measure the strength of old ice to date. Strengths from the two borehole systems are comparable, given the host of other factors that contribute to data scatter, including ice failure mechanisms (which govern the maximum pressure attained
during a borehole strength test), hydraulic pump capacity, test duration and the approach used to define a borehole strength (Johnston, 2014). Stress-rate effect plays a relatively minor role in the measured borehole ice strengths over the range of stress rates at which the tests are usually conducted (1.0 to 2.5MPa/s). Sinha (1985) also showed confinement to reduce the stress-rate effect on ice specimens [i.e. in a borehole, for the purposes of this paper].
Borehole strength tests have been conducted in all months except February (Fig. 2). Tests are most often performed in the uppermost 6m of ice, which is also where the highest strengths occur in old ice (up to 50MPa, Fig. 3-d). The highest strengths occur near the top ice surface, where the ice is coldest, and the lowest borehole strengths generally occur in the warmer bottom ice. There is limited confidence extrapolating strength measurements to ice thicker than 10m, since so few measurements have been made at that depth.
-14 -12 -10 -8 -6 -4 -2 0 0 20 40 6
Borehole strength (MPa)
D e pt h f ro m i c e s ur fac e ( m 0 ) -14 -12 -10 -8 -6 -4 -2 0 400 600 800 1000 Density (kg/m³) D e pt h f ro m i c e s ur fac e (m ) -14 -12 -10 -8 -6 -4 -2 0 0 5 10 15 Salinity (‰) D e pt h f ro m i c e s ur fac e (m )
(a)
(b)
(c)
(d)
-14 -12 -10 -8 -6 -4 -2 0 -40 -30 -20 -10 0 Temperature (°C) D ep th f rom i c e s u rf a c e (m )Figure 3. Temperature (a), salinity (b), density (c) and borehole strength (d) of old ice from January to December, all geographic regions.
PROBABILITY OF EXCEEDANCE AND MEANS
Old Ice Temperature
Representing the tail of the distribution by a probability of exceedance (POE) curve is a useful approach for placing bounds on the maximum and minimum property values that can be expected at any depth in old ice (i.e. the ‘extreme’ values). The POE is obtained by ranking the data in sequential order and plotting them against a probability, pe =
i/(n+1); where pe is the exceedance probability, i is the ith ranked data
point and n is the total number of data points. The pe=10
-² (POE 0.01) and pe=10-³ (POE 0.001) are commonly used for engineering
purposes. In this paper the POE curves are used to compare the properties of old ice in a general way, there being no physical basis for using the POE values to describe the properties of an old ice floe that can be expected every ‘100 years’ or ‘1000 years’.
Nearly 80% of the temperatures in the compilation come from the in situ temperature chains on 9 old ice floes, between latitudes 74°N and 80°N. The POE curves in Fig. 4-a are heavily weighted towards those floes. The coldest ice temperatures in the data compilation come from four floes instrumented during the 1997/98 SHEBA program (Perovich et al., 2003) and the 12.4m thick multi-year hummock that was instrumented in Belcher Channel, Nunavut in 2009/10 (Johnston, 2014). The month of January produced the coldest ice temperature (-34.3°C, Fig. 4-a) and the coldest air temperature (-37.4°C, not shown). It is recognized that the winter temperature data are weighted towards a small number of old ice floes, but including additional data would not alter the results considerably. That is because ice temperatures are moderated in winter by the overlying snow cover, which limits the depth to which (relatively short-lived) air temperatures colder than about -37°C can penetrate the ice. Note also that, although air temperatures over land can be much colder than -37°C, the warm ocean appears to moderate air temperatures in the offshore environment. Placing bounds on the coldest ice surface temperature that can be expected in the marine environment is useful for estimating the full thickness ice temperature in winter: ice with a -34.3°C top ice surface temperature and -1.8°C bottom ice surface temperature would have a full thickness temperature of -18.1°C. This simple calculation can be used during the winter months, when a linear temperature profile extends from the cold top surface to a warm bottom surface.
The POE curves for (a) temperature, (b) salinity and (c) borehole strength of old ice, by month, are given in Fig. 4. Table 1 lists the ‘extreme’ values characterizing individual depths in old ice, as well as the geometric mean of the monthly populations. The 0.01 POE of ice temperature is the coldest temperature that can be expected in old ice at any given depth – be it near the top ice surface (in winter) or near the ice interior (in summer). As expected, the 0.01 POE temperatures are considerably lower than the mean temperatures in Table 1. The geometric means are more indicative of the properties of the ice sheet overall, as opposed to the properties of the ice at individual depths (0.01 POE). The exceedance probabilities, means and standard deviations all play a role in characterizing the ice, as discussed below.
Fig. 4-a and Table 1 show a systematic trend of increasing temperature in spring and summer, and decreasing temperature in fall and winter, but the months in which the POE and mean temperatures reach their coldest (and warmest) values do not necessarily coincide. For instance, Table 1 shows the first evidence of ice warming at the top ice surface to occur in February (POE 0.01) and in the bulk layer of ice in March (mean value). August and September are the two months with the warmest ice temperatures (POE 0.01 and mean). The
coldest ice temperatures measured in two different floes during August and September were -6.9°C and -4.4°C, respectively. The fact that those temperatures were measured 5m to 6m below the top ice surface shows that old ice floes generally have a ‘C-shaped’ temperature profile or have become mostly isothermal (except perhaps, near the top ice surface) in August and September. By October, the ice cooling trend has advanced from the top ice surface (POE 0.01 of -16.3°C) to the ice interior (mean value, -4.7 ± 3.6°C).
Table 1. POE for Temperature, Salinity and Borehole Strength of Old Ice, by Month
Month Mean Ice temp. ± st dev (°C) Ice temperature POE 0.01 (°C) Mean Salinity ± st dev (‰) Salinity POE 0.01 (‰) Mean BHS ± st dev (MPa) BHS POE 0.01 (MPa) Jan -10.8 ± 7.6 -31.0 — — 21.7 ± 3.1 26.0 Feb -13.0 ± 8.4 -29.2 — — — — Mar -11.4 ± 6.3 -26.8 1.8 ± 1.2 5.6 24.2 ± 6.3 36.0 Apr -9.4 ± 6.1 -25.0 2.4 ± 1.6 6.3 22.4 ± 5.8 38.0 May -7.8 ± 4.6 -19.4 1.5 ± 1.6 9.6 29.6 ±8.9 49.2 Jun -2.7 ± 2.9 -12.4 1.2 ± 1.3 5.2 19.5 ± 7.7 34.6 Jul -2.5 ± 2.1 -8.8 2.2 ± 1.5 5.4 15.2 ± 7.4 28.6 Aug -2.1± 1.6 -6.6 1.5 ± 1.2 4.8 13.3 ± 6.6 29.2 Sep -1.4 ± 0.9 -4.3 2.1 ± 1.8 9.3 5.1 ± 1.6 * — Oct -4.7 ± 3.6 -16.3 1.5 ± 1.6 7.0 12.1 ± 7.5 25.6 Nov -6.8 ± 3.7 -18.0 — — 17.8 ± 6.6 30.0 Dec -11.4 ± 6.9 -28.8 — — 23.0 ± 5.8 —
*low mean borehole strength for September results from the limited number of tests (18), conducted to a maximum depth of 2m.
0.001 0.01 0.1 1 -50 -40 -30 -20 -10 0
Old ice temperature (°C)
P rob ab ili ty of E x cee d a n ce ( P O E )
Jan Feb Mar Apr May Jun Jul Aug Sep Oct Nov Dec
0.001 0.01 0.1 1
0 2 4 6 8 10 12 14
Old ice salinity (‰)
0.001 0.01 0.1 1
0 10 20 30 40 50 60
Old ice borehole strength (MPa)
(a)
(b)
(c)
Figure 4. Probability of Exceedance, POE, curves for (a) temperatures, (b) salinities and (c) borehole strengths measured on old ice.
Old Ice Salinity
Old ice salinities are similar, regardless of when or where in the Arctic the floe is sampled (Fig. 4-b). The salinity of old ice most often ranges from 0 to 5‰, but values of up to 12.3‰ have been measured in some cases. The unusually high old ice salinities for the months of May and September were measured at various depths in landfast multi-year ice near Ward Hunt Ice Shelf (Jeffries and Shoemaker, 1987) and old ice from the Kong Oscars area of east Greenland (Overgaard et al., 1978),
respectively. Table 1 shows that the mean salinity of old ice ranges from a minimum of 1.2±1.3‰ (in June) to a maximum of 2.4±1.6‰ (in April). The relatively small differences in the monthly mean ice salinities, and the overlapping salinity curves in Fig. 4-b, suggest that old ice experiences much smaller changes in salinity than first-year ice during summer (Johnston et al., 2003). The average old ice salinity for all ice depths, in all months, is 1.8‰ (not shown).
Old Ice Borehole Strength
The monthly POE curves of ice borehole strength are in relatively good agreement, although September and May sit apart from the other months (Fig. 4-c). The unusually low strengths for September come from a single study that sampled the uppermost 2m of old ice only, therefore cannot be taken as representative of the full thickness of old ice. The month of May is notable for producing the highest borehole strengths (up to 50MPa). Three of the studies conducted in May involved thick multi-year ice in the Canadian Arctic Archipelago (Geotech, 1985; Johnston, 2007 unpublished, and Johnston, 2014). Borehole strengths of 50MPa are not unrealistic for cold multi-year ice, when it is considered that multi-year ice floes in the Beaufort Sea can have boreholes strengths of 30MPa in August (Johnston, 2014, see Fig. 4-c). Even though August is one, of the two months with the warmest ice temperatures (Table 1, Fig. 4-a), the old ice strength in late summer can rival strengths in winter, at some depths (Fig. 4-c).
SEASONAL VARIATION IN OLD ICE PROPERTIES
The temperature and borehole strength of old ice vary during the year, but old ice salinity remains relatively constant (Fig. 4, Table 1). Given the minimal change in old ice salinity over the course of a year, the rest of this paper will focus on quantifying variations in the strength and temperature of old ice. Note that the ‘depth-averaged’ values (from an individual borehole) and ‘mean’ values (of a population) are both used to describe the overall properties of a floe.
Fig. 5 shows the variation in the averaged temperature and depth-averaged borehole strength of 164 boreholes in old ice, by month. The figure includes depth-averaged strengths of boreholes in which temperatures were (n=111) and were not (n=80) measured over the complete depth of the borehole. Note that the depth-averaged temperatures in Fig. 5 represent a smaller sample (889 depths in 111 boreholes) than the temperatures compiled in Fig. 4-a (n=4161 depths). The considerable variation in the depth-averaged borehole strengths in Fig. 5 largely results from boreholes being made to different depths, relative to the ice thickness. Since most boreholes penetrate part-way through the full ice thickness, data in the figure tend to be biased towards the colder, stronger ice (in winter) and the warmer, weaker ice (in summer). Nevertheless, Fig. 5 does show strength and temperature trends to be mirror images of one another: ice strength tends to decrease from winter to late summer, and increase again in the fall. The opposite trend is observed in ice temperature.
The inverse relation between ice strength and temperature is shown more clearly in Fig. 6, using three data sets (i) 889 individual strength and temperature measurements made in 111 boreholes, regardless of test depth, (ii) the depth-averaged strengths and temperatures from 111 boreholes and (iii) monthly mean temperatures and strengths listed in Table 1 from two, largely unrelated populations. Note that the ice temperatures in (i) and (ii) were measured prior to conducting the strength test, therefore can be directly correlated to the measured strength. For clarity, Fig. 6 shows the measurements into 1°C bin widths, over the temperature range 0 to -20°C. The figure does not indicate the number of boreholes and/or depth intervals included in each temperature bin, but it should be noted that (a) all bins contain more than 4 measurements and (b) considerably more measurements have been made in warm ice, than in cold ice. Only four borehole strength tests have been performed at (known) ice temperatures colder than -20°C (two tests each at ice temperatures of -22°C and -26°C). Since so few tests were conducted at ice temperatures colder than -20°C, the data have not been included in Fig. 6.
-20 -10 0 10 20 30 40 50 60 0 1 2 3 4 5 6 7 8 9 10 11 12 13 Month D ep th-aver ag ed B H S ( M P a) an d i ce tem p er at u re ( °C )
BHS, depth-avg (n = 111) BHS, depth-avg (no temperature, n = 80)
ice temperature, depth-avg (n = 111) BHS, trendline ice temperature, trendline
Figure 5. Depth averaged borehole strength (BHS, circles & crosses) and depth-averaged ice temperature (squares) for individual boreholes showing general trend of decreasing strength/increasing temperature.
0 5 10 15 20 25 30 35 40 45 -25 -20 -15 -10 -5 0
Mean ice temperature (°C)
Me a n B H S ( MP a )
BHS & temp at test depth, regardless of depth (n=889 tests) depth-average BHS & temp, same borehole (n=111 boreholes) monthly means, Table 1
Figure 6. Mean and st. dev. of old ice borehole strengths (BHS), binned by ice temperature. See text for details about the three data sets in the figure.
The first item to note from Fig. 6 is that each of the three data sets show that ice strength decreases with increasing ice temperature, although there are large standard deviations for all bins. The trend is strongest at ice temperatures warmer than -12°C and less evident at colder ice temperatures. That is because, in cold ice, the borehole indentor may cause ice around the indentors to fracture, limiting the maximum ice pressure that can be attained during a test. These so-called premature failures (Sinha, 2011) can be problematic for tests performed near the top ice surface – which also happens to be where most ice temperatures colder than -12°C occur – since fractures propagate more easily to a free surface. Eliminating the premature failures from the data compilation provides evidence that the borehole strength continues to increase over the ice temperature range -12°C to -15°C (Johnston, 2014). Similarly, Cox and Richter-Menge (1988) show the mean, confined compressive strength (triaxial compressive strength) of multi-year ice specimens tested at a temperature of -20°C to be twice the strength of specimens tested at -5°C. By inference then, the mean borehole strength of multi-year ice could approach 40MPa at ice temperatures of -20°C, given its 20MPa strength at -5°C (Fig. 6).
The second item to note from Fig. 6 is that individual test depths were characterized by temperatures as cold as -20°C, but the coldest depth-averaged temperature was several degrees warmer (-15°C). The coldest ‘depth-averaged’ temperature in Fig. 6 comes from a 3.5m deep borehole made in thick multi-year ice, with no snow cover. The depth-averaged temperature would have been warmer had the borehole penetrated the full ice thickness. Nevertheless, the depth-averaged temperature of -15°C is between the coldest mean ice temperature in Table 1 (-13.0 ± 8.4°C, February) and the average, full-thickness temperature of old ice (-18°C) with an ice surface temperature of -34.3°C and a linear temperature profile extending to the warm bottom ice (-1.8°C, see Fig. 3-a).
where σf is the flexural strength of the ice (in MPa) and νb is the brine
volume calculated from the equations in Frankenstein and Garner (1967). Equation 1 is commonly used to calculate the flexural strength of first-year ice over its full thickness. Timco and Johnston (2002) show the measured borehole strength of first-year ice and the calculated
flexural strength from Equation 1 to decrease in the same manner during summer. The authors attribute the deterioration in first-year ice strength to the increased brine volume of the warming ice. For multi-year ice, however, the measured borehole strength and calculated brine volume are poorly correlated, over a wide range of temperatures (Johnston, 2014), leading the author to conclude that brine volume has a lesser effect on multi-year ice strength. Since Johnston (2014) did not elaborate on whether Equation 1 would result in overly conservative, or under-conservative flexural strengths for multi-year ice, the matter is examined below.
The third item to note from Fig. 6 is that the means and standard deviations in depth-averaged strength from the boreholes (n=111) are in good agreement with the geometric means from individual strength tests regardless of test depth (n=889), for a specific ice temperature bin. That is surprising, since one would expect the mean ice strength to depend upon the test depth, but perhaps the large standard deviations in strength for each temperature bin mask this effect. Note also that merging the monthly means of two separate populations from Table 1 (temperature and strength) often produces unacceptably low strengths for old ice. This shows that caution should be exercised if the mean values in Table 1 are used to estimate the properties of old ice. Clearly, it would be preferable to relate ice temperatures and ice strengths from the same population (i.e. old ice floes), rather than relating largely unrelated populations.
BOREHOLE STRENGTH AS A PROXY FOR
FLEXURAL STRENGTH
The borehole strength is a measure of the confined compressive strength of the ice, which makes it useful for calculating the force of thick, multi-year ice crushing against a vertical structure. The flexural strength is more relevant for inclined (conical) structures and icebreaking ships. There is some evidence that thick, multi-year ice fails in flexure (Danielewicz and Blanchet, 1987), but the question of how often it occurs – and under what conditions – has not been sufficiently addressed. Then, there is the fundamental question of what value to use for the flexural strength of multi-year ice: ISO 19906 states that it “can be taken as 0.40MPa, although values ranging to 1MPa have been used by some practitioners”. Frederking and Sudom (2013) obtained an even wider range of calculated flexural strengths (0.2 to 1.7MPa) for multi-year floes impacted by the MV Arctic. Since considerably more borehole strength data have been collected on old ice than flexural strength data (for good reason – in situ borehole strength tests are much simpler to conduct and produce less scatter), the following sections examine whether the measured borehole strengths can be used (a) as a proxy for the flexural strength of old ice and (b) to establish bounds for the flexural strengths that can be expected over the full thickness of old ice.
Calculated Flexural Strength of Sea Ice
Timco and O’Brien (1994) use over 2500 measurements from freshwater ice and first-year sea ice to show that the flexural strength of sea ice can be described by:
σf = 1.76 exp (-5.88 √νb) (1)
Measured Flexural Strength of MY and Iceberg Ice
Equation 1 can be used to calculate the flexural strength of old ice, but determining whether the calculations are reasonable requires consulting the flexural strengths that have actually been measured on specimens of second-year or multi-year ice. Three studies are available for that purpose. Gladwell (1977) and Vaudrey (1981) are the only two sources of measured flexural strength of multi-year ice known to the authors. Both studies were conducted in the Beaufort Sea. Considered here are the 20 beams (either 2m by 0.3m square or 1.5m by 0.2m square) that Gladwell quarried from various depths in a multi-year ice ridge and tested in three-point bending. In the Vaudrey study, a total of 14 ‘large’ beams (1.25m long by 0.15m square) and 80 ‘small’ beams (500mm by 65mm square) were quarried from the sail of a multi-year pressure ridge and tested in three point bending. The third study of interest was performed by Gagnon and Gammon (1995), but involved iceberg ice. During that (laboratory) study, the flexural strength of 24 beams of iceberg ice was measured in four-point bending. The beams were 127mm thick and long enough to extend beyond the lower supports of the loading frame (0.727m). Results from the Gagnon and Gammon study are included here because they provide an upper bound for flexural strengths possible in old ice.
Fig. 7 plots the means and standard deviations of flexural strength from each of the three studies, against ice temperature. There is considerable scatter in the data, partly because beam specimens for the three studies were of different dimensions. Data scatter aside, it is possible to tease out a general decrease in flexural strength with increasing ice temperature. The trend is most apparent in the Gagnon and Gammon study, possibly because those tests were conducted under the controlled conditions of a laboratory. Fig. 7 also shows the flexural strengths that were calculated using Equation 1, for four constant ice salinities (from 0.01 to 5.0‰), at varying ice temperatures. Comparison of the measured and calculated flexural strengths shows that (a) calculations for 5.0‰ sea ice fall below most of the mean strengths of the specimens, (b) calculations for 0.2‰ sea ice are comparable to the mean strengths of iceberg specimens and therefore, overestimate most of the flexural strengths from multi-year ice specimens and (c) calculations for 0.01‰ sea ice are extremely conservative compared to strengths measured on even iceberg ice, for the wide range of temperatures. Fig. 7 is useful for the insight it provides about the temperatures and salinities of old ice for which the flexural strengths noted in ISO 19906 (0.4 to 1.0MPa) may apply.
Relating Borehole Strength to Flexural Strength of Old Ice
It has been shown that the flexural strengths calculated from Equation 1 (for sea ice of 1.8‰ salinity) are comparable to the flexural strengths measured on multi-year ice specimens (Fig. 7). It was also shown that the mean salinity of old ice (1.8‰) varies little throughout the year. Therefore, one would expect Equation 1 to provide a reasonable estimate of the flexural strength of 1.8‰ old ice, over its full thickness. This was examined by comparing the calculated flexural strengths to the measured borehole strengths, as shown in Fig. 8. Note that both
strengths have been normalized to their mid-winter maximums. The mean borehole strength of old ice was normalized by 32MPa (at -19°C, see Fig. 6) and the calculated flexural strength was normalized by 1.14MPa (for 1.8‰ and -20°C, see Fig. 7). The mean, depth-averaged borehole strengths in the figure were obtained from Fig. 6, whereas the flexural strengths were calculated for old ice of constant mean salinity (1.8‰) and varying ice temperatures from -1°C to -20°C (see also Fig. 7). Fig. 8 does not show the flexural strength for the 0°C temperature bin because Frankenstein and Garner’s brine volume equations are not valid for ice temperatures warmer than -0.5°C. Note that the decreases in measured borehole strength and calculated flexural strength are most pronounced at ice temperatures warmer than -5°C. Note also that, at near melting temperatures, the normalized flexural strength (calculated) is lower than the normalized borehole strength (measured) of old ice. This provides additional evidence that brine volume plays a lesser role in the decrease of old ice strength, than first-year ice strength. The iceberg specimens in Fig. 7 showed the temperature-strength effect to be quite separate from brine volume effects, since glacial ice contains no salt. Preliminary results suggest that old ice may be governed by a temperature-strength effect that is somewhere in between iceberg ice and first-year ice.
0.0 0.2 0.4 0.6 0.8 1.0 1.2 1.4 1.6 1.8 -25 -20 -15 -10 -5 0 Ice temperature (C) F le x ur a l s tr e ngt h (M P a )
iceberg beams MYI sail beams, lrg
MYI ridge beams (Gladwell) MYI sail beams, small
0.01ppt
0.2ppt
1.8ppt
5.0ppt
Figure 7. Flexural strengths of MYI (after Vaudrey, 1981; Gladwell, 1977) and iceberg ice (after Gagnon and Gammon, 1995). Flexural strengths calculated for the salinities commonly observed in old ice (dotted lines).
0.0 0.2 0.4 0.6 0.8 1.0 1.2 1.4 -25 -20 -15 -10 -5 0 Ice temperature (°C) mean BHS, normalized by 32MPa
calc. FS of 1.8‰ salinity old ice, normalized by 1.14MPa
St re n g th , n o rm a liz ed to w in te r ma x imum
Figure 8. Depth-averaged borehole strength (BHS from Fig. 6) compared to flexural strengths calculated for a constant salinity of 1.8‰ at ice temperatures from -1°C to -20°C (calc FS). The BHS and FS were normalized to winter maximums, as discussed in text.
Fig. 8 shows similar trends of decreasing strength with increasing temperature for the normalized borehole strength and the calculated flexural strength. The figure suggests that the mean strength of old ice decreases to approximately 85%, 70% and 30% of its mid-winter strength (at -20°C) when the ice temperature warms to -10°C, -5°C and 0°C respectively. Although these results can be used as a general rule of thumb, the reader should recall that the strength of old ice has large standard deviations at all temperatures.
Equation 1 was shown to provide a reasonable estimate of the flexural strength of old ice having a mean salinity of 1.8‰. Fig. 9 plots the flexural strengths for ice of constant 1.8‰ salinity over the ice temperature range -1°C to -20°C (FS) against the mean, depth-averaged borehole strengths for the binned temperatures (BHS) from Fig. 6. Note that borehole strengths for temperature bins -15, 16, and 17°C were not included in Fig. 9. The measured borehole strength of old ice is, on average, 30 times higher than the calculated flexural strength for 1.8‰ salinity sea ice, over the specified temperature range. The highest ratio (38) occurs at an ice temperature of -1°C, likely because Equation 1 becomes less reliable at near melting ice temperatures, due to its brine volume dependency. Note that, to the authors knowledge, this is the first published study to directly relate the measured borehole strength to the calculated flexural strength. Further study is needed.
-20°C-19°C -13°C-12°C -11°C -10°C -9°C -8°C -7°C -6°C -5°C -4°C -3°C -2°C -1°C
FS1.8‰old ice = 0.037*(BHSold ice) - 0.061
R2 = 0.96 0.0 0.2 0.4 0.6 0.8 1.0 1.2 1.4 0 5 10 15 20 25 30 35
Mean, depth-averaged borehole strength BHS (MPa)
Fl ex ur a l st re ngt h (FS ) cal c. f rom E qn 1 (M Pa )
Figure 9. Mean, depth-averaged BHS for binned temperatures (see Fig. 6) versus calculated FS from Equation 1 (1.8‰ salinity for varying ice temperatures) over the ice temperature range -1°C to -20°C.
CONCLUSIONS
Thousands of temperature, salinity, density and strength measurements are compiled from old ice floes. Probability of exceedance (POE) curves for each month of the year are used to represent the tail of the distribution. POE values of 0.01 characterize ‘extreme’ ice properties at specific depths, whereas properties over the full ice thickness are characterized by the means (and standard deviations) of the monthly populations and by depth-averaging measurements from the same borehole. Since most measurements on old ice extend only part-way through the floe, these approaches have limitations for describing the full thickness properties of the floe.
Old ice temperature and borehole strength are shown to be inversely proportional. Seasonal variations in ice temperature and borehole strength are considerable, yet the mean salinity of old ice varies little over the course of a year. The months with the highest mean borehole strength, coldest mean temperature and lowest mean salinity are respectively May (29.6±8.9MPa), February (-13.0±8.4°C) and June (1.2±1.3‰). The months with the lowest mean borehole strength, warmest mean temperature and highest mean salinity are respectively
October (12.1±7.5MPa), September (-1.4±0.9°C), April (2.4±1.6‰). The POE curves showed December, January and February to be the coldest three months, with -34.3°C being the coldest ice temperature in the compilation. Temperatures in the bottom ice of floes more than 10m thick, although limited in number, remained at near freezing temperatures throughout the year. Old ice reached its warmest state in August and September. The coldest temperature in late summer was -7.0°C, and it occurred towards the interior of a 10 to 12m thick floe. Floes exhibit a cooling trend from September/October to February. Timco and O’Brien’s commonly-used equation for calculating the flexural strength of first-year ice has its limitations when applied to old ice, yet appears to provide a reasonable estimate for the flexural strength of old ice with a mean salinity of 1.8‰, at ice temperatures colder than -3°C. Equation 1 underestimates old ice strength at ice temperatures warmer than -3°C. Evidence suggests that old ice does not desalinate to the same extent as first-year ice, and that brine volume plays a lesser role in the decreasing strength of old ice, than first-year ice. Normalized values of the mean borehole strength and the calculated flexural strength exhibit similar trends of decreasing strength with increasing temperature, except at near melting ice temperatures. Comparison of the normalized borehole strength and calculated flexural strength shows the strength of old ice to decreases to ~85%, 70% and 30% at ice temperatures of -10°C, -5°C and 0°C respectively, relative to its maximum winter strength (at -20°C). The mean, depth-averaged borehole strength ranges from 11.5 to 31.5MPa and the calculated flexural strength varies from 0.4 to 1.14MPa (for 1.8‰ old ice salinity) over the temperature range -1°C to -20°C. On average, the mean, depth-averaged borehole strength is 30 times higher than the calculated flexural strength for 1.8‰ sea ice, over the given temperature range. Results in this paper should be used judiciously, given the highly non-uniform nature of old ice and its variability in ice strength. Thick, old ice should not be assumed weak and deteriorated, even in late summer. Extrapolating results to the bottom ice of 10m thick floes should be done with caution, since so few tests have been conducted at those depths. Although there is no solid basis for using results in this paper to extrapolate beyond an ice depth of 10m, these results do provide a first glimpse of what might be expected in the way of properties for such extreme ice features.
ACKNOWLEDGEMENTS
Space restrictions allow us to thank only the funding agencies: PERD, BREA, Polar Continental Shelf Program, Industry, Transport Canada and the National Research Council Canada. Note that this paper was corrected for the post-conference Icetech CD.
REFERENCES
Bjerkelund, C. et al., 1985. The Texture and Fabric of Second-Year Sea Ice Cover at Mould Bay, Prince Patrick Island, NWT. Proc. IEEE Int. Geo. and Remote Sens. Sym. (IGARRS), Apr 1983 (1) 426 – 431. Cox, G., Weeks, W., 1983. Equations for determining the gas and brine
volumes in sea-ice samples. J. Glaciol., 29(102), 306–316.
Cox, G. et al., 1984. Mechanical properties of multi-year sea ice, Phase I: Test Results. CRREL Report 84-9. Apr 1984. 107 p.
Cox, G. et al., 1985. Mechanical properties of multi-year sea ice, Phase II: Test Results. CRREL Report 85-16. Oct 1985. 89 p.
Cox, G., Richter-Menge, J., 1988. Confined Compressive Strength of Multi-year Pressure Ridge Sea Ice Samples. J. Offshore Mech. Arct. Eng. Aug, 1988. Vol. 110, 295–301.
Danielewicz, B., Blanchet, D., 1987. Measurements of Multi-year Ice Loads on Hans Island during 1980 and 1981, . POAC’87, 465–484. Frankenstein, G., Garner, R., 1967. Equations for determining the brine
volume of sea ice from –0.5°C to –22.9°C. J. Glaciol. 6(48), 943–944. Frederking, R., Sudom, D., 2013. Review of Flexural Strength of
Multi-year Ice. ISOPE. 1087 – 1093. ISSN 1098-6189.
Gagnon, R., Gammon, P., 1995. Characterization and Flexural Strength of Iceberg and Glacier Ice. J. Glaciol, 41 (137), 103 – 111.
Geotech, 1985. Medium Scale Multi-year Ice Indentation Test Program, Main Report, Geotechnical Resources Ltd., 282 p.
Gladwell, R., 1977. Field Studies of the Strength and Physical Properties of a Multi-year Pressure Ridge in the Southern Beaufort Sea – APOA Project 91, Imperial Oil Ltd, IPRT-3ME-77, Mar 1977. ISO, 2010. ISO International Standard, Petroleum and Natural Gas
Industries - Arctic Offshore Structures. ISO 19906:2010(E), ICS 75.180.10. 15 Dec 2010. 120 p.
Jeffries, M., Shoemaker, H., 1987. Some Physical Properties of Multi-year Landfast Sea Ice, Northern Ellesmere Island. POAC’87, 57–67. Johnston, M., 2009. Establishing damage criteria for multi-year ice
phase I : thickness and temperature of drifting floes, CHC-TR-066, National Research Council Canada, 50 p.
Johnston, M., 2011. Results from field programs on multi-year ice: August 2009 and May 2010. CHC-TR-082, National Research Council Canada, 85 p.
Johnston, M., 2014. A decade of probing the depths of thick multi-year ice to measure its borehole strength, Cold Regions Sci and Tech, (99) 46–65.
Johnston, M. et al., 2009. Multi-year Ice: Knowns and Unknowns. POAC’09, POAC09-120, 13 p.
Johnston, M., Timco, G., 2008. Understanding and Identifying Old Ice in Summer. CHC-TR-055, National Research Council Canada, Dec 2008, 236 p.
Johnston, M. et al., 2003. Properties of Decaying First-year Ice at Five Sites in Parry Channel, POAC’03, (1), p. 133 – 140.
Lapp, D. et al., 1984. Dedicated Tests with MV Arctic 1984: Ice Physical Property Report, Norland Science & Engineering Ltd., 150 p. Masterson, D., 1996. Interpretation of in situ borehole ice strength
measurement tests. Can. J. Civil Eng. 23(1), 165–179.
Overgaard, S. et al., 1978. Ice Properties in the Greenland and Barents Sea during Summer, J. Glaciol., 29 (101) p. 142 – 164.
Perovich, D. et al., 2003. Thin and Thinner: Sea Ice Mass Balance Measurements during SHEBA, J. Geophys. Res., 108 (C3), SHE26-1 to 26-12.
Shkhinek, K. et al., 2010. Analysis of Borehole Jack Records. IAHR, Symposium on Ice, Lahti, Finland, 14 p.
Sinha, N., 1985. Confined Strength and the Deformation of Second-year Columnar-Grained Sea Ice in Mould Bay. OMAE, (II), p 209–219. Sinha, N., 2011. Borehole indentor - a tool for assessing in-situ bulk ice
strength and micromechanics. Cold Regions Science and Technology 69, 21–38.
Shokr, M., Sinha, N.K., 1995. Physical, electrical and structural properties of Arctic sea ice observed during SIMMS’92 experiment. Environment Canada Atmospheric Research. Report 95-005. 148 p. Timco, G., Johnston, M.E., 2002. Sea Ice Strength during the Melt
Season. IAHR Symposium on Ice, p. 187 – 193.
Timco, G., Frederking, R.M.W., 1996. A review of sea ice density. Cold Reg. Sci. Technol. 24(1), 1–6.
Timco, G., O’Brien, S., 1994. Flexural strength equation for sea ice. Cold Reg. Sci. Technol. 22(3), 285–298.
Vaudrey, K., 1981. Beaufort Sea Multi-year Ice Features Survey, Volume II: Beam Testing, Shell Development Company, Oct, 1981. WMO, 1985. World Meteorological Organization (WMO) Sea Ice