Publisher’s version / Version de l'éditeur:
Vous avez des questions? Nous pouvons vous aider. Pour communiquer directement avec un auteur, consultez la première page de la revue dans laquelle son article a été publié afin de trouver ses coordonnées. Si vous n’arrivez pas à les repérer, communiquez avec nous à PublicationsArchive-ArchivesPublications@nrc-cnrc.gc.ca.
Questions? Contact the NRC Publications Archive team at
PublicationsArchive-ArchivesPublications@nrc-cnrc.gc.ca. If you wish to email the authors directly, please see the first page of the publication for their contact information.
https://publications-cnrc.canada.ca/fra/droits
L’accès à ce site Web et l’utilisation de son contenu sont assujettis aux conditions présentées dans le site LISEZ CES CONDITIONS ATTENTIVEMENT AVANT D’UTILISER CE SITE WEB.
Proceedings of the Fourth International Building Physics Conference: Energy Efficiency and New Approaches: 15 June 2009, Istanbul, Turkey, pp. 455-461, 2009-06-15
READ THESE TERMS AND CONDITIONS CAREFULLY BEFORE USING THIS WEBSITE.
https://nrc-publications.canada.ca/eng/copyright
NRC Publications Archive Record / Notice des Archives des publications du CNRC :
https://nrc-publications.canada.ca/eng/view/object/?id=b33c9093-4bc4-40aa-aeaa-6770778974cb https://publications-cnrc.canada.ca/fra/voir/objet/?id=b33c9093-4bc4-40aa-aeaa-6770778974cb
NRC Publications Archive
Archives des publications du CNRC
This publication could be one of several versions: author’s original, accepted manuscript or the publisher’s version. / La version de cette publication peut être l’une des suivantes : la version prépublication de l’auteur, la version acceptée du manuscrit ou la version de l’éditeur.
Access and use of this website and the material on it are subject to the Terms and Conditions set forth at
An energy simulation study of wall systems for Canadian Arctic Homes
http://irc.nrc-cnrc.gc.ca
An e ne rgy sim ulat ion st udy of w a ll syst e m s
for Ca na dia n Arc t ic H om e s
N R C C - 5 1 3 5 5
C o r n i c k , S . M . ; R o u s s e a u , M . Z . ; P a r e k h , A .
J u n e 2 0 0 9
A version of this document is published in / Une version de ce document se trouve dans:
Fourth International Building Physics Conference: Energy Efficiency and New Approaches, Istanbul, Turkey, June 15-18, 2009, pp. 1-39
The material in this document is covered by the provisions of the Copyright Act, by Canadian laws, policies, regulations and international agreements. Such provisions serve to identify the information source and, in specific instances, to prohibit reproduction of materials without written permission. For more information visit http://laws.justice.gc.ca/en/showtdm/cs/C-42
Les renseignements dans ce document sont protégés par la Loi sur le droit d'auteur, par les lois, les politiques et les règlements du Canada et des accords internationaux. Ces dispositions permettent d'identifier la source de l'information et, dans certains cas, d'interdire la copie de documents sans permission écrite. Pour obtenir de plus amples renseignements : http://lois.justice.gc.ca/fr/showtdm/cs/C-42
An Energy Simulation Study of Wall Systems for Canadian Arctic
Homes
S. M. Cornick & M. Z. Rousseau
Institute for Research in Construction, National Research Council Canada
A. Parekh
Sustainable Buildings and Communities, Natural Resources Canada
ABSTRACT: This paper describes a parametric assessment of energy usage budgets for selected building envelope assemblies. The simulation study was conducted as part of a project to develop building envelope assemblies that are energy efficient and durable under extreme cold outdoor climates and indoor conditions typically found in these climes. Energy costs in northern Canada are high especially in the Arctic where communities are accessible only by air or boat or ice roads. Energy efficiency is therefore a primary objective here however this objective must be balanced with transportation and construction costs, which are also high. The objective of the simulation study was to compare the energy performance of proposed high performance wall assemblies with typical baseline wall assemblies. Four high performance walls were compared with two baseline walls, one a wall typical of low latitude regions, and the second a typical arctic wall assembly. Seven locations were selected for analysis, 2 representing western, 2 representing central, and 3 representing eastern arctic conditions. Three buildings were simulated, a fully detached home, a middle unit of a multiunit residence, and an end unit of a multiunit residence. A model for estimating the change in energy consumption with changes in wall thermal conductance was developed. Obviously the most highly insulated wall system exhibits the best performance with respect to space heating consumption. Recommending a wall type was outside the scope of this study but within the scope of the larger project. The objective of this work was to provide a method to easily determine change in space heating consumption due to a change in wall construction, which can then be used as the basis for a total life cycle assessment of the proposed walls.
1 INTRODUCTION
Everything in the Canadian north costs more! Energy and construction costs are especially high in the arctic where many communities are accessible only by air or boat or ice roads. Residential energy prices per Mega Joule (MJ) are 1.5 to 5 times more expensive for electricity and up 1.7 times more expensive for fuel oil than in southern regions of Canada (National Model Energy Code of Canada for Houses (NMECCH), 1997)1. Residential construction costs are 1.3 to 3.6 times higher than in larger southern cities (NMECCH, 1997)2. The wide variation in cost reflects the means of access to the communities. Generally the lack of all-weather or winter roads to a community increases both energy and materials costs, although labour costs tend to be relatively fixed. High prices make energy efficiency a primary objective in the arctic however this objective must be balanced with transportation and construction costs. To address this a four-year
1
Energy for rates for electricity, fuel oil, and natural gas were normalized to energy prices for southern Ontario CA.
2
Construction costs are blended cost reflecting both the local price of labour and local materials cost. The costs were normalized to construction costs in southern Ontario CA, specifically Toronto.
project was undertaken to assess the performance of innovative wall systems for the Canadian north (Saïd 2005). The project comprised several tasks, including a literature review to identify potential candidate wall systems (Saïd 2006) and a community consultation with the objective of selecting a number of candidate walls (Cornick 2007). Six walls were selected for the laboratory-testing portion of the program (Rousseau et al. 2008). These walls were also used for a hygrothermal simulation study as well as energy and environmental impact studies. The objective of the environmental impact analysis is to assess impact on the environment of the building envelope assemblies.
The objective of the simulation study, reported here, was to compare the energy performance of proposed high performance wall assemblies with typical baseline wall assemblies. The goal was to develop a simple model to quickly estimate, using a single calculation, the change in space consumption for a given change in wall conductance regardless of parameters such as building type, window-to-wall ratio, and infiltration. The results of the study will be used as inputs to the environmental assessment.
2 SIMULATION STUDY
Details of the simulation study are summarized below. HOT2000 v10.31 (NRCan 2008, Haltrect and Fraser 1997, Purdy 2008) was used for the energy simulations.
2.1 Wall configurations
Four high performance walls were compared with two standard walls. The standard walls represent a wall typical of low latitude regions and a second wall typical of new construction in the Canadian arctic. The six walls used for the simulation study are described in detail by Rousseau et al. (2008) and are summarized below.
Wall 1 – Southern standard wall. This is the one
of the standard walls, representing typical southern Canadian construction techniques. The wall comprises form exterior to interior, painted wood exterior lap siding, 38x140 mm framing, house wrap weather resistive barrier, 11 mm Oriented Strand Board (OSB), 3.5 RSI glass fibre batts, 6-mil polyethylene vapour retarder, and 12.7 mm painted gypsum board.
Wall 2 – Arctic standard. This is typical of new
house construction in the Canadian arctic and represents the other standard wall. This is the reference against which other walls will be compared. The wall comprises pre-finished structural smart panel siding, house wrap, 38x140 framing, 140 mm mineral fibre semi-rigid insulation, 6-mil poly, 38x65 mm horizontal strapping and 65 mm mineral fibre insulation, and 12.7 mm painted gypsum board.
Wall 3 – E2 wall. This wall was part of a house
designed to better the NMECCH (1997) by 50%. This wall was selected for the Yukon Territory E2 demonstration house (CMHC 2008). The details for this wall are: hardboard lap siding, 19x65 mm horizontal strapping, house wrap, OSB, 38x182 mm framing, 182 mm mineral fibre insulation, 6-mil poly, 38x89 mm strapping, 89 mm mineral fibre insulation, and 12.7 mm painted gypsum board.
Wall – 4 Structural Insulated Panel system (SIPs).
The details for this wall are: hardboard lap siding, house wrap, load-bearing 152 mm SIP (with expanded polystyrene insulation), 6-mil poly, 38x38 mm horizontal strapping with 38 mm mineral fibre semi-rigid insulation, and 12.7 mm painted gypsum board.
Wall – 5 I-joist system. The I-joist wall comprises
hardboard lap siding, house wrap, OSB, 190 mm I-joist filled with mineral fibre insulation, 6-mil poly, 38x38 mm horizontal strapping filled with 38 mm mineral fibre insulation, and 12.7 mm painted gypsum board.
Wall – 6 E2 Double wall construction. This was a
wall designed for a house designed to better the
NMECCH (1997) by 50%. This wall was selected for the Nunavut Territory E2 demonstration house (CMHC 2008). The wall details are: pre-finished structural smart panel siding, house wrap, 38x140 mm framing, 140 mm mineral fibre insulation, 38 mm gap filled with mineral fibre insulation, 6- mil poly, 38x89 mm interior studs with 89 mm mineral fibre insulation, and 12.7 mm painted gypsum board.
2.2 Locations
Seven locations were selected for analysis, 2 representing western arctic conditions, 2 representing central, and 3 representing eastern arctic conditions. The locations, along with some basic climate parameters, are given in Table 1.
Table 1. Locations used in the study.
Location Lat [°] HDD18* Daily Mean§ [°C] Baker Lake NU 64.30 10859.6 -11.8 Coral Harbour NU 64.19 10800.0 -11.6 Hall Beach NU 68.78 11696.9 -14.1 Inuvik NT 68.30 9766.9 -8.8 Iqaluit NU 63.75 10117.4 -9.8 Resolute NU 74.72 12526.1 -16.4 Yellowknife NT 62.46 8256 -4.6 *
Heating degree-days are the number of degrees below 18°C.
§
Annual daily mean
2.3 Building Types
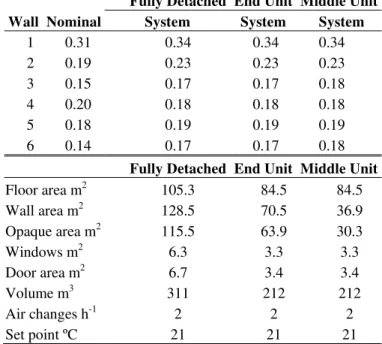
Residential buildings in the Canadian arctic generally fall into one of two categories; single detached units and multiplex units. New construction tends to be single storey construction. Three typical buildings were modeled, a fully detached home, a middle unit of a multiunit residence, and an end unit of a multiunit residence. Figure 1 shows a typical five-plex of the type modeled here. The fully detached home was based on the Nunavut E2 home while the multiplex unit was based on a typical 5 unit 2-bedroom complex currently being built. To examine the effect of wall construction all other building parameters, such as window-to-wall ratio, floor and ceiling construction, and air leakage characteristics were held constant. The characteristics of the house models are given in Table 2 as are the thermal conductance values for the wall variations. The system RSI is the thermal resistance of the system including thermal bridging of the framing layers, any other layers that were added (such as exterior finishes and interior finishes) and air film coefficients, but not including any openings (such as windows and doors). The nominal RSI is the thermal resistance of the insulation only.
3 RESULTS
The results of the simulation study are described below. The results are presented as the space heating consumption per unit of wall area not including openings (windows and doors). The change in space heating consumption with the change in system wall conductance is examined.
3.1 Change of wall conductance
Not surprisingly the results were highly linear (Cornick and Sander 1995, Cornick et al. 1996). Figure 2 shows the effect of the different wall types on the energy consumed for space heating. The energy consumed per unit area of wall is directly proportional to the thermal conductance. The slope is constant and does not change for a given floor plan. Similarly Figure 3 shows the effect of changing the window-to-wall ratio (WWR) and the number of air-changes per hour. The slope remains constant. Note however effect of the air-change rate on space heating consumption.
Figure 1 A typical five-plex in an artic community of the type modelled here.
Table 2 Thermal conductance values for the walls and houses used in the simulation study (W/m2·K) and default characteristics for the model houses.
Fully Detached End Unit Middle Unit
Wall Nominal System System System
1 0.31 0.34 0.34 0.34 2 0.19 0.23 0.23 0.23 3 0.15 0.17 0.17 0.18 4 0.20 0.18 0.18 0.18 5 0.18 0.19 0.19 0.19 6 0.14 0.17 0.17 0.18
Fully Detached End Unit Middle Unit
Floor area m2 105.3 84.5 84.5 Wall area m2 128.5 70.5 36.9 Opaque area m2 115.5 63.9 30.3 Windows m2 6.3 3.3 3.3 Door area m2 6.7 3.4 3.4 Volume m3 311 212 212 Air changes h-1 2 2 2 Set point ºC 21 21 21
Thus for Baker Lake NU the effect of changing wall system seems to be invariant and is approximately 1000 MJ/m2 wall area per unit of conductance, C. The effect of changing wall systems can then be estimated from the following linear equation:
HC = a C + b (1)
where HC is the space heating consumption (MJ/m2·y); C = system conductance for the wall (W/m2·K); a and b are correlation coefficients, 1011.6 MJ·K/W·y and 605.4 MJ/m2·y respectively for Baker Lake NU.
Figure 4 shows the slopes, a, and intercepts, b, calculated for the locations in the study plotted against the number of degree-days below 18ºC (HDD18) for each location. The trend for the coefficient a, which represents the change in space heating consumption with conductance, is linear with HDD18. Therefore change in space heating consumption can then be estimated by:
ΔHC = ΔC (A HDD18 + B) (2)
where HDD18 = number of degree-days below 18ºC; A and B are universal correlation coefficients, 0.096 MJ/Wand –34.3 MJ·K/W·y respectively.
3.2 Set point temperatures
One the key findings of a survey of interior conditions conducted for this project was the high temperatures maintained in typical housing units in the arctic (Rousseau et al. 2007, Cornick et al. 2008). The mean temperature for the houses surveyed in Inuvik NU was 24.4°C with little variation (Figure 5). There was little evidence of the use of setbacks.
Higher set point temperatures have a considerable effect on energy consumption. Increasing the interior temperature to 25°C changes the coefficient a by 15%. Table 3 shows the effect of changing the set point temperature from the default set point for a variety of temperatures for Baker lake NU.
Changing the set point temperature is analogous to lengthening or shortening the heating season (or making the season colder or warmer). It is possible to use the correlation developed previously (Eqn. 2), based on a 21°C constant temperature, for other interior set points. This can be done by assuming a set point of 21°C then calculating the slope, a, using an equivalent number of degree-days below 18°C that yields the same space heating consumption as if the house was held at the different set point. The equivalent HDD18 simulates the lengthening or shortening of the heating season and can be calculated using the following equation:
HDD18eq = D Tset2 + E Tset + HDD0 -
where HDD18eq = equivalent number of
degree-days below 18ºC; HDD0 = number of degree-degree-days below 0ºC; HDD21 = number of degree-days below 21ºC; Tset is interior temperature of the house (ºC); D
and E are correlation coefficients.
Figure 2 Effect of changing wall types on space heating con-sumption for Baker Lake NU for three home types.
Figure 3 Combined effect of changing WWR, natural
infiltration rate, and conductance.
Figure 4 Slope, a, and intercept, b, vs. degree-days below 18°C.
Table 3 Effect of changing set point temperature on slope, a, for Baker Lake NU.
Set point [°C]Δ% in a from 21°C a Simulation a Estimate % Error 18 -11 903.9 900.2 -0.4 19 -7.11 939.5 937.2 -0.2 21 0 1011.6 1013.5 -0.3 25 15 1162.9 1174.5 0.5 30 33 1342.2 1391.9 3.7
Table 4 Degree-day data for Bake Lake (National Climate Data and Information Archive).
Degree-day base # of degree days Coefficients
0.0 5195.6 D = 3.71
5.0 6522.0 E = 248.6
10.0 8049.2 - 15.0 9775.4 - 18.0 10859.6 -
Figure 5 Average set point temperatures for Canadian Arctic houses, Inuvik NU (Cornick et al. 2008).
The correlation coefficients D and E are location de-pendent and can be estimated by fitting the degree-days to a second order polynomial and setting the constant term (zero-order coefficient) equal to
HDD0. For example the degree-days for Baker Lake
NU are given in Table 4 as are the coefficients D and E. The HDD21 term in Equation 3 is not nor-mally compiled by meteorological services but can be estimated using the polynomial fit (excluding the last two terms in Equation 3). Alternatively given, the mean monthly temperature and the standard de-viation of daily mean temperatures, the method pro-posed by Schoenau and Kehrig (1990) for calculat-ing degree-days to any base can be used.
Using the procedure to adjust for set point tem-perature, applied to Baker Lake NU, the estimated slopes for different set points can be calculated. The correspondence, shown in Table 3, is good. Using a similar procedure the intercept coefficient, b, can be calculated if required.
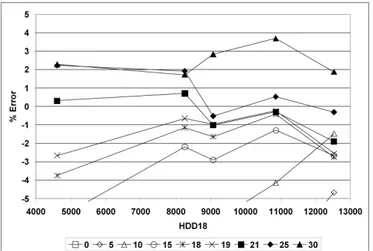
There are limits to this method for adjusting for the set point. The correlation tends to generate large
errors for set points below 15ºC and locations with less than 8000 heating degree-days (Figure 6).
3.3 An Example
The effect of changing the wall configuration can be summarized by the slope, a, which is in effect the change in space consumption, per unit of wall area, per unit of change in conductance. For the Canadian arctic the range of HDD18 spans 8000 to 13,000. Therefore the slope, a, ranges from 736 to 1218 MJ·K/W·y. For a typical fully detached house such as the one used for the simulation study, the wall area excluding windows and doors is 115.5 m2. Thus for Baker Lake the change space consumption for this particular house would be 116,265 MJ/y (32,296 kWh/y) per unit change of conductance (W/m2·K) using a constant 21ºC set point. Continuing the ex-ample changing from Wall 1 (RSI 2.95) to Wall 6 (RSI 5.77) would result in an estimated decrease of 19,445 MJ/y (5400 kWh/y). Raising the set point by 4ºC to 25ºC, as was observed in the survey, would increase consumption by 22,510 MJ/y (6253 kWh/y) a change of about 16% assuming that Wall 1 was used in the case of set point variation.
Figure 6 Error in estimating the slope, a, for various set point temperatures.
4 DISCUSSION
For new construction in the Canadian arctic the standard construction technique for residential homes is the wrap and strap approach, Wall 2 in this simulation study (Cornick and Rousseau 2007). For the fully detached house the conductance of the wall system was 0.23 W/m2·K (RSI 4.36). A double stud wall system, Wall 6, was the most highly insulated proposed wall in the study. For the detached house Wall 6 has a conductance of 0.17 W/m2·K (RSI 5.77). Therefore largest difference in conductance,
ΔC, which can be expected, is 0.06 W/m2·K.
Continuing the Baker Lake example, this time
us-ing a 25ºC as the set point as documented in the sur-veys, the estimated reduction in space heating
con-sumption was 70.4 MJ/m2·y (see footnote)3. For the fully detached unit the estimated reduction was 8131 MJ/y (2259 kWh/y). For the end and middle units the estimated reduction in space heating consump-tion was 4498 MJ/y (1249 kWh/y) and 2133 MJ/y (592 kWh/y) respectively.
The effect of dropping the interior temperature can be assessed by keeping the wall configuration constant, in this case Wall 2, the wrap and strap wall. If the interior temperature is reduced from a constant 25ºC to a constant 21ºC the estimated re-duction in space heating consumption is 18595 MJ/y (5165 kWh/y) a factor of 2.3 times that of changing the walls from the standard construction to the best wall proposed for the fully detached house.
A similar analysis was done to investigate the ef-fect of changing natural infiltration rates although it was not part of the scope of this study. The effect of changing the natural infiltration rate can be ex-pressed as a slope relating the change in space heat-ing consumption per unit volume per unit change of natural infiltration. For the fully detached house in Baker Lake the slope is 46.7 MJ·h/m3·y; i.e. 46.7 MJ per cubic metre of house per year per air change per hour. A change of 0.5 h-1 would produce an esti-mated reduction in space heating consumption of 23.3 MJ/m3·y at an interior temperature of 25ºC. Thus for the Baker Lake fully detached house the es-timated reduction on space heating consumption was 7262 MJ/y (2017 kWh/y), approximately 90% of the effect of going from the arctic standard wall, Wall 2, to the best wall.
Reducing the interior temperature would be an obvious and effective way of reducing energy con-sumption. The advantages of reduced interior tem-peratures are: 1) the greatest reduction of space heat-ing consumption and 2) no cost. The temperature set point however depends on the occupant’s thermal comfort, real and perceived, and is not a characteris-tic of the structure and therefore cannot be relied upon to produce predictable energy reductions.
The next best method for reducing energy con-sumption is to reduce the natural infiltration rate or change rate. Reducing the air change by 0.5 air-changes per hour produces the same estimated en-ergy savings as going from Wall 2 (artic standard) to Wall 6 (double stud wall). However, typical new construction in the Canadian Arctic is built to a high level of air-tightness, about 1.5 1/h at 50 Pa from blower fan tests performed when new (Cornick and Rousseau, 2007). Reducing the air-change rate to 1 h-1 might be difficult and expensive. Aging is also concern as well. As houses tend to get less tight over time. Making existing houses tighter however could significantly reduce energy consumption. The houses surveyed showed air-change rates as high as
3
In the case of a 25ºC set point the slope, a, is 1174.5 MJ-K/W-y as compared to slope of 1013.5 MJ-MJ-K/W-y at 21ºC
12 h-1 @ 50 Pa (Rousseau et al. 2007). It was sug-gested that one the reasons for the high temperature set points was that the occupants had set the thermo-stats high to counteract the effects of air-leakage, a thermal comfort issue. Reducing air-leakage could produce a double benefit; reduced air-leakage and lower thermostat settings.
The most reliable and perhaps most sustainable method of decreasing energy consumption is to in-crease the amount of insulation of the envelope. That being said the low hanging fruit has already been picked in that the standard arctic construction (Wall 2) has eliminated many of the thermal bridges through the use of the interior strapping. This method also effectively reduces the air-leakage by providing continuity to the air barrier and minimiz-ing the number of penetrations. An example of the
wrap and strap approach is shown in Figure 7. The
type of wall selected for future arctic construction will depend not only the energy savings but must be balanced by costs, labour and materials as well as other factors constructability, durability, environ-mental impact, health and comfort, and socio-economic factors. Most of these factors were outside the scope of the simulation study but part of the scope of the larger project (Saïd, 2005).
The change in space heating consumption for the modelled wall types is shown in Table 5. Here the reference wall was the arctic standard, Wall 2. The space heating consumption is given MJ per m2 of opaque wall per year. A negative change indicates an increase in space heating consumption from the reference wall. Not surprisingly the most insulated walls show the greatest change. The numbers in ta-ble can be converted to costs to be used as part of a life cycle cost analysis.
5 CONCLUSIONS
A simulation study was conducted as part of a project to develop building envelope assemblies that are energy efficient and durable under extreme cold outdoor climates found in the Canadian Arctic. Six walls were selected for the study. Two walls were standard walls; Wall 1 typical of southern Canadian construction, and Wall 2 typical of new construction in the Canadian Arctic. The other four walls repre-sented proposed high performance walls.
Table 5 Change in space heating consumption, MJ/m2·y for a given change in wall system from the reference wall, Wall 2.
Wall 1 Wall 2 Wall 3 Wall 4 Wall 5 Wall 6
C W/m2-K 0.34 0.23 0.17 0.18 0.19 0.17 Baker Lake -129.0 0 70.4 58.6 46.9 70.4 Coral Harbour -126.5 0 69.0 57.5 46.0 69.0 Hall Beach -137.7 0 75.1 62.6 50.1 75.1 Inuvik -116.4 0 63.5 52.9 42.3 63.5 Iqaluit -121.8 0 66.5 55.4 44.3 66.5 Resolute -145.8 0 79.5 66.3 53.0 79.5 Yellowknife -99.8 0 54.5 45.4 36.3 54.5
Recommending a wall type was outside the scope of this study but within the scope of the larger pro-ject. The objective of this study was to develop a means to compare the energy performance of the various wall types for arctic housing and this was done through the development of a simple model for predicting the impact of various wall types on en-ergy consumption.
Figure 7 An example of the wrap and strap approach for the ar-tic standard wall construction. Filling the strapped cavity in-creases the level of insulation and improves the air-barrier per-formance.
From the energy simulations a simple model was de-rived to estimate the change in space heating con-sumption from the change in system conductance (or R-value). The model requires degree-days below 18ºC for the location of interest as input. The model was derived for examining the change in wall sys-tems in isolation; therefore the results are invariant with respect to other parameters such as the win-dow-to-wall ratio or the amount of natural infiltra-tion. One parameter that did affect the rate of change of space heating combustion was the interior tem-perature. Surveys of Arctic homes indicated that in-terior temperatures where maintained at constant temperatures as high as 25ºC. The simulations used a constant 21ºC interior as the default. Calculating an equivalent value of the degree-days that produces the same energy consumption at 21ºC as a
simula-tion would produce at the different set point can ac-commodate other interior temperatures, usually higher. The procedure required slightly more cli-matic information however; degree-days below 0ºC, 10ºC, and 18ºC at a minimum. The procedure should only be used for cold locations, over 8000 degree-days below 18ºC and does not perform well for inte-rior temperatures below 15ºC. Overall the model can estimate the slope, a, the change in space heating consumption per unit of conductance within 10% of the slopes generating through simulations.
With respect to recommending a wall type for new arctic construction this was not possible within the scope of this paper. Obviously the most highly insulated wall system exhibits the best performance with respect to space heating consumption. Space heating costs however are not the only consideration in the arctic. The estimated energy cost savings must offset the increased material, transportation, and la-bour costs. The objective of this work was to pro-vide a method to easily determine change in space heating consumption due to a change in wall con-struction, which can then be used as the basis for a total life cycle assessment of the proposed walls.
6 REFERENCES
Canada Mortgage and Housing Corporation. 2008 Canadian Housing Observer. Ottawa Canada. pp. 79-83.
http://www.cmhc-schl.gc.ca/en/corp/about/cahoob/cahoob_001.cfm
Canadian Commission on Building and Fire Codes. 1997. Model National Energy Code of Canada for House, Na-tional Research Council of Canada, Ottawa.
Cornick, S. M., Manning M., Rousseau M. Z. and Swinton M. C. 2008. Task 5 Proposed Test Protocol for Walls of Houses in Extreme Cold Regions Part 2: Defining Interior Conditions, NRC-IRC Client Report B1239.6 URL: http://irc.nrc-cnrc.gc.ca/pubs/fulltext/b-1239.6/
Cornick, S. M. and Rousseau M. Z. 2007. Community Consul-tation on Wall Construction Methods, Institute for Re-search in Construction, National ReRe-search Council Can-ada, IRC-RR-233 pp. 25 June 2007. http://irc.nrc-cnrc.gc.ca/pubs/rr/rr233/
Cornick, S.M., Thomas, P.C. and Prasad, D.K. 1996. Predict-ing the effects of changes in thermal envelope characteris-tics on energy consumption: application and verification of a simple model for Australian and Canadian climates. En-ergy and Environment, 7, (1), pp. 1-28.
Cornick, S.M. and Sander, D.M. 1995. A simplified energy model for analysis of building envelope thermal character-istics. Proceedings of the Thermal Performance of the Ex-terior Envelopes of Buildings VI, Clearwater, Florida, U.S.A. December 04, 1995, pp. 687-695.
Haltrecht D. and Fraser K. 1997. Validation of HOT2000TM Using HERS BESTEST. Proceedings of Building Simula-tion 1997 Prague, Czech Republic, Sept. 8-10, 1997. pp. 1-8. IBPSA.
http://www.ibpsa.org/proceedings/BS1997/BS97_P009.pdf
National Climate Data and Information Archive, Canadian Climate Normals or Averages 1971-2000, Meteorological Service of Canada, Environment Canada 4905 Dufferin Street, Toronto, Ontario Canada M3H 5T4 http://www.climate.weatheroffice.ec.gc.ca/climate_normal s/index_e.html
NRCan 2008. HOT2000TM A Comprehensive Tool for the De-sign of Energy Efficient Homes and Buildings, Version 10.31, CANMET Energy Technology Centre, Natural Re-sources Canada, Ottawa, Ont., Canada K1S 0E4, 2008. Purdy J., Ferguson A., Mombourquette S., Haddad K., Lopez
P., Wyndham-Wheeler P. and Henry S., 2008. A test plan for an on-line whole building energy calculator. Building and Environment. 43:4.
Rousseau, M. Z., Cornick S. M., Saïd, M. N., Maref W., and Manning M. 2008. Report Task 4 - Review of Work Plan & Selection of Wall Assemblies, Report No: 44 B1239.7, May 2008. http://irc.nrc-cnrc.gc.ca/pubs/fulltext/rr/rr257/ Rousseau, M.Z., Manning, M.M., Said, M.N., Cornick, S.M.
and Swinton, M.C. 2007. Characterization of indoor hy-grothermal conditions in houses in different northern cli-mates. Proceedings of Thermal Performance of Exterior Envelopes of Whole Buildings X International Conference, Clearwater, FA, Dec 02, 2007, pp. 1-14. URL: http://irc.nrc-cnrc.gc.ca/pubs/fulltext/nrcc50080/
Saïd, M. N. 2006. Task 2: Literature Review: Building Enve-lope, Heating, and Ventilating Practices and Technologies for Extreme Climates, pp. 120. http://irc.nrc-cnrc.gc.ca/pubs/fulltext/b-1239.2/
Saïd, M. N. 2005. Building envelope researchers to develop wall assemblies suited to construction north of 60°. Con-struction Innovation. Institute for Research in ConCon-struction National Research Council Canada. 10: 9.
Schoenau, G. J. and Kehrig R. A. 1990. A method for calculat-ing degree-days to any base temperature. Energy and Buildings, 14 (1990) pp. 299-302.