Publisher’s version / Version de l'éditeur:
Proceedings, 2, 2007-06-27
READ THESE TERMS AND CONDITIONS CAREFULLY BEFORE USING THIS WEBSITE.
https://nrc-publications.canada.ca/eng/copyright
Vous avez des questions? Nous pouvons vous aider. Pour communiquer directement avec un auteur, consultez la
première page de la revue dans laquelle son article a été publié afin de trouver ses coordonnées. Si vous n’arrivez pas à les repérer, communiquez avec nous à [email protected].
Questions? Contact the NRC Publications Archive team at
[email protected]. If you wish to email the authors directly, please see the first page of the publication for their contact information.
NRC Publications Archive
Archives des publications du CNRC
This publication could be one of several versions: author’s original, accepted manuscript or the publisher’s version. / La version de cette publication peut être l’une des suivantes : la version prépublication de l’auteur, la version acceptée du manuscrit ou la version de l’éditeur.
Access and use of this website and the material on it are subject to the Terms and Conditions set forth at
Modelling Rubble Field Development at Isserk I-15 and Its Implications for Engineering Ice Rubble
Barker, Anne; Timco, Garry
https://publications-cnrc.canada.ca/fra/droits
L’accès à ce site Web et l’utilisation de son contenu sont assujettis aux conditions présentées dans le site LISEZ CES CONDITIONS ATTENTIVEMENT AVANT D’UTILISER CE SITE WEB.
NRC Publications Record / Notice d'Archives des publications de CNRC: https://nrc-publications.canada.ca/eng/view/object/?id=d4279331-26c5-41ea-acee-7fca7683662f https://publications-cnrc.canada.ca/fra/voir/objet/?id=d4279331-26c5-41ea-acee-7fca7683662f
485
Recent Development of Offshore Engineering in Cold Regions, Yue (ed.) POAC-07, Dalian, China, June 27-30, 2007.
@ 2007 Dalian University of Technology Press, Dalian, ISBN 978-7-5611-3631-7
MODELLING RUBBLE FIELD DEVELOPMENT
AT ISSERK I-15 AND ITS IMPLICATIONS FOR
ENGINEERING ICE RUBBLE
Anne Barker1 and Garry Timco2
(1. Canadian Hydraulics Centre, Ottawa, Canada; 2. National Research Council of Canada, Ottawa, Canada)
ABSTRACT
A grounded rubble field can be advantageous when it surrounds an Arctic offshore structure. It can attenuate ice loads and could be used as a base for an evacuation shelter. These advantages mean that the creation of a sTable., grounded rubble field at an offshore site can be beneficial for locations in the transition and landfast ice zones of the Beaufort Sea. In the winter of 1989~1990, the Molikpaq Caisson was deployed at the Isserk I-15 site in the Canadian Beaufort Sea. During October and early November, the Molikpaq was exposed to mobile first year ice driven by strong winds. This series of storms built a “cigar-shaped” rubble field at the site. Detailed information concerning the rubble field development at this site was collected. In this paper, a numerical model is used to examine the factors that affect the generation of a grounded rubble field. The observations from Isserk are used to validate the model. By investigating several scenarios of ice interaction, through an examination of the influence of water depth, ice thickness, velocity and fetch length upon rubble extent, the model can be used to provide information on the rate of growth of grounded rubble fields. The data can be used to quantify the effects of ice rubble on reducing ice loads in the winter and provide guidance on rubble stability and optimal rubble field extent, as well as evacuation options.
INTRODUCTION
Analysis of ice load data from initial oil and gas explorations of the Beaufort Sea has shown convincingly that grounded rubble fields that surround offshore platforms can
486
be very beneficial for attenuating ice loads. There is a clear advantage for lower loads, and hence lower-cost structures if a sTable. rubble field could be generated and maintained at the structure. To effectively use this approach, innovative technology must be developed to initiate and “pin” the ice rubble around the structure. However, the generation of grounded rubble around an offshore platform also has implications for Escape, Evacuation and Rescue (EER) procedures during this period. During ice formation and light ice conditions, survival craft could be deployed as a means of evacuation. During mid-winter, the grounded rubble fields that form around the structure can be difficult to traverse (Barker et al, 2006). On the other hand, they can also be advantageous, as during the winter, a rubble field could be used as a base for an evacuation shelter (Barker et al, 2007). By using field and numerical data, it is possible to obtain information on the rate of growth and decay of grounded rubble fields. To do so, data on the formation, extent and roughness of the Isserk I-15 rubble field were examined to determine issues with respect to the generation of a mid-winter grounded rubble field. The investigation of several scenarios of ice interaction, through a numerical examination of the influence of water depth, ice thickness, velocity and fetch length upon rubble extent, can be used to provide information on the rate of growth of grounded rubble fields. The data can be used to quantify the effects of ice rubble on reducing ice loads in the winter and provide guidance on rubble stability. Additionally, this type of information is important for the critical “in-between” times (between open water/light ice and landfast ice) when life craft cannot be used and the grounded rubble field is not safe for personnel. These time periods present very challenging times for safe evacuation.
This paper is part of a project that is examining quantitative information on the characteristics of ice conditions during the freeze-up, winter and break-up seasons. The work focuses on the landfast and transition regions of the Beaufort Sea. The data are being interpreted to provide guidelines for the engineering of ice rubble and for safe evacuation from an offshore structure in the landfast region of the Beaufort Sea. ISSERK I-15 RUBBLE FIELD DEVELOPMENT
The Molikpaq structure was developed by Gulf Canada Resources Ltd. and operated by Beaudril, a subsidiary of Gulf. The Molikpaq is a Mobile Arctic Caisson (MAC), which was first deployed in the Canadian Beaufort Sea in 1984 and used for exploration drilling for four winter seasons in the Canadian Arctic. It consists of a continuous steel annulus on which sits a self-contained deck structure. The core of the annulus is filled with sand, which provides over 80 percent of the horizontal resistance. The outer face of the Molikpaq is designed for extreme ice features. The structure can operate without a berm in water depths ranging from 9 to 21 m. In water depths over this, the structure is designed to sit on a suiTable. submerged berm. In
487
deeper waters, the angle of the outer face is 8º, whereas in shallower waters, the angle of the face is 23º. The Molikpaq has been modified and is presently operating off of Sakhalin Island.
In 1989~1990, the Molikpaq was used to drill a well for Esso, Gulf and Chevron at the Isserk I-15 site, in a water depth of 11.5 m. The seabed was subcut to a waterdepth of approximately 13 m. Since the water depth was relatively shallow, the ice interacted with the lower-sloped 23° face of the Molikpaq. During October and early November, the Molikpaq was exposed to mobile first year ice driven by strong winds. It was subjected to a series of storms that build a “cigar-shaped” rubble field at the site. Fig.1 shows an aerial photograph of the fully developed rubble field. Two versions of the timeline of events are shown in Fig. 2. There were essentially five major rubble building events over the course of thirteen days. By November 10, the ice surrounding the Molikpaq had become quasi-stationary landfast ice. Cracks in the rubble field developed over the winter, but with little ice movement, the field remained generally unchanged until break-up in late June.
Fig.1 Aerial photograph of the rubble field at Isserk I-15, taken on November 20, 1989 (from Poplin and Weaver, 1991)
488
Fig.2 Two interpretations of the rubble field development at Isserk I-15. Note that the majority of the Nov. 3 1989 rubble pile was not grounded, except near the highest peaks (right hand side of maps) (from a)Gulf Canada Resources Ltd. 1990 and b)Poplin and Weaver, 1991). Rough event extents for the computer simulations are indicated in Fig.2 (a) The rubble extended approximately 600 m from the structure and the maximum width of the field was approximately 200 m. The maximum rubble height noted was 9 m. Assuming that the ice was grounded at the location of the maximum rubble height, this would point to a maximum total ice thickness of approximately 22 m.
(a) (b) Event 6 Event 5 Event 4 Event 3 Event 2 Event 1
489
NUMBER SIMULATION OF RUBBLE FIELD DEVELOPMENT
The numerical approach is briefly outlined in this section with the intent to convey the essential aspects of model formulation. A comprehensive treatment of the subject is outside the scope of this paper. Details of the present numerical formulation, however, were covered by Sayed and Carrieres (1999), which describes a version aimed at operational ice forecasting. The model was later adapted and validated for solving ice-structure interaction problems related to offshore structures, with the Kulluk (Sayed et al. 2000; Barker et al. 2000), and examining the broken ice zone around a Molikpaq-shaped structure (Barker and Timco, 2003).
The present model uses a continuum rheology that follows a Mohr-Coulomb plastic yield criterion. The governing equations consist of the continuum equations for the balance of linear momentum and the plastic yield criterion. Those equations are solved using a fixed grid. Advection and continuity, on the other hand, are handled in a Lagrangian manner. An implicit Particle-In-Cell (iPIC) approach is employed. In that approach, an assembly of discrete particles represents the ice cover. Each particle has a fixed volume, and is assigned an area and a thickness. At each time step the velocities are interpolated from the grid to the particles. Thus, particles can be individually advected. From the new positions, values of particle area and mass are mapped to the grid. The resulting ice mass and area for each grid cell are then used to update ice thickness and concentration. Solution of the governing equations can then be carried out using the fixed grid. An implicit finite difference method is used. That method is based on uncoupling the velocity components and a relaxation iterative scheme. Updated velocities and stresses on the fixed grid are obtained from the solution. A depth-averaged implementation of the model is used in this paper, which averages the values of stresses and velocities over the thickness. Thickness variations, however, are accounted for. As stresses exceed a threshold, representing a ridging stress, each particle undergoes ridging; i.e. the thickness increases and area decreases, while conserving ice volume. Additionally, grounding of the ice is factored into the program runs.
Modelling Isserk I-15 Rubble Field Development
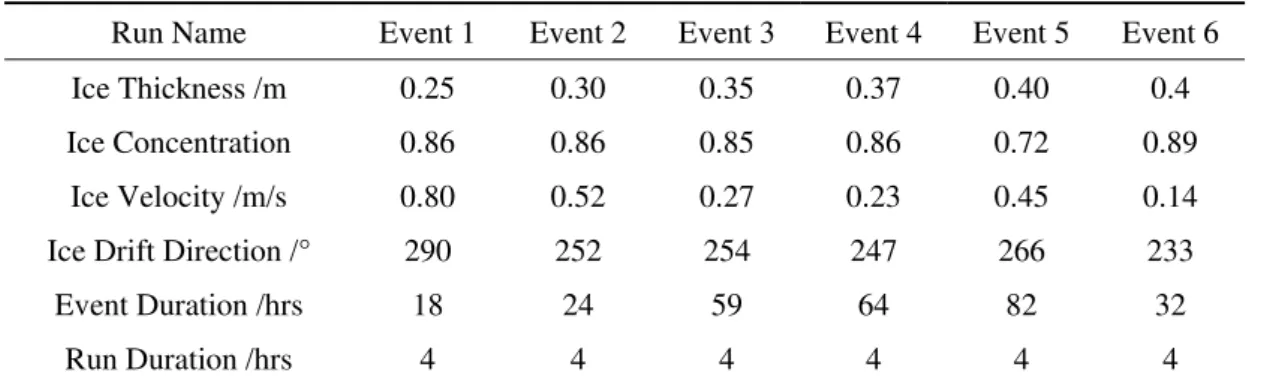
Six events were modelled. Their pertinent details are outlined in Table 1. The water depth was modelled as a constant value of 12 m. These events were run to re-create the formation of the Isserk I-15 rubble field. The resulting visualization of the rubble fields, at the end of each event, is shown in Fig.3.
490
Table 1 Run parameters for Isserk I-15 rubbling events
Run Name Event 1 Event 2 Event 3 Event 4 Event 5 Event 6
Ice Thickness /m 0.25 0.30 0.35 0.37 0.40 0.4
Ice Concentration 0.86 0.86 0.85 0.86 0.72 0.89
Ice Velocity /m/s 0.80 0.52 0.27 0.23 0.45 0.14
Ice Drift Direction /° 290 252 254 247 266 233
Event Duration /hrs 18 24 59 64 82 32
Run Duration /hrs 4 4 4 4 4 4
Note that the rubble shown in each event builds upon that from the previous event(s). The ice drift direction, thickness and concentration are different for each event, as indicated in Table 1 The axes are in nodal values – each node is 4 m (eg. 25 nodes = 100 m).
Due to the length of time required to run the numerical model, each event was run for four hours, rather than the actual event duration. While the maximum extent of the simulated rubble field from the edge of the structure was 244 m, compared with 600 m for the full-scale rubble, it is expected that this is directly related to the shortened run-time. Regardless, the model reproduced both a similar pattern of rubble extent and realistic rubble height over the course of the twenty-four hours of simulation time (compared with the 150 hours of real-time ice interaction that was observed for these events in the field). The maximum thickness was approximately 24 m (12 m sail height).
EFFECT OF ICE PROPERTIES AND OTHER PARAMETERS ON RUBBLE FIELD DEVELOPMENT
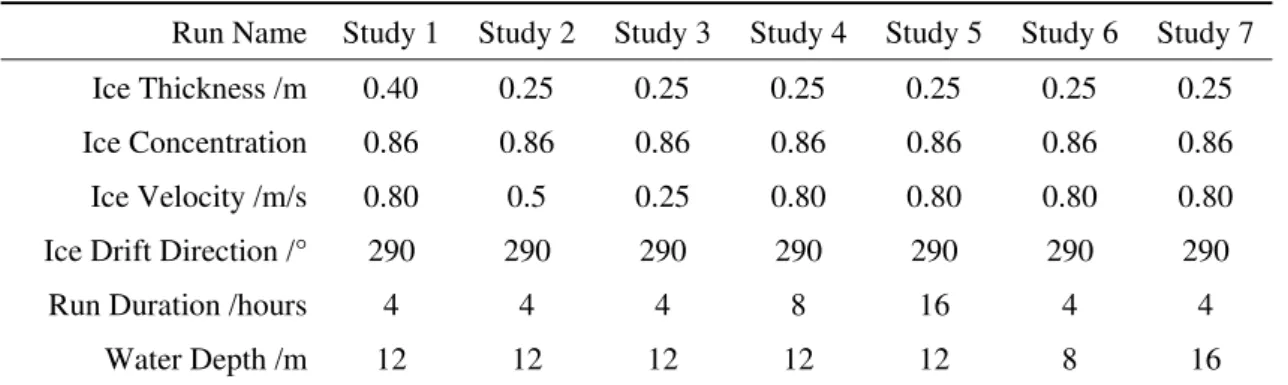
Once the Isserk I-15 rubble field had been re-created, other runs could be performed to examine how changes in factors such as water depth, ice thickness, ice velocity and fetch length influence the growth of grounded rubble fields. For this small parametric study, the factors that were examined are shown in Table 2. The simulations are variations of Event 1, which is used for comparison purposes.
491
Fig.3 Visualization of the numerical modelling recreation of the Isserk I-15 rubble field, Events 1 through 6
Event 1 Event 2
Event 3 Event 4
492
Table 2 Run parameters for rubbling study events
Run Name Study 1 Study 2 Study 3 Study 4 Study 5 Study 6 Study 7
Ice Thickness /m 0.40 0.25 0.25 0.25 0.25 0.25 0.25
Ice Concentration 0.86 0.86 0.86 0.86 0.86 0.86 0.86
Ice Velocity /m/s 0.80 0.5 0.25 0.80 0.80 0.80 0.80
Ice Drift Direction /° 290 290 290 290 290 290 290
Run Duration /hours 4 4 4 8 16 4 4
Water Depth /m 12 12 12 12 12 8 16
Run results are depicted in Fig. 4 and Fig. 5, which show plan and profile views of the rubble at the end of each simulation. Note that thickness is total ice thickness, comprising both the keel and sail portions of the rubble. The study runs generally produced results that were anticipated at the outset. That is, Study 1, with thicker ice, produced a more extensive rubble pile, more quickly when compared to the base case of Event 1. The rubble pile-up was also more extensive at the side of the structure. Study 2 and Study 3, which had lower ice velocities, were not able to generate as much rubble. Running the program for longer (Studies 4 and 5) did not produce significantly more rubble than Event 1. With shallower water (Study 6), the rubble build-up was more substantial than the base case, although the rubble heights were smaller. The average thickness was approximately 12 m. Deeper water (Study 7) resulted in a less extensive rubble pile-up around the structure. The total thickness was such that grounding still occurred, however, along with high sail heights near the structure. Generally, the maximum ice thickness appeared to be in the order of 20 m. With a water depth of 12 m, this means that the maximum sail heights were around 8 m. Individual peaks did occur that were higher than this value. With the exception of Study 7, at the deeper water depth, these were up to about 17 m in some cases.
Event 1
493 Study 2 Study 3 Study 4 Study 5 Study 6 Study 7
Fig.4 Plan views of rubble extent and thickness for study events. Note that the ice thickness shown is total ice thickness, hence the large heights as compared to the structure. The
494 Study 1 Study 2 Study 3 Study 4 Study 5 Study 6 Study 7
Fig.5 Variations in total rubble thickness and extent for study events. Note that the structure was centred on X=75 nodes (as in previous plots, 1 node=4 m), so the plot shows
495
IMPLICATIONS FOR ICE RUBBLE GENERATION AND EVACUATION Simulation data can be used to quantify the effects of ice rubble on reducing ice loads in the winter and provide guidance on rubble stability and optimal rubble field extent for evacuation concerns in the Canadian Beaufort Sea. For example, knowing predominant wind direction, ice thickness and velocity at a given location, this data may be used to investigate how changes in these parameters may affect ice loading on various structure designs, through the formation and amount of rubble around the structure. The effect of structure shape and water depth on rubble build-up may also be examined. Once a design has been finalized, the anisotropy, extent and height of rubble build-up can be examined to determine optimal topside placement of EER systems, potential rate of growth of the rubble and how the presence of rubble impacts supply boat access and survival craft deployment. Overall, such studies are useful for providing guidance on rubble stability and rubble field extent.
ACKNOWLEDGEMENTS
Funding provided by the PERD Marine Transportation and Safety POL is gratefully acknowledged. This paper is part of a research program to investigate the influence of ice rubble as it pertains to offshore platforms in the Canadian Beaufort Sea.
REFERENCES
Barker, A., Timco, G. Sayed, M. , Wright, B.D. (2000). Numerical Simulation of the “Kulluk” In Pack Ice Conditions. Proceedings IAHR’00, Gdansk, Poland.
Barker, A. , Timco, G.W. (2003). The Effect of Structure Shape on the Broken Ice Zone Surrounding Offshore Structures. Proceedings POAC’03, Trondheim, Norway. Barker, A.,Timco, G.,Wright, B.D. (2006). Traversing Grounded Rubble Fields by Foot – Implications for Evacuation. Cold Regions Science and Technology, doi:10.1016/j.coldregions.2006.06.001, 46: 79-99.
Barker, A., Timco, G.,Wright, B.D. (2007). Assessment of the Viability of On-Ice Evacuation Shelters in the Beaufort Sea. Proceedings POAC’07, Dalian, China. Gulf Canada Resources Limited (1990) Molikpaq at Isserk I-15, 1989/90, Operations Report, Major Projects Department. Calgary, Canada.
Poplin, J.P.,Weaver, J.S. (1991) Ice force and rubble-related research studies at Isserk I-15. ERCL RS.91.15, Research and Technology Division, Esso Resources Canada Limited. Calgary, Canada.
496
Sayed, M., Carrieres, T. (1999). Overview of a New Operational Ice Forecasting Model, ISOPE ’99. Brest, France.
Sayed, M., Frederking, R., Barker, A. (2000) Numerical Simulation of Pack Ice Forces on Structures: a Parametric Study. Seattle, U.S.A.