HAL Id: hal-00295935
https://hal.archives-ouvertes.fr/hal-00295935
Submitted on 8 Jun 2006
HAL is a multi-disciplinary open access
archive for the deposit and dissemination of
sci-entific research documents, whether they are
pub-lished or not. The documents may come from
teaching and research institutions in France or
abroad, or from public or private research centers.
L’archive ouverte pluridisciplinaire HAL, est
destinée au dépôt et à la diffusion de documents
scientifiques de niveau recherche, publiés ou non,
émanant des établissements d’enseignement et de
recherche français ou étrangers, des laboratoires
publics ou privés.
in orographic wave clouds over Scandinavia during
INTACC experiment
A. C. Targino, R. Krejci, K. J. Noone, P. Glantz
To cite this version:
A. C. Targino, R. Krejci, K. J. Noone, P. Glantz. Single particle analysis of ice crystal
residu-als observed in orographic wave clouds over Scandinavia during INTACC experiment. Atmospheric
Chemistry and Physics, European Geosciences Union, 2006, 6 (7), pp.1977-1990. �hal-00295935�
www.atmos-chem-phys.net/6/1977/2006/ © Author(s) 2006. This work is licensed under a Creative Commons License.
Chemistry
and Physics
Single particle analysis of ice crystal residuals observed in
orographic wave clouds over Scandinavia during INTACC
experiment
A. C. Targino1,*, R. Krejci1, K. J. Noone2, and P. Glantz1,**
1Department of Meteorology, Stockholm University, 106 91, Stockholm, Sweden 2IGBP Secretariat Royal Swedish Academy of Sciences, 104 05, Stockholm, Sweden *now at: Department of Chemistry, University of York, YO10 5DD, York, UK
**now at: Department of Applied Environmental Science, Stockholm University, 106 91, Stockholm, Sweden Received: 5 July 2005 – Published in Atmos. Chem. Phys. Discuss.: 5 September 2005
Revised: 22 March 2006 – Accepted: 22 March 2006 – Published: 8 June 2006
Abstract. Individual ice crystal residual particles col-lected over Scandinavia during the INTACC (INTeraction of Aerosol and Cold Clouds) experiment in October 1999 were analyzed by Scanning Electron Microscopy (SEM) equipped with Energy-Dispersive X-ray Analysis (EDX). Samples were collected onboard the British Met Office Her-cules C-130 aircraft using a Counterflow Virtual Impactor (CVI). This study is based on six samples collected in oro-graphic clouds. The main aim of this study is to characterize cloud residual elemental composition in conditions affected by different airmasses. In total 609 particles larger than 0.1 µm diameter were analyzed and their elemental compo-sition and morphology were determined. Thereafter a hierar-chical cluster analysis was performed on the signal detected with SEM-EDX in order to identify the major particle classes and their abundance. A cluster containing mineral dust, rep-resented by aluminosilicates, Fe-rich and Si-rich particles, was the dominating class of particles, accounting for about 57.5% of the particles analyzed, followed by low-Z particles, 23.3% (presumably organic material) and sea salt (6.7%). Sulfur was detected often across all groups, indicating ageing and in-cloud processing of particles. A detailed inspection of samples individually unveiled a relationship between ice crystal residual composition and airmass origin. Cloud resid-ual samples from clean airmasses (that is, trajectories con-fined to the Atlantic and Arctic Oceans and/or with source altitude in the free troposphere) were dominated primarily by low-Z and sea salt particles, while continentally-influenced airmasses (with trajectories that originated or traveled over continental areas and with source altitude in the continen-tal boundary layer) contained mainly mineral dust residuals.
Correspondence to: A. C. Targino
Comparison of residual composition for similar cloud am-bient temperatures around −27◦C revealed that supercooled clouds are more likely to persist in conditions where low-Z particles represent significant part of the analyzed cloud residual particles. This indicates that organic material may be poor ice nuclei, in contrast to polluted cases when ice crys-tal formation was observed at the same environmencrys-tal con-ditions and when the cloud residual composition was dom-inated by mineral dust. The presented results suggest that the chemical composition of cloud nuclei and airmass origin have a strong impact on the ice formation through heteroge-neous nucleation in supercooled clouds.
1 Introduction
Aerosol-induced climate forcing is a combination of two ef-fects, namely the direct and indirect efef-fects, acting together to alter the amount of solar radiation that reaches the Earth’s surface. The former effect arises from the scattering and ab-sorption processes by aerosol particles, and the latter is a result of microphysical processes that modulate cloud prop-erties, such as cloud albedo and cloud lifetime. While the direct effect has been studied extensively, the indirect effect still remains poorly understood and an accurate estimate of its impact on the climate has not been provided yet (IPCC, 2001).
The difficulty to estimate the indirect aerosol effect esti-mate lies partly on the complexity of the chemical and physi-cal processes acting in clouds, since clouds are multiphase systems in which gaseous compounds, interstitial aerosol particles and liquid droplets coexist. The problem can be-come even more complicated when mixed phase clouds
(mixture of ice particles and supercooled water droplets) are considered. These types of clouds are abundant in mid-latitude frontal systems and occur frequently also as oro-graphic clouds. They are formed when the airflow is forced over a mountain or high ground and, as a consequence, stable gravity waves or trapped mountain lee waves can develop.
Most of the results reporting in situ measurements of ice crystal residuals have been obtained in cirrus clouds (e.g., Noone et al., 1993; Heintzenberg et al., 1996; Petzold et al., 1998; Seifert et al., 2003). The relatively longer lifetime of orographic clouds, as compared to e.g., cirrus or stratus clouds, as well as the specific airflow through the cloud, gives the possibility to use them as a natural flow reactor for stud-ies of aerosol-cloud interactions. Orographic clouds reside longer over one point and do not move with the airmass, thus facilitating a detailed inspection of the unperturbed system in this semi-stationary regime. In many studies the charac-terization of aerosols and cloud droplets in the cloud multi-phase systems has been approached by using bulk analysis technique (e.g., Georgii and Kleinjung, 1967; Grosch and Georgii, 1976; Hallberg et al., 1994), but little is known about the chemical composition of the aerosol particles ac-tivated into cloud elements. Since cloud properties are deter-mined by aerosol-cloud interactions at the individual particle level, approaches that use bulk technique to describe these in-teractions will not be able to capture the details necessary to better understand the processes that actually determine cloud properties. Few studies, however, have been dedicated to the direct measurement and characterization of the chemical composition of ice elements in supercooled clouds.
Ice elements in clouds have several possible origins and generating mechanisms (Vali, 1985). There is a number of observational and modeling studies describing the most fa-vorable conditions for the generation of cold clouds by ho-mogeneous nucleation, that is, the spontaneous freezing of supercooled liquid droplets when water molecules become arranged into an ice embryo. Heymsfield and Miloshevich (1993) reported observations carried out in wave clouds and concluded that homogeneous nucleation dominates at tem-peratures below −35◦C. Jensen et al. (1998) corroborated this hypothesis by modeling two of Heymsfield and Miloshe-vich’s cases. They found that homogeneous freezing domi-nated at temperatures between −37 and −62◦C.
In this study, we focus on heterogeneous ice nucleation processes, that is, the formation of ice crystals from a preex-isting liquid cloud droplet, observed during the INTACC (IN-Teraction of Aerosol and Cold Clouds) experiment. Field et al. (2001) showed that during the INTACC a relatively warm regime (temperatures >−35◦C) dominated the observation period, and as a consequence homogeneous freezing rates were strongly reduced and heterogeneous nucleation could have prevailed. Cooper and Vali (1981) made observations in mountain cap clouds at the temperature range from −15 to −20◦C, concluding that heterogeneous nucleation was the main mechanism forming ice crystals. There are different
pathways how ice crystal formation can occur. However, it is beyond the scope of this paper to describe the glaciation pro-cesses in the clouds. The main thrust of the present work is to characterize the chemical composition of individual resid-ual particles found in ice crystals and to assess to what extent particles with different compositions can facilitate heteroge-neous ice formation in the troposphere.
2 The INTACC experiment
2.1 Sample collection
Ice crystal residual particles were collected on board the British Met Office C-130 Hercules aircraft during the IN-TACC experiment, which took place in October 1999 over northern Scandinavia. The INTACC was implemented to yield a better understanding on how ice particles are formed in orographic clouds over the Scandinavian mountains and in thin-layered clouds associated with mid-latitude frontal sys-tems. The flight operations were based at the Swedish Air Force Base (F4) in ¨Ostersund (63.17◦N, 14.29◦E), Sweden. The aircraft was equipped with a number of instruments to investigate cloud microphysics, aerosol properties and gas-phase chemistry. A general description of the instrumenta-tion package used in the experiment is provided by Field et al. (2001).
During the INTACC a total of 15 mission flights were per-formed between 1 and 19 October 1999. The mission flights were typically 4 h in duration at altitudes between 4 and 8 km, with a cruising speed of 150 m s−1. The wave clouds were sampled with straight level runs parallel to the wind at different heights with crosswind runs upwind and downwind of the cloud. Although flight patterns varied, each entailed a combination of ascending and descending profiles and con-stant altitude legs stretching over northern Sweden and Nor-way, enabling characterization of cloud elements in different airmasses. The aircraft location was determined from an on-board Global Positioning System (GPS).
This paper presents results of the Single Particle Analy-sis (SPA) of ice crystal residuals collected using a Counter-flow Virtual Impactor (CVI). The operational principle of the CVI (Noone et al., 1988) is to direct a counterflow of dry particle free air in opposite direction to the motion of the aircraft. Small non-activated (interstitial) aerosol particles, which enter the CVI, initially with a relative velocity equal to the air speed, have insufficient inertia to penetrate the coun-terflow to a stagnation plane where the airflow velocity be-comes zero. On the other hand, cloud droplets or ice crystals with radius larger than approximately 3.5 µm have enough inertia to reach and penetrate through the stagnation plane. Cloud elements were evaporated inside the probe dry coun-terflow air leaving behind residual aerosol particles. Each crystal is assumed to leave only one residual particle behind, which has proven to be a valid assumption (Hallberg et al.,
1992; Glantz et al., 2003; Seifert et al., 2003). Measure-ments of the evaporated water from droplets and ice crys-tals using a dual-channel Lyman-α hygrometer (Noone et al., 1993) yielded information about the cloud water con-tent (CWC). Cloud residuals for subsequent SPA were col-lected on 25 mm Nuclepore polycarbonate membrane filters with a pore diameter of 0.4 µm. The active sampling area was reduced to 7 mm in diameter using a Teflon mask sup-porting the filter from below. This reduction in the sampling area helps to enrich particle concentration on the sampling spot area and thus facilitates the analysis with the Scanning Electron Microscope (SEM). The filters were loaded in pairs into a custom-made filter holder and exposed predominantly during flight legs at constant altitude. Sampling times var-ied from 10 to 80 min. Interstitial aerosol particles samples as well as aerosol samples upwind and downwind the oro-graphic clouds were also collected and they will be discussed in a separate paper.
2.2 Single particle analysis
Prior to the analysis, the 7 mm diameter sampling spot was cut from the rest of the filter and mounted on a 2 cm diam-eter aluminum stub using conductive double-sided adhesive tape. A thin carbon coating was applied onto the sample sur-face to prevent the buildup of electric charge on the sample. The filter handling and preparations were carried out in clean chamber to avoid contamination.
SPA was performed using a Scanning Electron Micro-scope Philips XL 30 ESEM-FEG equipped with Energy Dis-persive X-ray Analysis (EDX) at the Department of Geology and Geochemistry, Stockholm University. The X-ray detec-tor consisted of a windowless Si(Li) detecdetec-tor with a spectral resolution of 157 eV at 5.9 KeV (Mn Kα). The detector was
calibrated with multielemental standards prior the analysis. The typical X-ray count rate during the analyses varied from 500–600 X-ray counts per second at an electron accelerat-ing voltage between 20 and 25 kV. The X-ray spectrum was accumulated for 100 s, excluding dead time of the detector. Because of the carbon (C) coating used and the presence of light elements like C and oxygen (O) in the filter substrate, only elements with atomic number Z≥11 (sodium, Na) were considered in the analysis.
The selection of the particles for elemental analysis was performed manually using a secondary electron image. The filter area was divided into octants and the analysis started in the middle of the sampling spot and continued along each radius line towards the edge of sampling spot. For each rec-ognized particle with size larger than ∼0.1 µm, its length and width were measured, regardless its size or shape. The mean Martin’s diameter (Hinds, 1999), defined as the length of the horizontal line that appears to divide the particle into halves was used to size them, where “horizontal” refers to the appar-ent position of the particle in the field of view of the SEM.
Eight cloud samples were collected during 10 missions flown between 1 and 19 October 1999, of which six were used in this study. About 110 particles were analyzed per sample, except for one sample where only 75 particles were identified due to low aerosol loading. The number of par-ticles analyzed in this study is relatively low, compared to other studies, where an automated procedure to recognize the particles was used (e.g., de Bock et al., 2000; Liu et al., 2000). However, as the deposition of the particles on the fil-ters can be described as a stochastic process and the same analytical procedure has been employed for all filters, we assume that the results are not biased and that each sample analyzed is a good representation of the whole particle popu-lation on the filter. This assumption was tested by analyzing additional equal number of residual particles on two replicate filters. Results of this comparison are discussed later in this paper (see Sect. 3.2). A similar technique of particle selec-tion has been used by Krejci et al. (2004).
One question that arises when performing SEM on ice crystals residuals is the susceptibility to contamination due to ice crystals etching the interior of the CVI probe and generat-ing submicron stainless steel particles (Murphy et al., 2004). The dataset was thus treated in a way that allowed ruling out any corruption of the samples that might be produced from this kind of etching process. Initially, the SEM-EDX analysis was performed on fragments of the porous stainless steel used in the CVI to determine its composition. The most abundant elements in the CVI alloy are chromium (Cr), iron (Fe) and nickel (Ni), while silicon (Si), sulphur (S), molyb-denum (Mo) and manganese (Mn) appear as faint signatures in the spectra. The ratios among the EDX peak counts of Cr, Fe and Ni are very stable (Fe/Ni: from 5.5 to 8.7, Fe/Cr: from 3.26 to 3.82 and Cr/Ni from 1.44 to 2.59). These elements have been chosen to represent typical signatures of stain-less steel residues, since they have the smallest analysis and spectra fitting error (highest peak-to-background ratio). Any particle showing elemental composition within these ranges should be regarded as a result of the impactation process and extirpated from the dataset.
A simple methodology was used to screen the whole dataset (609 particles) in order to identify these particles. Particles resulting from abrasion of the CVI walls should contain at least 60% of Fe, which is roughly the amount found in a 316 grade stainless steel. The first selection cri-terion was to retain only particles with Fe concentrations larger than 60%. As a result, 58 particles (9.5% of the ini-tial dataset) could be classified as possible artifacts. Seifert et al. (2003) have discussed that particles containing trace amounts of Si, Na, Ca, and Al in addition to Fe, Cr and Ni are not a product of crystal impact, as it is unlikely that stain-less steel particles would mix with any other material during the impactation. Following this criteria and a further require-ment that Cr and Ni should also be present, the number of Fe-Cr-Ni containing particles dropped to 17 (2.8% of the ini-tial dataset). Out of these, 8 particles showed Fe/Ni, Fe/Cr
1 2 3 4 5 6 0 5 10 15 20 25 30 35 40 45 50
Filter 1: flight A718
Group Particles in group (%) 1 2 3 4 5 6 0 10 20 30 40 50 60
Filter 2: flight A727
Group
Particles in group (%)
analysis 1 analysis 2
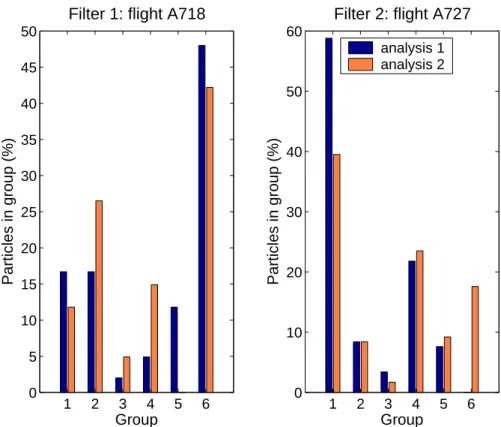
Fig. 1. Percentage of particles falling into each category for the two duplicate samples
analyzed on Flight A718 (filter 01) and on Flight A727 (filter 02). The abundance of
the elements in each group is shown in more detail in Table 5 (for analyses 1).
29
Fig. 1. Percentage of particles falling into each category for the two duplicate samples analyzed on Flight A718 (filter 01) and on Flight
A727 (filter 02). The abundance of the elements in each group is shown in more detail in Table 5 (for analyses 1).
and Cr/Ni ratios derived from EDX peak counts in the range that matched those from our probe. They have thus been dis-carded from our dataset. Thus, the final dataset is comprised of 601 particles.
An unavoidable limitation of the SEM-EDX analysis in a high vacuum mode is that highly volatile material present in the aerosol particles might evaporate. As a result some particles might shrink or deform, or even disappear com-pletely. Particles potentially affected have not been treated in any specific way as part of the analysis. Therefore the abundances of certain groups should be seen as upper limit.
3 Results and discussion 3.1 Hierarchical cluster analyses
Hierarchical cluster analysis has been used for identifica-tion of the particle groups based on their elemental composi-tion. Following the methodology employed in previous stud-ies (e.g., Artaxo et al., 1992; Liu et al., 2000; Sobanska et al., 2002), the X-ray intensities were used as inputs for the clustering algorithm. For each particle, the elemental X-ray intensities were normalized to the sum of the intensities of detected peaks for each particle (the sum of all characteristic X-rays set equal to 100%). Clustering has the advantage of
forming natural groups (or classes) without any prior classi-fication of the dataset. The method starts by considering the
ndata points (in this case, n particles) as individual clusters, and at each step the two more similar particles are merged into a single cluster. The new dataset of n-1 objects is again analyzed until the whole data set is reduced to one large class containing all data points. The similarity between two parti-cles was derived using the Euclidian distance coefficient and the Ward’s error sum method (Ward, 1963) was employed as the clustering criterion. This criterion proposes that at any stage of the partition the loss of information due to the clus-tering can be measured by the sum of the square deviations of each point. Other criteria have also been tested, including nearest neighbor and furthest neighbor, but they yielded an unclear separation of the particles.
3.2 Data representativity
After screening for possible corruption of the dataset through etching the CVI probe, a second step was to assess the rep-resentativity of the samples by performing additional SPA on equal number of residual particles on two previously an-alyzed filters (collected during INTACC flights A718 and A727). The conceptual principle in analyzing two sets of particles on the same sample is that the surveys of both anal-yses should provide, in ideal case, equal information about
Table 1. Percentage of the individual groups found on two single particle analyses performed separately on the same sample of flight A718. Analysis 1 Analysis 2 Elements % Elements % Na-Cr-S 16.7 Na-Cr-S 11.8 Na-Si-S-Cl-K-Ca 16.7 Na-Si-S-Ca 26.5 Fe 2.0 Fe 4.9 S (low Z) 4.9 S (low Z) 14.9 Mg-Si-Ca 11.8 – – Low Z 48.0 Low Z 42.2
Particle Number of Particle Number of
fraction particles fraction particles
All 102 All 102
Submicrometer 15 Submicrometer 14
Supermicrometer 87 Supermicrometer 88
Table 2. Percentage of the individual groups found on two single particle analyses performed separately on the same sample of flight A727.
Analysis 1 Analysis 2 Elements % Elements % Cr-Fe-Ni 58.8 Cr-Fe-Ni 39.5 Na-Mg-S-Cr-Ni 8.4 Na-Mg-S-Cr-Ni 8.4 Low Z 3.4 Low Z 1.7 Al-Si-S 21.8 Al-Si-S 23.5
S (low Z) 7.6 Si-S (low Z) 9.2
– – Na-P-S-Ca 17.6
Particle Number of Particle Number of
fraction particles fraction particles
All 119 All 119
Submicrometer 79 Submicrometer 78
Supermicrometer 40 Supermicrometer 41
the particle population being sampled or the degree of uncer-tainty in different particle groups abundances.
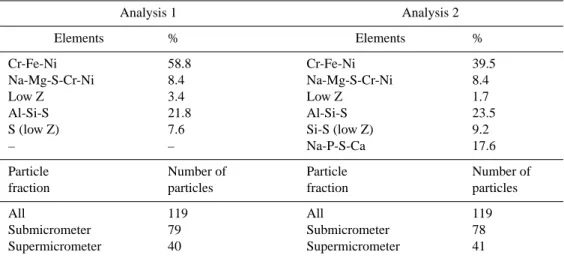
The assessment of the data representativity for each filter was done by applying cluster analysis on the signal detected with SEM-EDX separately for both datasets. On the first analysis of the filter from flight A718 (referred to as filter 1), 102 particles were analyzed and six groups were identified, while on the second analysis 102 particles were analyzed and the clustering procedure yielded five groups. A group com-posed of magnesium (Mg), Si and calcium (Ca), representing 11.8% of the particles, is the only group not present in the results of the second analysis (Table 1). The two analyses of 118 particles performed on the filter from flight A727 (referred to as filter 2) yielded similar groups, with the dis-tinction that a group composed of Na and S, accounting for 17.6% of the particles analysed in the second set of
parti-cles, was not observed during the first analysis (Table 2). With regards to the size distribution of the particles, it was found almost no difference in the number of particles iden-tified in each size fraction on either analysis, as depicted in Tables 1 and 2. We used a two-sample Kolmogorov-Smirnov test to determine whether there were any statistically signif-icant differences in the duplicate samples. The percentage of particles falling into each category for the two duplicate samples was treated as frequency distributions (as shown in Fig. 1). The two-sample Kolmogorov-Smirnov test uses the cumulative distributions for the two variables (the duplicate samples) to compare the proportion of the two variables less than a given value, and test whether the maximum differ-ence in the cumulative distributions is greater than a critical value. The null hypothesis is that the distributions are the same, and the alternate hypothesis in our case is that they are
G1: 24% G2:19% G3: 14% G4: 9% G5: 3% G6: 9% G7: 14% G8: 7% 1 2 3 4 5 6 7 8 0 20 40 60 80 100 Element fraction (%) G1: 7% G2: 20% G3: 15% G4: 13% G5: 12% G6: 5% G7: 7% G8: 13% G9: 8% 1 2 3 4 5 6 7 8 9 0 20 40 60 80 100 Element fraction (%) G1: 18% G2: 13% G3: 8% G4: 17% G5: 5% G6: 4% G7: 15% G8: 14% G9: 7% Na Mg Al Si P S Cl K Ca Ti Cr Mn Fe Ni Cu Zn low Z
INTACC SEM analysis − Cloud samples clustering
1 2 3 4 5 6 7 8 9 0 20 40 60 80 100 Element fraction (%) Groups
Fig. 2. Hierarchical cluster analysis results for ice crystal residuals. Top row: all
particle sizes; middle row: submicrometer fraction, and bottom row: supermicrometer
fraction. The color bar shows the abundance of the different elements in each of the
clusters, which are shown in more detail in Table 3. Description of the specific
particle groups can be found in section 3.3.
30
Fig. 2. Hierarchical cluster analysis results for ice crystal residuals. Top row: all particle sizes; middle row: submicrometer fraction, and
bottom row: supermicrometer fraction. The color bar shows the abundance of the different elements in each of the clusters, which are shown in more detail in Table 3. Description of the specific particle groups can be found in Sect. 3.4.
different. We used the Matlab® software package to apply the Kolmogorov-Smirnov test at the p=0.05 and 0.01 levels. The null hypothesis was not rejected for any of the cases,
in-dicating that there was no statistically significant difference in the duplicate samples. In other words, analyzing about 100 particles or 2 times as much on each sample does not make
a significant difference for defining distinct particle group abundances.
3.3 Particle elemental classification
The cluster analysis has been applied separately to the whole cloud sample population (601 particles) as well as to particles larger and smaller than 1 µm (supermicron and submicron fractions, respectively). This allows an efficient way to iden-tify the elements most commonly found in each of the two size fractions. It is noteworthy that the EDX method used in this study can quantify only elements with atomic number larger or equal to 11 (Na). Light elements, like C, nitrogen (N) and O cannot be quantified because of the carbon coat-ing and polycarbonate nature of the filter. Particles that did not contain significant amounts of detectable elements with Z>11 are referred to as “low-Z” particles. Although hierar-chical cluster analysis is an objective technique, in the sense that the distance between elements and the clustering criteria are based on mathematical measures, the interpretation of the results is subjective. The grouping is based on the arbitrary selection of the number of clusters present in the dataset. In this study, the choice was based on the chemical composition of each cluster (expressed as percentages of the elemental X-ray intensities of each element in the cluster) as well as the morphology of the particles.
3.4 Global classification
Eight different particle groups could be identified in the com-bined dataset from the cloud residual samples (601 particles). Table 3 summarizes the dominant clusters derived from all filter data with the average composition for the elements found in each cluster. The values were obtained by averaging over all samples. It is also shown how the particles are dis-tributed into sub- and supermicrometer fractions within each defined group. Figure 2 shows the average relative abun-dance of the different particle types as well as for the sub-and supermicrometer fractions. Examples of secondary elec-tron images of residual ice crystal particles observed during INTACC are shown in Fig. 3.
3.4.1 Fe-rich (Group 1)
The Fe-rich group is the largest cluster and constitutes almost 25% of the particles analyzed. These particles are character-ized by the presence of Fe comprising roughly 60% of the characteristic X-ray spectrum. They appear mostly in the submicron fraction as two distinct sub-groups. One group contains impurities as Na (6%), Si (8%), Cr (8%) and Ni (9%) in addition to Fe (48%), and another has characteristics of pure iron oxide. Even though the latter holds some Cr and Ni, their proportions are not in the range of those from the CVI probe, and are not thus regarded as a result of etching processes, as discussed in Sect. 2.2.
3.4.2 Aluminosilicates (Group 2)
This is the second largest cluster group and constitutes al-most 20% of the particles analyzed. Particles in this group are characterized by the presence of aluminum (Al) (16%), Si (49%) and Fe (7%), whose X-rays sum up to more than 80% of the characteristic X-ray signal detected. 63 particles appear in the submicron fraction while 56 are present in the supermicrometer fraction. The supermicrometer fraction is further divided into two sub-groups, one of which is made up of Al (21%), Si (53%) and Fe (8%), while the other shows a more complex combination of Mg, Al, S, Ca, Cr and Fe in addition to Si (29%).
3.4.3 Low-Z particles (Group 3)
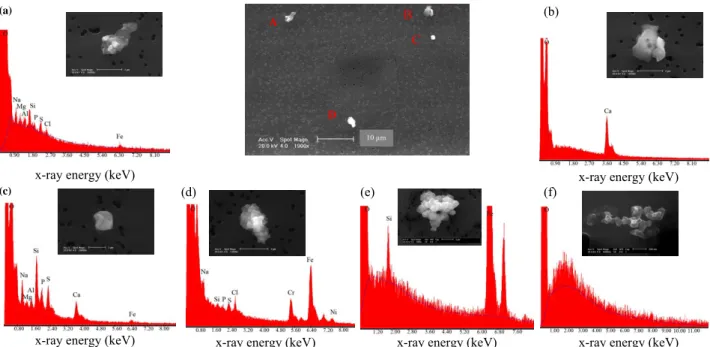
Low-Z (Z<11) particles comprise 14.3% of the total num-ber of particles analyzed. “Low-Z” and “organic” will be used interchangeably here and will denote particles that do not contain significant amounts of detectable elements with Z>11. Even though EDX analysis can identify elements lighter than Na, the polycarbonate nature of the filter hin-ders using these results because it is difficult to distinguish between C-O-N peaks from the particles and from the fil-ter substrate. Inspection of the X-ray spectra only allows differentiating between particle classes (e.g., between miner-als, calcites, sea salts and low-Z elements). The X-ray spec-tra of this kind of particles were characterized by background signal without significant elemental peaks (see Fig. 3F). Spectra with this feature have been described in the litera-ture as typical for organic and biological material (e.g., Ma-mane and Noll, 1985; Xhoffer et al., 1991). Ascertaining the organic nature of the particles turns out to be impossible because of these limitations, but previous studies have sug-gested that fly ash, soot agglomerates, biogenic debris and ammonium nitrate can compose this group (Xhoffer et al., 1991; Krejci et al., 2004). We have ruled out the presence of ammonium nitrate since the cases whereby the low-Z parti-cles were identified were linked to airmass trajectories of ma-rine origin (see Sect. 3.5). Ammonium nitrate is a continental phenomenon with concentrations that decreases from coast to open sea. Local contributions have also been ruled out since over most of Scandinavia annual average nitrate con-centrations are lower than 0.5 µg/m3 (Schaap et al., 2002). Based on this and on the indirect evidence presented in this paper, we can state that the particles in this group are organic aerosol particles. Low-Z particles appear equally distributed in both size modes studied here, with 43 particles presenting the supermicrometer mode and 44 in the submicrometer. In-spection of the morphology reveals that there were a variety of shapes and textures among the low-Z particles. Some of them had amorphous shape with small spheres attached to one another to form relatively large flakes of soot.
(a)
x-ray energy (keV)
(b)
x-ray energy (keV) (c)
x-ray energy (keV)
(d)
x-ray energy (keV)
(e)
x-ray energy (keV)
(f)
x-ray energy (keV)
B
A
C
D
10 µm
Fig. 3. Secondary electron images and EDX spectra of residual ice crystals collected during INTACC. Inserts A., B., C., and D., are detailed
micrographs of the larger micrograph shown in the upper row, middle column. Inserts E. and F. do not appear in the larger micrograph.
31
Fig. 3. Secondary electron images and EDX spectra of residual ice crystals collected during INTACC. Inserts (A), (B), (C), and (D), are
detailed micrographs of the larger micrograph shown in the upper row, middle column. Inserts (E) and (F) do not appear in the larger micrograph.
Table 3. Average relative abundance (%) and composition of the individual particle groups (G) of ice crystal residual collected on six
INTACC flights. The numbers in parenthesis are mean percent of X-ray counts. Only elements with number of counts larger than 5% are shown.
G All particles Submicrometer Supermicrometer
Elements (% number % Elements (% number % Elements (% number %
of X-ray counts) of X-ray counts) of X-ray counts)
1 Na(5) Si(5) Cr(7) Fe(58) Ni(8) 24.1 Cr(5) Fe(85) Ni(4) 7.2 Na(6) Cl(6) Cr(6) Fe(59) Ni(10) 17.7
Na(6) Si(8) Cr(8) Fe(48) Ni(9)
20.4
2 Al(16) Si(49) S(8) Fe(7) 19.5 Al(17) Si(50) S(13) Fe(5) 14.9 Al(21) Si(53) Fe(8) 13.1
Mg(7) Al(9) Si(29) S(10)
Ca(7) Cr(9) Fe(8)
8.1
3 Low Z (100) 14.3 Low Z (100) 12.6 Low Z (100) 16.5
4 S(100) (low Z) 9.0 S(99) (low Z) 12.3 S(100) (low Z) 5.0
5 Si(24) S(63) (low Z) 3.3 Na(6) Si(26) S(58) (low Z) 4.6 Na(14) Si(7) S(62) (low Z) 4.2
6 Si(84) 8.7 Al(10) Si(81) 7.2 Mg(6) Si(82) 14.6
7 Na(33) S(20) Cl(25) Cr(14) 14.4 Na(15) S(20) Cl(25)
Cr(28) Fe(5)
13.0 Na(34) S(20) Cr(18) K(8)
Cr(14)
14.3
8 Na(5) Mg(8) Al(22) Si(7) S(18)
Ca(11) Ti(22) Ni(7)
6.7 Na(9) Mg(8) Al(26) Si(6)
S(10) Ca(5) Ti(31) Ni(5)
8.0 Al(71) S(4) Cl(7) 6.5
3.4.4 Si and S-enriched low-Z particles (Groups 4 and 5)
About 12% of the particles analyzed are composed of light atomic number elements and Si-, or S-bearing compounds.
The X-ray spectra of this kind of particles were character-ized by high background signal, that is, without significant elemental peaks, except for weak emission lines of S (Group 4) and both Si and S (Group 5). Particles with weak emission
line corresponding to S were found mostly in the submicron fraction. It is difficult to establish their sources, but one possibility is that they may have biological origin. It has been observed that biological particles (composed of light elements such as hydrogen (H), C, O and N) with their com-plex morphology and wet surfaces provide suitable nucleat-ing surface for SO2absorption and conversion to sulfate, as well as deposition of submicrometer sulfates on the surface of these particles (Mamane and Noll, 1985).
3.4.5 Si-rich (Group 6)
This group of more pure silicates (probably quartz SiO2) ac-counts for 9% of the particles analyzed having composition of Si larger than 80%. The remaining 20% is distributed among Na, Mg, Al, phosphorus (P) and S. 36 particles ap-peared in the coarse fraction and 17 in the fine fraction. This cluster does not contain significant levels of S, as detected in other groups dominated by minerals (like group 8). The explanation why some minerals are more susceptible to sul-fate enrichment than others can lie on the chemistry of the particle surface as well as on the time available for the re-action as well as on source region. Only particles with the appropriate surface chemistry and which were suspended in the air for a long period (and thus, probably subject to cloud processing) can react with SO2(see e.g., Reid et al., 2003, and references therein about Saharan dust).
3.4.6 Transformed sea-salt particles (Group 7)
The sodium, chlorine and chromium-rich group comprising 14% of the analyzed particles is also rich in S. These parti-cles are identified as aged sea salt and can be interpreted as a result of cloud processing. Fitzgerald (1991) has stated that marine aerosol particles cycle several times through cloud formation and evaporation processes, leading to sulfur ex-cess in the particles and enrichment of several compounds at individual particle level. In this study, 13% of the submi-crometer particles belong to this group, while 14.3% make up the supermicrometer fraction.
3.4.7 Mixed particles (Group 8)
This small group accounts for 7% of the particles analyzed and appears in both sub- and supermicrometer fractions. They show a varied combination of Na, Mg, Al, Si, Ca and Ti. They may result from an aggregation of particles in the at-mosphere. The most correct way of interpreting these groups is probably by viewing them as a continuum of clay minerals rather than individual species. In addition to these elements, S contributes with about 18% to the average composition in-dicating that these are presumably aged particles. Mamane et al. (1980) and Levin et al. (1996) showed that dust particles generated in the desert areas could be transported over dis-tances of hundreds and even thousands of kilometers, with-out resuspension and sulfate could be formed on the surface
of mineral dust particles. Cloud processes, such as gas scav-enging and liquid phase oxidation of SO2and coagulation of drops containing sulfate with those containing mineral dust, are responsible for the sulfate coating (Reid et al., 2003). 3.5 Particle classes and association to airmass history The airmass history for the INTACC missions was obtained using 5-day back trajectory from the HYSPLIT model of the National Oceanic and Atmospheric Administration (NOAA) (Draxler and Rolph, 2003). During the INTACC mission flights investigated here the prevailing airmasses arriving at the measurement area originated over North America, North Atlantic and Arctic. A clean marine airmass is thus defined as trajectories confined to the Atlantic and Arctic Oceans and/or with source altitude in the free troposphere (FT), having traveled under unperturbed conditions for the entire length of the 5-day transport time. Mixed airmass refers to trajectories that originated or traveled over continental areas and with source altitudes in the continental boundary layer (BL).
The trajectories were calculated for locations were the fil-ters were exposed (based on information from the in-flight logbook) with varying arrival height in order to cover the flight altitudes, which ranged from 4 to 8 km. The trajec-tory classification is summarized in Table 4. In order to as-sess the geographical variability of the airmasses, trajectories were obtained for other points along the flight track. The re-sults (not shown here) indicate that in some cases there is a considerable difference in the origin of the airmass between those arriving at F4 air base in ¨Ostersund and other points along the flight track. Hence any attempt to link airmass his-tory with residual composition should take into account the location where the filter has been exposed.
Results of the single particle analysis from individual sam-ples chosen to illuminate the possible relations between air-mass history and ice formation are presented below.
3.5.1 Clean airmass a. Flight 718
The filter of flight A718 was exposed over a region south of F4 air base and over Norway. The trajectories arriving between 4 and 6 km originated in the marine boundary layer (MBL) over the North Atlantic and 24 h before reaching the measurement area traveled over the UK. Because the height of these trajectories was in the FT as they passed over the UK, we assume that they were not recently affected by any anthropogenic pollution source and can be classified as clean airmass. The cloud residual clusters found in the filter collected during this flight were low-Z (48%), silicates (12%), low-Z coated with S (5%), aged sea salt (17%), aged chromine-sodium compounds (17%) and Fe (2%) (Table 5).
Table 4. Summary of INTACC flights used in this study with the type of airmasses reaching the arrival points along the flight track.
Flight Date Arrival
height (Km)
Origin Arrival point Travelling over
A718 1 Oct 4 5 6 BL BL FT
61◦N, 6.5◦E North Atlantic and
UK A720 3 Oct 6 7 8 FT FT FT 63.2◦N, 14.3◦E North America,
North Atlantic and UK A723 7 Oct 6 7 8 BL FT FT
62.3◦N, 4.6◦E North America and
North Atlantic A724 8 Oct 6 7 8 FT FT FT
62.7◦N, 9.2◦E North America and
North Atlantic A727 13 Oct 5 6 7 BL FT FT 67.7◦N, 19◦E Western Russia 3.5.2 Mixed airmass a. Flights A720 and A724
Flights A720 and A724 were affected by mixed air-masses that originated over North America. Mineral dust in the form of Fe-, Si-rich particles and aluminosilicates account for about 88% and 92% of crustal elements in flights A720 and A724, respectively. Low-Z elements represented a very small fraction of the dataset in both flights (Table 5). b. Flight A723
The trajectories arriving at 6 km originated in the MBL of the northeastern coast of the USA and Canada and ascended steadily in the atmosphere as it moved over the North Atlantic. It was largely influenced by the MBL during the first two days over the ocean and possibly by continental sources earlier. The trajectories arriving at 7 and 8 km started over the USA and Canada and were confined to the FT.
During this flight, two filters were exposed at almost the same location close to the Norwegian coast, but in opposite flight direction. Filter 5 was sampled upwind of the cloud, on stepwise descent from 8.5–6.8 km, thereafter filter 6 was exposed downwind of the cloud, following a similar stepwise descent.
The particles found on filter 6 shows characteristics of ma-rine influenced airmass, with 31% of the dataset containing Na-Cl, and about 36% made up of low-Z particles. The third largest group (13.5%) was formed by Si, Na (not associated with Cl) and S. About 19% of the particles were composed of some kind of crustal material (Table 5).
Mineral dust is, however, prevalent on filter 5, with Fe-rich cluster comprising 34.9% of the observations, and aluminosilicates accounting for 27.4%. Other minor groups of mineral dust are Fe-Mn-Cr (2.8%) and Al-Si coated with S (9.4%). Low-Z particles contribute with 15% and sea-salt with 10.4% (Table 5).
c. Flight A727
Flight A727 was performed along a south-north axis, extending as far as 67.7◦N, 19◦E (where the filter was exposed). The trajectories reaching the measurement region originated over Turkey, traveled within the BL over Russia, thereafter it ascended reaching northern Scandinavia. The terrestrial influence on the ice crystals composition is clearly seen through the SPA clustering for this flight. The abundance of mineral dust in this sample is 89%, while the rest 11% is comprised of low-Z and low-Z S-bearing particles (Table 5).
Table 5. Average relative abundance (%) and composition of the individual particle groups (G) of ice crystal residual collected on INTACC
flights affected by clean and mixed airmasses. The numbers in parenthesis are mean percent of X-ray counts. Only elements with number of counts larger than 5% are shown.
Flight G1 G2 G3 G4 G5 G6 G7 G8
A718 16.7 16.7 2.0 4.9 11.8 48.0 – –
(% number of X-ray counts) Na(40)
S(19) Cr(35) Na(27) Si(8) S(25) Cl(10) K(6) Ca(6) Cr(6) Fe(85) S(100) (low Z) Mg(9) Si(71) Low Z (100) A720 11 1.8 17.4 4.6 2.8 24.8 27.5 10.1
(% number of X-ray counts) Na(6)
Al(11) Si(34) P(7) S(33) S(41) Ca(56) Na(8) Mg(7) Al(7) Si(14) S(7) Cr(14) Fe(31) Na(21) Mg(24) Al(6) Si(8) S(5) Fe(24) Ni(9) Al(66) Si(7) S(7) Cl(9) Al(17) Si(62) Fe(7) Si(6) Cl(6) Cr(8) Fe(58) Ni(10) Low Z (100) A723 (Filter 5) 9.4 2.8 8.5 10.4 27.4 6.6 34.9 –
(% number of X-ray counts) Al(10)
Si(15) P(7) S(49) Ca(11) S(12) Cr(62) Mn(8) Fe(12) S(100) (Low Z) Na(48) S(11) Cl(40) Al(14) Si(58) S(12) Low Z (100) Na(5) Cr(6) Fe(68) Ni(8) A723 (Filter 6) 31.1 6.8 6.8 5.4 13.5 6.8 29.7 –
(% number of X-ray counts) Na(24)
S(16) Cl(58) Na(32) Mg(11) S(7) Ca(28) Zn(7) P(6) Cr(5) Fe(73) 14(6) Na(10) Ti(83) Na(6) Al(5) Si(65) S(14) Low Z (100) Si(6) S(82) (low Z) A724 13.3 0.9 32.7 2.6 5.3 1.8 43.4 –
(% number of X-ray counts) Na(14)
Mg(16) Si(6) Cl(7) Cr(8) Fe(23) Ni(18) Ti(100) Al(17) Si(56) Fe(9) Al(71) Si(8) Cl(6) Si(15) S(40) Ca(34) Low Z (100) Si(5) Cl(5) Cr(7) Fe(60) Ni(9) A727 58.8 8.4 3.4 21.8 7.6 – – –
(% number of X-ray counts) Cr(8)
Fe(82) Na(27) Al(5) Si(6) S(28) Cr(17) Fe(6) Low Z (100) Al(12) Si(70) S(10) S(96) (low Z)
4 Discussions
The results of the SPA of cloud residuals collected on IN-TACC flights affected by different airmasses are now put into a broader context and discussed in light of the cloud phase for the same missions reported by Field et al. (2001). They have shown that the relatively warm regime (temperatures
>−35◦C) observed during INTACC reduced homogeneous
freezing rates while heterogeneous ice nucleation prevailed. They described the microphysical characteristics of five IN-TACC flights carried out in wave clouds at approximately the same environmental temperature (T∼−27◦C) and showed that the cloud investigated during flight A718 was the only case where no ice formation was observed. A connection between cloud phase and the chemical nature of the aerosol was suggested by Field et al. (2001). Interestingly, in the SPA results presented in this work, A718 was the case with the highest concentration of low-Z particles among the cases investigated. Given that the flights were performed under similar thermodynamical conditions, the composition of the aerosol particles on which the cloud droplets were formed is suggested as a possible important factor that determines the cloud phase.
It is well established that oceans are a major source of or-ganic compounds (e.g., Novakov et al., 1997; Rivera-Carpio et al., 1996) and the presence of surfactants, such as pro-tein degradation products in marine aerosol, was shown by Blanchard (1964). It was found by Blanchard (1964) that surface-active organic material is adsorbed or scavenged by the bubbles as they rise toward the water surface. No-vakov et al. (1997) have shown that the volatility proper-ties of the marine organic aerosols are different from those observed in, for example, continental combustion-influenced regions and renders these particles active CCN. In their study, 70% of the marine organic carbon mass was found to be water-soluble compounds, such as fatty and carboxylic acids. Matsumoto et al. (1997) found that not only sulfates but also water-soluble organic salts (formate, acetate, oxalate and methanesulphonic acid) were dominant in fine marine aerosols (aerodynamic diameter<1.1 µm) and that there was a correlation between the concentration of these compounds and CCN concentrations. Moreover, organic residuals were also identified in cloud condensation nuclei of marine strat-iform clouds in anthropogenically-influenced air during the Monterey Area Ship Track experiment (MAST) (de Book et al., 2000; Noone et al., 2000; Russell et al., 2000).
The apparent ability of organic aerosol to serve as cloud condensation nuclei can be explained through two pathways. The first is that a fraction of these particles may be hy-drophilic and have thus a critical supersaturation similar to that of ammonium sulfate. A second possibility is that or-ganic aerosols are inherently inactive and that condensation of H2SO4 vapor, or some other water-soluble species, onto these particles makes them efficient CCN (Novak and Pen-ner, 1993).
Since the airmass of flight A718 originated in the MBL over the North Atlantic, it is reasonable to suggest that the source of these organic particles is the marine region. They may have been injected in the atmosphere through sea spray and bubble bursting or derived from organic vapor emissions from the surfactant layer, which undergoes gas-to-particle conversion (nucleation and condensation). Not all marine organic aerosol particles act as CCN, but if the organic par-ticles observed on this flight have had solubility similar to that reported by Novakov et al. (1997), this suggests that they may be a major contributor to the formation of cloud droplets. On the other hand, Cziczo et al. (2004) have shown that organic components do not partition equally to the ice and aqueous phases. Instead, organic-rich particles prefer-entially remain unfrozen and we therefore believe that the organic nature of the residual particles is the main reason why ice crystals have not been observed on this flight. It is uncertain how this can happen, but Yeh and Feeney (1996) suggested several mechanisms by which antifreeze proteins, such as those found in polar fish that survive freezing con-ditions, inhibit bulk ice formation. Cziczo et al. (2004) pro-posed that atmospheric aerosols contain organic molecules with similar properties as those found in the marine biota, and which can lead to ice growth inhibition as well as to altered growth aspects. As stated before, we are unable to specify the kind of organic material present, but with respect to previous measurements (e.g., Krejci et al., 2004) and the data shown here we can speculate that similar anti-freezing properties may apply to the low-Z residual particles.
Because the size of the particles analyzed was restricted by the detection limit of the SEM (about 0.1 µm), the data shown here represents a minor fraction of residuals, as the majority of them (in terms of number) are smaller than 100 nm diameter. However this may not impair the inter-pretation of the results found, as in the temperature regime observed during the experiment, the aerosols were first ac-tivated into liquid cloud droplet with subsequent formation of ice crystal. This way, a substantial fraction of the aerosol volume, which is dominated by particles larger than 0.1 µm, was incorporated in the cloud droplets.
Even though the above analysis is a simple study, our SPA results together with the microphysical analysis of Field et al. (2001) complement each other and support the hypothesis of ice crystal inhibition induced by organic material as well as a relationship among airmass origin, particle composition and cloud phase.
5 Summary and concluding remarks
A survey of 609 cloud residual particles larger than 0.1 µm diameter, collected in orographic clouds over Scandinavia, were analyzed using the SEM-EDX technique. Mineral dust in the form of iron (24.1%) and aluminosilicates (19.5%) followed by low-Z particles (23.3%) (presumably organic
material) and sea salt (6.7%) were the main groups identified by using hierarchical cluster analysis applied to the X-ray in-tensities of all particles analyzed.
A key result found in this study is the link among residual cloud elements, airmass history and cloud phase. Two fil-ters sampled under clear airmass conditions were dominated by low-Z and sea-salt elements, while those exposed during flights affected by mixed airmasses were dominated by min-eral dust in the form of Fe-, Si-rich particles and aluminosil-icates. The implications of the difference in cloud residual composition between these two types of airmass for cloud formation were quite pronounced when the cloud phase ob-served was compared for observation with similar thermo-dynamic conditions. In the marine-influenced clean airmass case the cloud remained liquid, while ice crystals were ob-served in the cases where mineral dust was the predominant aerosol residual. The former effect is believed to be due to the high organic aerosol loading in the marine air, which makes up a significant portion of the cloud condensation nu-clei, facilitating droplet formation on one hand but inhibiting heterogeneous ice nucleation processes on the other hand. In the latter case, mineral dust coated with sulfates facilitated ice formation.
These results strongly suggest that organic aerosols can function as efficient CCN but its presence can delay or in-hibit heterogeneous ice crystal formation, especially under atmospheric background conditions with low abundance of more suitable ice nuclei, like mineral dust.
The sources and the chemical components of organic aerosol (and their precursor acids) that act as CCN and alter hygroscopic behavior of atmospheric particles must be deter-mined and mapped in order to assess their potential for cloud formation and modulation of cloud phase. This should have a considerable impact on the estimates of the cloud-mediated climate forcing due to changes in aerosol load and composi-tion in the atmosphere.
Acknowledgements. Financial support for this work was given by
the European Union under contract ENV4-CT97-0549. We thank
the support from the Swedish Air Force (F4) in ¨Ostersund and the
Swedish Meteorological service for the meteorological lee-wave forecasting during INTACC. The Royal Air Force aircrew of the MRFC-130 is also thanked for their assistance and cooperation in making successful atmospheric measurements during INTACC. Thanks also to M. Ahlbom from the Department of Geology and Geochemistry, Stockholm University for assistance on the operation of the SEM.
Edited by: Y. Rudich
References
Artaxo, P., Rabello, M. L. C., Maenhaut, W., and van Grieken, R.: Trace elements and individual particle analysis of
atmo-spheric aerosols from the Antarctic peninsula, Tellus 44B, 318– 334, 1992.
Blanchard, D. C.: Sea-to-air transport of surface-active material, Science, 146, 396–397, 1964.
de Bock, L. A., Joos, P. E., Noone, K. J., Pockalny, R. A., and van Grieken, R. E.: Single Particle Analysis of aerosols, observed in the marine boundary layer during the Monterey Area Ship Tracks Experiment (MAST), with respect to cloud droplet formation, J. Atmos. Chem., 37, 299–329, 2000.
Cooper, W. and Vali, G.: The origin of ice in mountain cap clouds, J. Atmos. Sci., 38, 1244–1259, 1981.
Cziczo, D. J., DeMott, P. J., Brooks, S. D., Prenni, A. J., Thom-son, D. S., Baumgardner, D., WilThom-son, J. C., Kreidenweis, S. M., and Murphy, D. M.: Observations of organic species and atmospheric ice formation, Geophys. Res. Lett., 31, L12116, doi:10.1029/2004GL019822, 2004.
Draxler, R. R. and Rolph, G. D.: HYSPLIT (HYbrid Single-Particle Lagrangian Integrated Trajectory) Model access via NOAA ARL READY Website (http://www.arl.noaa.gov/ready/hysplit4.html), NOAA Air Resources Laboratory, Silver Spring, MD, 2003. Field, P. R., Cotton, R. J., Noone, K., Glantz, P., Kaye, P. H., Hirst
E., Greenway, R. S., Jost, C., Gabriel, R., Reiner, T., Andreae, M., Saunders, C. P. S., Archer, A., Choularton, T., Smith, M., Brooks, B., Hoell, C., Bandy, B., Johnson, D., and Heymsfield, A.: Ice Nucleation in orographic wave clouds: Measurements made during INTACC, Q. J. R. Meteorol. Soc., 127, 1493–1512, 2001.
Fitzgerald, J. W.: Marine aerosols: A review, Atmos. Environ., 25A, 533–545, 1991.
Glantz P., Noone, K. J., and Osborne, S. R.: Comparisons of air-borne CVI and FSSP measurements of cloud droplet number concentrations in marine stratocumulus clouds, Aerosol Sci. and Technol., 20(1), 133–142, 2003.
Georgii, H. W. and Kleinjung, E.: Relations between the chemical composition of atmospheric aerosol particles and the concentra-tion of natural ice nuclei, J. Rech. Atmos., 3, 145–156, 1967. Grosch, M. and Georgii, H. W.: Elemental composition of
atmo-spheric aerosols and natural ice forming nuclei, J. Rech. Atmos., 10, 227–232, 1976.
Hallberg, A., Ogren, J. A., Noone, K. J., Heintzenberg, J., Berner, A., Solly, I., Kruisz, C., Reischl, G., Fuzzi, S., Facchini, M. C., Hansson, H. C., Wiedensohler, A., and Svenningsson, I. B.: Phase partitioning for different aerosol species in fog, Tellus 44B, 545–554, 1992.
Hallberg, A., Ogren, J. A., Noone, K. J., Okada, K., Heintzenberg, J., and Svenningsson, I. B.: The influence of aerosol particle composition on cloud droplet formation, J. Atmos. Chem., 19, 153–171, 1994.
Heintzenberg, J., Okada, K., and Str¨om, J.: On the composition of non-volatile material in upper tropospheric aerosols and cirrus, Atmos. Res., 41, 81–88, 1996.
Heymsfield, A. J. and Miloshevich, L. M.: Homogeneous ice nucle-ation and supercooled liquid water in orographic wave clouds, J. Atmos. Sci., 50(15), 2335–2353, 1993.
Hinds, W. C. Aerosol technology – Properties, behavior and mea-surement of airborne particles, 483, John Wiley & Sons, New York, 1999.
Intergovernmental Panel on Climate Change (IPCC): Climate Change 2001: The Scientific Basis, edited by: Houghton, T.,
Ding, Y., Griggs, D. J., Noguer, M. P., van der Linden, J., et al., Cambridge University Press, New York, 2001.
Jensen, E. J., Toon, O. B., Tabazadeh, A., Sachse, G. W., Anderson, B. E., Chan, K. R., Twohy, C. W., Gandrud, B., Aulenbach, S. M., Heymsfield, A., Hallett, J., and Gary, B.: Ice nucleation pro-cesses in upper tropospheric wave-clouds observed during SUC-CESS, Geophys. Res. Lett., 25, 1363–1366, 1998.
Krejci, R., Str¨om, J., de Reus, M., and Sahle, W.: Single parti-cle analysis of the accumulation mode aerosol over the northeast Amazonian tropical rain forest, Surinam, South America, Atmos. Chem. Phys. Discuss., 4, 533–568, 2004.
Levin, Z., Ganor, E., and Gladstein, V.: The effects of desert particles coated with sulfate on rain formation in the eastern mediterranean, J. Appl. Meteorol., 35, 1511–1523, 1996. Liu, X., van Espen, P., Adams, F., Cafmeyer, J., and Maenhaut, W.:
Biomass burning in southern Africa: individual particle charac-terization of atmospheric aerosols and savanna fire samples, J. Atmos. Chem., 36, 135–155, 2000.
Mamane, Y. and Noll, K. E.: Characterization of large particles at a rural site in the eastern United States: Mass distribution and individual particle analysis, Atmos. Environ., 19, 611–622, 1985. Mamane, Y., Ganor, E., and Donagi, A. E.: Aerosol composition of urban and desert origin in the Eastern Mediterranean – I. Individ-ual particle analysis, Water Air Soil Pollut., 14, 29–43, 1980. Matsumoto, K., Tanaka, H., Nagao, I., and Ishizaka, Y.:
Contribu-tion of particulate sulfate and organic carbon to cloud conden-sation nuclei in the marine atmosphere, Geophys. Res. Lett., 24, 655–658, 1997.
Murphy, D. M., Cziczo, D. J., Hudson, P. K., Thomson, D. S., Wil-son, J. C., Kojima, T., and Buseck, P. R.: Particle generation and resuspension in aircraft inlets when flying in clouds, Aerosol Sci. and Technol., 38, 401–409, 2004.
Noone, K. J., Ogren, J. A., Heintzenberg, J., Charlson, R. J., and Covert, D. S.: Design and calibration of a counterflow virtual impactor for sampling of atmospheric fog and cloud droplets, Aerosol Sci. and Technol., 8, 235–244, 1988.
Noone, K. B., Noone, K. J., Heintzenberg, J., Str¨om, J., and Ogren, J. A: In situ observations of cirrus cloud microphysical proper-ties using the counterflow virtual impactor, J. Atmos. Oceanic Technol., 10, 294–303, 1993.
Noone, K. J., ¨Ostr¨om, E., Ferek, R. J., Garrett, T., Hobbs, P. V.,
Johnson, D. W., Taylor, J. P., Russell, L. M., Flagan, R. C., Sein-feld, J. H., O’Dowd, C. D., Smith, M. H., Durkee, P. A., Nielsen, K., Hudson, J. G., Pockalny, R. A., De Bock, L., van Grieken, R. E., Gasparovic, R. F., and Brooks, I.: A case study of ships forming and not forming tracks in moderately polluted clouds, J. Atmos. Sci., 57(16), 2729–2747, 2000.
Novakov, T. and Penner, J. E.: Large contribution of organic aerosols to cloud-condensation-nuclei concentrations, Nature, 365, 823–826, 1993.
Novakov, T., Corriga, C. E., Penner, J. E., Chuang, C. C., Rosario, O., and Mayol Bracero, O. L.: Organic aerosols in the Caribbean trade winds: a natural source?, J. Geophys. Res., 102(D17), 21 307–21 313, 1997.
Petzold, A., Str¨om, J., Ohlsson, S., and Schr¨oder, F. P.: Elemen-tal composition and morphology of ice crysElemen-tal residues in cirrus clouds and contrails, Atmos. Res., 49, 21–34, 1998.
Russell, L. M., Noone, K. J., Ferek, R. J., Pockalny, R. A., Flagan, R. C., and Seinfeld, J. H.: Combustion organic aerosol as cloud condensation nuclei in ship tracks, J. Atmos. Sci., 57(16), 2591– 2606, 2000.
Reid, E. A., Reid, J. S., Meier, M. M., Dunlap, M. R., Cliff, S. S., Broumas, A., Perry, K., and Maring, H.: Characterization of African dust transported to Puerto Rico by individual particle size segregated bulk analysis, J. Geophys. Res., 108(D19), 8591, doi:10.1029/2002JD002935, 2003.
Rivera-Carpio, C. A., Corrigan, C. E., Novakov, T., Rogers, C. F., and Chow, J. C.: Derivation of contributions of sulfate and car-bonaceous aerosols to cloud condensation nuclei from mass size distributions, J. Geophys. Res., 101(D14), 19 483–19 493, 1996. Seifert, M., Str¨om, J., Krejci, R., Minikin, A., Petzold, A., Gayet, J.-F., Schumann, U., and Ovarlez, J.: In situ observations of aerosol particles remaining from evaporated cirrus crystals: Comparing clean and polluted airmasses, Atmos. Chem. Phys., 3, 1037– 1049, 2003.
Schaap, M., Muller, K., and ten Brink, H. M.: Constructing the Eu-ropean aerosol nitrate concentration field from quality analysed data, Atmos. Environ, 36, 8, 1323–1335, 2002.
Sobranska, S., Pauwels, B., Maenhault, W., and Adams, F.: Single particle characterization and sources of tropospheric aerosols in the Negrev desert (Israel), J. Phys. IV France, 12, doi:10.1051/jp4:20020458, 2002.
Vali, G.: Nucleation terminology, Bull. Amer. Meteor. Soc., 66, 1426, 1985.
Ward, J. H.: Hierarchical grouping to optimize an objective func-tion, J. Amer. Assoc., 58, 236–244, 1963.
Xhoffer, C., Bernard, P., and van Grieken, R.: Chemical character-ization and source apportionment of individual aerosol particles over the North Sea and the English Channel using multivariate techniques, Environ. Sci. Technol., 25, 1470–1478, 1991. Yeh, Y. and Feeeny, R. E.: Antifreeze proteins: structures and
mech-anisms of function, Chem. Rev., 96, 601–617, 1996.