HAL Id: inserm-02529778
https://www.hal.inserm.fr/inserm-02529778
Submitted on 2 Apr 2020
HAL is a multi-disciplinary open access
archive for the deposit and dissemination of
sci-entific research documents, whether they are
pub-lished or not. The documents may come from
teaching and research institutions in France or
abroad, or from public or private research centers.
L’archive ouverte pluridisciplinaire HAL, est
destinée au dépôt et à la diffusion de documents
scientifiques de niveau recherche, publiés ou non,
émanant des établissements d’enseignement et de
recherche français ou étrangers, des laboratoires
publics ou privés.
(MITF) Regulates Immune Cell Migration into
Melanoma
Gabriela Wiedemann, Celina Aithal, Angelina Kraechan, Constanze Heise,
Bruno Cadilha, Jin Zhang, Peter Duewell, Robert Ballotti, Stefan Endres,
Corine Bertolotto, et al.
To cite this version:
Gabriela Wiedemann, Celina Aithal, Angelina Kraechan, Constanze Heise, Bruno Cadilha, et al..
Microphthalmia-Associated Transcription Factor (MITF) Regulates Immune Cell Migration into
Melanoma. Translational Oncology, Elsevier, 2019, 12 (2), pp.350-360. �10.1016/j.tranon.2018.10.014�.
�inserm-02529778�
Microphthalmia-Associated
Transcription Factor (MITF)
Regulates Immune Cell
Migration into Melanoma
Gabriela M Wiedemann*,†, 1, 2, Celina Aithal*, 1, 2, Angelina Kraechan*, 2, Constanze Heise*, 2,
Bruno L Cadilha*, 2, Jin Zhang*, 2, Peter Duewell*, 2, Robert Ballotti‡, 3, Stefan Endres*, 2,
Corine Bertolotto‡, 3 and Sebastian Kobold*, 2
*
Center of Integrated Protein Science Munich (CIPS-M) and Division of Clinical Pharmacology, Klinikum der Universität München, Lindwurmstrasse 2a, 80337 Munich, Germany; †Department of Medicine II, Klinikum rechts der Isar, Technische Universität München, Germany;‡INSERM U1065 (Team 1), C3M, Biology and Pathologies of Melanocytes, 151, route Saint Antoine de Ginestière, BP2 3194, 06204 NICE Cedex3
Abstract
Microphthalmia-associated transcription factor (MITF) is a key transcription factor in melanoma development and progression. MITF amplification and downregulation have been observed in a significant proportion of melanoma patients and correlate with clinical outcomes. Here, we have investigated the effect of MITF on melanoma chemokine expression and immune cell attraction. In B16F10 melanoma cells, MITF knockdown reduced expression of CXCL10, with concomitantly decreased attraction of immune cells and accelerated tumor outgrowth. Conversely, overexpression of MITF in YUMM1.1 melanoma cells also led to an increased immune cell attraction in vitro. Subcutaneous YUMM1.1 melanomas overexpressing MITF however showed a reduced immune infiltration of lymphocytes and an increased tumor growth. In human melanoma cell lines, silencing of MITF enhanced chemokine production and immune cell attraction, while overexpression of MITF led to lower immune cell attraction. In summary, our results show that MITF regulates chemokine expression in murine and in human melanoma cells, and affects in vivo immune cell attraction and tumor growth. These results reveal a functional relationship between MITF and immune cell infiltration, which may be exploited for cancer therapy.
Translational Oncology (2019)12, 350–360
Introduction
Microphthalmia-associated transcription factor (MITF) is a key transcrip-tional regulator of the melanocyte cell lineage. It is expressed in 80% of human melanomas and plays an important role in melanoma development and progression [1,2]. MITF is known to regulate a diverse range of transcriptional targets including genes involved in cell cycle arrest, DNA repair, proliferation, survival, and apoptosis as well as cell differentiation[3]. Amplification of MITF is found in 15% to 20% of human metastatic melanomas and has been linked to poor survival[4]. Evidence for the role of changes in MITF levels in melanoma is contradictory. High expression of MITF was found in melanoma relapse after combined BRAF and MEK inhibitor therapy[5]. However, resistance to targeted therapy has also been associated with a decreased expression of MITF[6]. Low levels of MITF are associated with increased invasiveness of melanomas but also with cell senescence, whereas high levels result in differentiation [7–13]. These
findings highlight a central regulatory role of MITF in melanoma cell phenotypic versatility and further underline the importance of under-standing its dynamic regulation.
www.transonc.com
Address all correspondence to: Sebastian Kobold, MD, Division of Clinical Pharmacology, Klinikum der Universität München, Lindwurmstraße 2a, 80337 München.
E-mail:[email protected]
1G. M. W. and C. A. contributed equally to this work. 2
Member of the German Center of Lung Research. 3
Equipe labellisée ARC 2015.
Received 29 October 2018; Accepted 31 October 2018
© 2018 The Authors. Published by Elsevier Inc. on behalf of Neoplasia Press, Inc. This is an open access article under the CC BY-NC-ND license ( http://creativecommons.org/licenses/by-nc-nd/4.0/).
1936-5233/19
In the past decade, immunotherapy using checkpoint blocking antibodies has changed the treatment of advanced and metastasized melanoma patients [14]. Their effectiveness demonstrates the importance of the immune system in melanoma therapy. However, melanomas in a significant number of patients either do not respond to checkpoint inhibiting antibodies at all or relapse after initial tumor regression. Primary but also secondary treatment failure may result from a lack of effector T cells at the tumor site and is associated with a bad prognosis [15]. Tumors with low immune cell infiltration are frequently referred to as “cold tumors” as opposed to the immune cell-rich “hot tumors” typically responding well to checkpoint blockade. The origins of these different phenotypes are still poorly understood. There is a need for new therapeutic strategies, which convert poorly infiltrated tumors into“hot tumors”[16].
So far, little is known about the effects of MITF on melanoma immune cell infiltration. It has recently been shown that MITFlow melanomas display an increased response to exogenous TNF resulting in higher infiltration by CD14+ myeloid cells [17]. In addition, in melanoma cells exhibiting a state of senescence due to stable MITF knockdown, an increased expression of the chemokine CCL2 was described favoring proinvasive capacities of melanoma cells in an autocrine manner[12]. These studies suggest that MITF expression levels may affect the melanoma immune landscape. However, no detailed analyses of chemokine expression and immune cell infiltration in melanomas with different MITF expression levels have been performed so far.
In the present work, we investigated the effects of MITF knockdown as well as MITF overexpression in different murine and human melanoma models on chemokine expression and immune cell infiltration, in vitro and in vivo. We demonstrate that MITF downregulation and MITF upregulation result in changes in the chemokine expression profile on both RNA and protein levels. The differential chemokine expression patterns lead to altered immune cell migration towards tumor cells in vitro and correlated with accelerated tumor outgrowth in vivo in both conditions. Thus, our data suggest a role for MITF in regulating tumor immune cell infiltration.
Material and Methods
Mice, Cell Lines, and Animal Experiments
C57BL/6 mice were purchased from Janvier (St. Berthevin, France) or Charles River (Wilmington, MA) and were 5 to 12 weeks of age. All animal studies were approved by the local regulatory agency (Regierung von Oberbayern). The human melanoma cell lines WM8 and WM35 and the murine B16F10 melanoma cell line were described previously
[18–20]. The murine YUMM1.1 cell line[21]was kindly provided by Dr. Bosenberg (Yale University, USA). Cell lines were cultured in complete DMEM or RPMI medium (PAA Laboratories) and were routinely tested for mycoplasma contamination by MycoAlert Myco-plasma Detection Kit (LONZA). For in vivo tumor models, syngeneic tumor cells were injected subcutaneously into the flank of C57BL/6 mice. Mice were sacrificed after 10 to 30 days as indicated. For isolation of tumor-infiltrating lymphocytes, tumors were mechanically disrupted, incubated with 1 mg/ml collagenase and 0.05 mg/mL DNAse (both Sigma Aldrich), and passed through a cell strainer. Single-cell suspensions were directly analyzed or layered on a gradient of 44% Percoll (Biochrome, Berlin, Germany) and 67% Percoll prior to centrifugation at 800×g for 30 minutes.
Flow Cytometry
Multicolor flow cytometry was performed using a BD FACS Canto II or BD LSR Fortessa (BD Bioscience, Germany). Flow cytometry antibodies were purchased from Biolegend (San Diego, CA). Anti-human CD8 was purchased from ThermoFisher Scientific (Waltham, MA). The following antibodies were used: anti-human CD3 (OKT3), anti-human CD4 (OKT4), anti-human CD8 (OKT8), human CD19 (HIB19), human CD56 (5.1H11), anti-human CD11c (Bu15), anti-anti-human CD14 (63D3), anti-mouse CD3 (17A2), anti-mouse CD4 (GK1.5), anti-mouse FOXP3 (MF-14), anti-mouse CD8 (52-6.7), anti-mouse B220 (RA3-6B2), anti-mouse NK1.1 (PK136), anti-mouse CD11c (N418), anti-mouse CD11b (M1/70), and Zombie Aqua Fixable Viability Kit.
siRNA Transfection
siRNA against human and murine MITF has been previously published[22,23]. For human siRNA knockdown of MITF, the MITF-specific sequence 5′-CUUGAUGAUCCGAUUCACC-d (TT)-3′ and the control sequence 5’CGU ACG CGG AAU ACU UCG A-3′ (LuciferaseGL2) were used. For murine siRNA knockdown, the sequence 5′-GGUGAAUCGGAUCAUCAAG-3′ (siMITF) and the control sequence 5′-UUCUCCgAACgUgU-CACgUTT-3′ (siControl) were used. For transfection, a single pulse of 50 nM siRNA was administered to the cells at 50% to 70% confluency by transfection with 5μl of Lipofectamine RNAiMAX in opti-MEM medium (both Invitrogen).
Chemokine ELISA
Chemokine protein levels in tumor cell supernatants were determined by R&D DuoSet ELISA for CCL2, CCL5, and CXCL10 (Mouse CCL2/JE/MCP-1, Mouse CCL5/RANTES, Mouse CXCL10/IP-10/CRG-2 DuoSet ELISA, R&D Systems, Minneapolis, MN). Cell free culture supernatants of YUMM1.1 melanoma cells were collected after 48 hours of culture. Culture medium of B16F10 melanoma cells was changed 48 hours after MITF siRNA transfection, and cell free supernatants were collected after another 48 hours of culture and analyzed according to the manufacturer's protocol. Absorbance was measured at 470 nm using the Mithras-Reader (MikroWin program, version 4.41).
Chemokine Protein Arrays
Chemokine protein levels in tumor cell supernatants or tumor lysates were determined by R&D Proteome Profiler Human/ Mouse Chemokine Array Kits (R&D Systems, Minneapolis, MN) according to the manufacturer's protocol. For lysates, tumors were frozen in liquid nitrogen and mechanically pulverized. Organ powder was resolved in Bio-Rad Cell Lysis Buffer (Bio-Rad, Hercules, CA) and centrifuged at 13,000×g for 30 minutes. Supernatant was collected and stored at −80°C. Protein levels in organ lysates were quantified by Bradford protein assay (Protein Assay Kit, Bio-Rad, Hercules, CA).
Western Blot
For MITF protein levels, cells were lysed after 48 hours of culture using RIPA-Buffer (50 mM Tris/Cl, 150 mM NaCl, 1 mM EDTA, 1% NP-40, 0.25% Na-DOC, 0.1% Protease Inhibitor, pH 7.4). Protein concentration was quantified by Bradford protein assay (Protein Assay Kit, BioRad, Hercules, CA). The lysates were run on a 10% polyacrylamide gel. MITF was detected using anti-MITF (clone
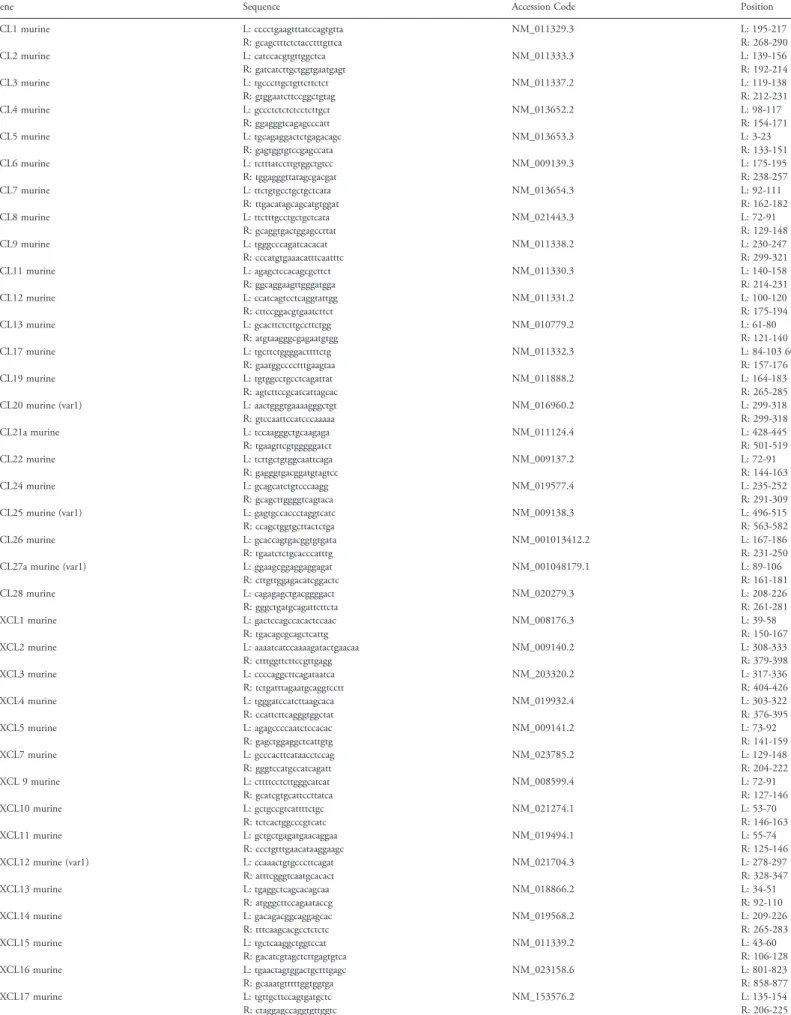
Table 1. Sequences of all primers for RT-PCR used in this study.
Gene Sequence Accession Code Position
CCL1 murine L: cccctgaagtttatccagtgtta NM_011329.3 L: 195-217 R: gcagctttctctacctttgttca R: 268-290 CCL2 murine L: catccacgtgttggctca NM_011333.3 L: 139-156 R: gatcatcttgctggtgaatgagt R: 192-214 CCL3 murine L: tgcccttgctgttcttctct NM_011337.2 L: 119-138 R: gtggaatcttccggctgtag R: 212-231 CCL4 murine L: gccctctctctcctcttgct NM_013652.2 L: 98-117 R: ggagggtcagagcccatt R: 154-171 CCL5 murine L: tgcagaggactctgagacagc NM_013653.3 L: 3-23 R: gagtggtgtccgagccata R: 133-151 CCL6 murine L: tctttatccttgtggctgtcc NM_009139.3 L: 175-195 R: tggagggttatagcgacgat R: 238-257 CCL7 murine L: ttctgtgcctgctgctcata NM_013654.3 L: 92-111 R: ttgacatagcagcatgtggat R: 162-182 CCL8 murine L: ttctttgcctgctgctcata NM_021443.3 L: 72-91 R: gcaggtgactggagccttat R: 129-148 CCL9 murine L: tgggcccagatcacacat NM_011338.2 L: 230-247 R: cccatgtgaaacatttcaatttc R: 299-321 CCL11 murine L: agagctccacagcgcttct NM_011330.3 L: 140-158 R: ggcaggaagttgggatgga R: 214-231 CCL12 murine L: ccatcagtcctcaggtattgg NM_011331.2 L: 100-120 R: cttccggacgtgaatcttct R: 175-194 CCL13 murine L: gcacttctcttgccttctgg NM_010779.2 L: 61-80 R: atgtaagggcgagaatgtgg R: 121-140 CCL17 murine L: tgcttctggggacttttctg NM_011332.3 L: 84-103 60 R: gaatggcccctttgaagtaa R: 157-176 CCL19 murine L: tgtggcctgcctcagattat NM_011888.2 L: 164-183 R: agtcttccgcatcattagcac R: 265-285 CCL20 murine (var1) L: aactgggtgaaaagggctgt NM_016960.2 L: 299-318 R: gtccaattccatcccaaaaa R: 299-318 CCL21a murine L: tccaagggctgcaagaga NM_011124.4 L: 428-445 R: tgaagttcgtgggggatct R: 501-519 CCL22 murine L: tcttgctgtggcaattcaga NM_009137.2 L: 72-91
R: gagggtgacggatgtagtcc R: 144-163 CCL24 murine L: gcagcatctgtcccaagg NM_019577.4 L: 235-252 R: gcagcttggggtcagtaca R: 291-309 CCL25 murine (var1) L: gagtgccaccctaggtcatc NM_009138.3 L: 496-515 R: ccagctggtgcttactctga R: 563-582 CCL26 murine L: gcaccagtgacggtgtgata NM_001013412.2 L: 167-186 R: tgaatctctgcacccatttg R: 231-250 CCL27a murine (var1) L: ggaagcggaggaggagat NM_001048179.1 L: 89-106
R: cttgttggagacatcggactc R: 161-181 CCL28 murine L: cagagagctgacggggact NM_020279.3 L: 208-226 R: gggctgatgcagattcttcta R: 261-281 CXCL1 murine L: gactccagccacactccaac NM_008176.3 L: 39-58 R: tgacagcgcagctcattg R: 150-167 CXCL2 murine L: aaaatcatccaaaagatactgaacaa NM_009140.2 L: 308-333 R: ctttggttcttccgttgagg R: 379-398 CXCL3 murine L: ccccaggcttcagataatca NM_203320.2 L: 317-336 R: tctgatttagaatgcaggtcctt R: 404-426 CXCL4 murine L: tgggatccatcttaagcaca NM_019932.4 L: 303-322 R: ccattcttcagggtggctat R: 376-395 CXCL5 murine L: agagccccaatctccacac NM_009141.2 L: 73-92 R: gagctggaggctcattgtg R: 141-159 CXCL7 murine L: gcccacttcataacctccag NM_023785.2 L: 129-148 R: gggtccatgccatcagatt R: 204-222 CXCL 9 murine L: cttttcctcttgggcatcat NM_008599.4 L: 72-91 R: gcatcgtgcattccttatca R: 127-146 CXCL10 murine L: gctgccgtcattttctgc NM_021274.1 L: 53-70 R: tctcactggcccgtcatc R: 146-163 CXCL11 murine L: gctgctgagatgaacaggaa NM_019494.1 L: 55-74 R: ccctgtttgaacataaggaagc R: 125-146 CXCL12 murine (var1) L: ccaaactgtgcccttcagat NM_021704.3 L: 278-297 R: atttcgggtcaatgcacact R: 328-347 CXCL13 murine L: tgaggctcagcacagcaa NM_018866.2 L: 34-51 R: atgggcttccagaataccg R: 92-110 CXCL14 murine L: gacagacggcaggagcac NM_019568.2 L: 209-226 R: tttcaagcacgcctctctc R: 265-283 CXCL15 murine L: tgctcaaggctggtccat NM_011339.2 L: 43-60 R: gacatcgtagctcttgagtgtca R: 106-128 CXCL16 murine L: tgaactagtggactgctttgagc NM_023158.6 L: 801-823 R: gcaaatgtttttggtggtga R: 858-877 CXCL17 murine L: tgttgcttccagtgatgctc NM_153576.2 L: 135-154 R: ctaggagccaggtgttggtc R: 206-225
TABLE 1 (continued)
Gene Sequence Accession Code Position
XCL1 murine L: agacttctcctcctgactttcct NM_008510.1 L: 24-46 R: gacttcagtccccacacctt R: 79-98 CX3CL1 murine L: catccgctatcagctaaacca NM_009142.3 L: 229-249 R: cagaagcgtctgtgctgtgt R: 287-306 HPRT murine L: cctcctcagaccgcttttt NM_013556.2 L: 105-123 R: aacctggttcatcatcgctaa R: 175-195 CCL1 human L: ttgctgctagctgggatgt NM_002981.2 L: 103-121 R: ctggagaagggtacctgcat R: 148-167 CCL2 human L: agtctctgccgcccttct NM_002982.3 L: 79-96 R: gtgactggggcattgattg R: 153-171 CCL3 human L: tgcaaccagttctctgcatc NM_002983.2 L: 154-173 R: aatctgccgggaggtgta R: 211-228 CCL3L1 human L: tctgcaaccaggtcctctct NM_021006.5 L: 135-154 R: tgtcgggaggtgtagctga R: 192-210 CCL3L3 human L: tctgcaaccaggtcctctct NM_001001437.3 L: 125-144 R: tgtcgggaggtgtagctga R: 182-200 CCL5 human L: tgcccacatcaaggagtattt NM_002985.2 L: 200-220 R: ctttcgggtgacaaagacg R: 254-272 CCL7 human L: gaaagcctctgcagcacttc NM_006273.3 L: 78-97 R: aatctgtagcagcaggtagttgaa R: 165-188 CCL8 human L: ccctcagggacttgctcag NM_005623.2 L: 509-527 R: tctccagcctctggatagga R: 584-603 CCL13 human L: accttcaacatgaaagtctctgc NM_005408.2 L: 67-89 R: ggacgttgagtgcatctgg R: 148-166 CCL14 human L: cgtcagcggattatggatta NM_032962.4 L: 263-283 R: gggttggtacagacggaatg R: 341-360 CCL15 human L: cctctcctgcctcatgctt NM_032965.5 L: 567-585 R: cagtggaagctttgacatcatta R: 638-660 CCL16 human L: gccctgtctctccttgtcct NM_004590.3 L: 95-114 R: gttcacccactcaggaactttt R: 151-172 CCL17 human L: gggagagctgaattcaaaacc NM_002987.2 L: 48-68 R: ggccagcatcttcagtgg R: 136-153 CCL18 human L: atggccctctgctcctgt NM_002988.3 L: 114-131 R: aatctgccaggaggtatagacg R: 167-188 CCL19 human L: gcctgctggttctctggac NM_006274.2 L: 161-179 R: ggatgggtttctgggtcac R: 235-253 CCL20 human (var1) L: atgtgctgtaccaagagtttgc NM_004591.2 L: 71-92
R: tcaaagttgcttgctgcttc R: 143-162 CCL21 human L: tctaccacagacatggctcagt NM_002989.2 L: 73-94
R: agtcctgagcccctccat R: 158-175 CCL22 human L: cgtggtgaaacacttctactgg NM_002990.4 L: 178-199 R: ccttatccctgaaggttagcaa R: 233-254 CCL23 human (var1) L: caccaggaggatgaaggtct NM_145898.3 L: 62-81
R: catcatgaactctgtctctgcat R: 148-170 CCL25 human (var1) L: cctggatgctcgaaataagg NM_005624.3 L: 378-397 R: ttggagtttccagaactcaactt R: 457-479 CCL27 human L: ctcctgagcccagacccta NM_006664.2 L: 105-123 R: gctgagtacagcaggcagtg R: 149-168 CCL28 human L: gagctgatggggattgtgac NM_148672.2 L: 228-247 R: cacagattcttctgcgcttg R: 271-290 Comp. Factor D human L: tccaagcgcctgtacgac NM_001928.2 L: 296-313 R: gtgtggccttctccgaca R: 384-401 CXCL1 human L: tcctgcatcccccatagtta NM_001511.2 L: 340-359 R: cttcaggaacagccaccagt R: 425-444 CXCL2 human L: cccatggttaagaaaatcatcg NM_002089.3 L: 431-452 R: cttcaggaacagccaccaat R: 506-525 CXCL3 human L: gaaaatcatcgaaaagatactgaaca NM_002090.2 L: 444-469 R: ggtaagggcagggaccac R: 537-554 CXCL4 human L: agcctggaggtgatcaagg NM_002619.3 L: 340-358 R: ccattcttcagcgtggctat R: 388-407 CXCL5 human L: ggtccttcgagctccttgt NM_002994.4 L: 185-203 R: acgcagctctctcaacacag R: 273-292 CXCL6 human L: gtccttcgggctccttgt NM_002993.3 L: 233-250 R: gtcagcacagcagagacagg R: 310-329 CXCL7 human L: tgctgctgactgctctgg NM_002704.3 L: 170-187 R: gcatacaagtcactgtctagactttcc R: 237-263 CXCL9 human L: ccttaaacaatttgccccaag NM_002416.1 L: 183-203 R: ttgaactccattcttcagtgtagc R: 232-255 CXCL10 human L: gaaagcagttagcaaggaaaggt NM_001565.3 L: 363-385 R: gacatatactccatgtagggaagtga R: 469-494 CXCL11 human L: agtgtgaagggcatggcta NM_005409.4 L: 214-232 R: tcttttgaacatggggaagc R: 272-291 CXCL12 human L: ccaaactgtgcccttcagat NM_001178134.1 L: 249-268 R: ctttagcttcgggtcaatgc R: 304-323 (continued on next page)
D5, ThermoFisher Scientific, 1:1000) and secondary mouse monoclonal IgG HRP-conjugated antibody (clone HAF007, R&D Systems, 1:2000).β-Actin mouse monoclonal IgG HRP-conjugated antibody (clone C4, Santa Cruz Biotechnology, Santa Cruz, CA; 1:3000) was used as a loading control. Chemiluminescence was measured using Thermo Scientific Super Signal West Pico PLUS Chemiluminescent Substrate (ThermoFisher Scientific, Waltham, MA) with ChemiDoc Imagining Systems (BioRad). Densitometry was performed with Image Lab Software (BioRad).
Semiquantitative Real-Time PCR
Chemokine mRNA in tumor cell lines and tumor lysates was quantified by real-time PCR. RNA from single cell suspensions or tumor lysates was extracted using Trizol Reagent (Life Technologies, Carlsbad, CA) and quantified with the NanoDrop instrument (ThermoFisher Scientific). Reverse transcription of RNA into cDNA was performed with the RevertAid First Strand cDNA Synthesis Kit (Fermentas, St. Leon-Rot, Germany). Chemokine cDNA copies were quantified by real-time PCR and were normalized to HPRT or GAPDH. Real-time PCR was performed with the LightCycler 480 instrument (Roche) using the LightCycler 480 Probes Master. Primers were designed with the Roche Universal ProbeLibrary Assay Design Center and used with the matching probes from the Universal ProbeLibrary Set (Roche, Basel, Switzerland). The primers used for qRT-PCR are listed inTable 1.
In Vitro Migration Assay
Immune cell migration assays were performed using Corning Transwell Plates (3.0μm pore size). Cell-free culture supernatants of human or murine melanoma cells were collected after 48 hours of culture and transferred into the lower chamber. A total of 106freshly isolated human PBMCs or murine splenocytes were resuspended in T cell medium or in RPMI with 0.5% BSA, respectively, and loaded into the upper chamber of the Transwell plates. Migration was allowed for 6 hours at 37°C. After removing the Transwell inserts, cells in the lower chamber were analyzed by flow cytometry. Absolute numbers of migrated cells were calculated by addition of CountBright Absolute Counting Beads (LifeTechnologies).
Transduction of MITF
All constructs were generated by overlap extension PCR and recombinant expression cloning into the retroviral pMP71 vector, as follows: The retroviral vector pMP71 (kindly provided by C. Baum, Hannover) was used for transfection of the ecotropic packaging cell line Plat-E for transduction of murine cell line YUMM1.1 and the packaging cell line Plat-A for the human cell lines. Transduction protocols have been described in detail before[24]. In brief, the packaging cell lines Plat-E or Plat-A were transfected with an MITF-linker-GFP construct, where the linker 2A-sequence was noncleaving through deletion of two amino acids. This allowed to confirm nuclear expression of MITF by confocal microscopy. The produced retrovirus was used to transduce YUMM1.1-, WM8-, and WM35-cells. Transduction efficacy for MITF was controlled by qRT-PCR. The human MITF-M transcript variant 5 (Plasmid #38131, Addgene, Cambridge, MA) was used for transduction of both murine and human cell lines.
Statistics
Statistical analysis was performed with GraphPad Prism Software. Significance was analyzed with unpaired Student's t test or, for tumor growth, with two-way ANOVA with Bonferroni correction. Error bars indicate SEM.
Results
MITF Knockdown and Immune Cell Infiltration in Murine
B16F10 Melanoma
MITF knockdown has been shown to affect secretion of defined cytokines and chemokines from melanoma cells [12,17]. We performed siRNA-mediated knockdown of MITF on B16F10 melanoma cells (Figure 1A), which highly express MITF at baseline, and analyzed mRNA expression of C-C and C-X-C motif chemokines (Supplementary Figure 1A). MITF knockdown was confirmed with Western blot (Supplementary Figure 1B). Chemokine mRNA levels changed in B16F10 cells upon transfection with siRNA targeting MITF (siMITF) as compared to a siRNA control (siControl). CCL17, CCL25, and CXCL4 were upregulated in MITF knock-down B16F10 cells, whereas CCL5 and CXCL10, highly expressed at
TABLE 1 (continued)
Gene Sequence Accession Code Position
CXCL13 human L: tctctgcttctcatgctgct NM_006419.2 L: 97-116 R: tcaagcttgtgtaatagacctcca R: 149-172 CXCL14 human L: aagctggaaatgaagccaaa NM_004887.4 L: 622-641 R: tgacctcggtacctggacac R: 688-707 CXCL16 human L: ttcctatgtgctgtgcaagag NM_022059.2 L: 1255-1275 R: caggtatataatgaaccggcaga R: 1309-1331 CXCL17 human L: accgaggccaggcttcta NM_198477.2 L: 317-334 R: gggctctcaggaaccaatct R: 375-394 gp130 human L: aggaccaaagatgcctcaac NM_002184.3 L: 1097-1116 R: gaatgaagatcgggtggatg R: 1146-1165 iL-16 human L: ggaagggctccctacacg NM_004513.5 L: 1865-1882 R: cacccagctgcaagatttc R: 1960-1978 XCL1 human L: cactctccttgcacagctca NM_002995.2 L: 132-151
R: tctgagacttcactccctacacc R: 226-248 XCL2 human L: actctccctgcacagctcag NM_003175.3 L: 1-20
R: tgagacttcactccctacacctt R: 92-114 MITF human (var5) L: agggagctcacagagtctgaa NM_198158.2 L: 681-702
R: tgttaaatcttcttcttcgttcaatc R: 752-775 GAPDH human (var1) L: agccacatcgctcagacac NM_002046.5 L: 169-187 R: gcccaatacgaccaaatcc R: 216-234
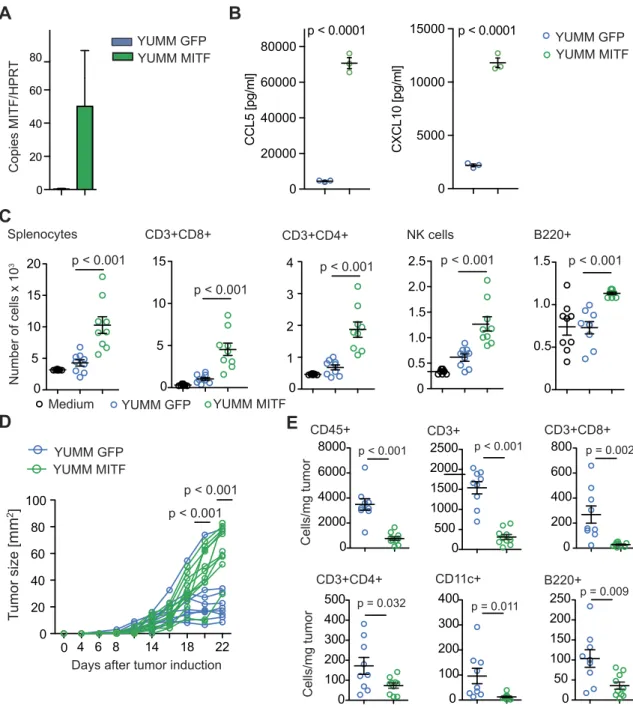
baseline levels, were significantly downregulated both on mRNA (Supplementary Figure 1A) and on protein level (Figure 1B). We next analyzed the effects of MITF knockdown on immune cell migration towards melanoma cells. In vitro, migration of various immune cell subtypes towards supernatants of siMITF-transfected B16F10 cells was reduced as compared to siControl-transfected cells (Figure 1C). In fact, reduction of CD8+ and CD4+ T cells, NK cells, B cells, and CD11c+ dendritic cells (DCs) was most pronounced. In vivo, siMITF-transfected B16F10 cells showed an accelerated growth rate as compared to control-transfected B16F10 cells (Figure 1D). Quantification of tumor-infiltrating immune cells recapitulated in vitro observations, showing lower recruitment of immune cells to the tumor site; overall numbers of CD45+ cells as well as numbers of CD3+ T cells and CD11b+ myeloid cells in MITF knockdown tumors were reduced (Figure 1E). The number of DC and NK cells remained unchanged (Supplementary Figure 1C). Our in vitro results were further confirmed by analyzing protein levels of
intratumoral chemokines; CXCL10 was reduced in siMITF-transfected tumors. In addition, CCL6, CCL8, CCL9/10, CCL12, CCL21, CCL22, CCL27, CCL28, CXCL1, CXCL9, CXCL11, and CX3CL1 were strongly reduced in siMITF-transfected tumors as compared to controls (Supplementary Figure 1D).
MITF Overexpression in YUMM1.1 Melanoma Cells and In
Vitro Immune Cell Migration
We next examined YUMM1.1 melanoma cells, a cell line derived from a genetically engineered mouse model characterized by BRAF activation as well as PTEN and Cdkn2a inactivation, which is considered to mimic characteristics of human melanoma [21]. YUMM1.1 cells express very low levels of MITF at baseline, which make them a suitable tool for MITF overexpression studies. We transduced YUMM1.1 cells with MITF (or GFP as a control) and confirmed overexpression of MITF by qRT-PCR (Figure 2A) and
0 500 1000 1500 CXCL10 [pg/ml] p = 0.0001 0 500 1000 1500 2000 2500 CCL5 [pg/ml] p < 0.0001
B
B16 siControl B16 siMITF 0 200 400 600 800 NK cells p = 0.001 0 200 400 600 B220+ CD11c+ p = 0.019 0 200 400 600 800 1000 p = 0.002A
Splenocytes CD3+CD8+ Number of cells 0 500 1000 1500 2000 2500 0 50 100 150 200 250 0 100 200 300 p = 0.003 p = 0.004 CD3+CD4+ p = 0.003 B16 siControl B16 siMITF 0.0 0.5 1.0 1.5 Copies MITF/HPR T p < 0.001E
CD45+ CD3+CD8+ CD11b+ B16 siControl B16 siMITF 0 4 6 8 11 0 20 40 60 80 0 1000 2000 3000 0 500 1000 1500 0 50 100 150 200 0 500 1000 1500 2000 p < 0.001 CD3+ p = 0.031 p = 0.045 p = 0.051 p = 0.022 T umor size [ mm 2]Days after tumor induction
Cells/mg tumor p = 0.015 p = 0.004 p = 0.006 p = 0.004 p = 0.005 p = 0.004
D
B16 B16 siControl B16 siMITFC
B16 siControl B16 siMITFFigure 1. MITF knockdown in B16F10 melanoma results in altered chemokine levels and immune cell attraction. (A) B16F10 cells were transfected with siControl or MITF siRNA. Bars display MITF copies per HPRT as determined by quantitative RT-PCR. (B) Levels of CCL5 and CXCL10 in supernatants of transfected B16F10 cells were analyzed after 48 hours of culture by chemokine ELISA. (C) A total of 106 C57BL/6 splenocytes were allowed to migrate for 6 hours towards supernatants or RPMI 0.5% BSA and analyzed by flow cytometry. Dots indicate migrated cells per well. (D, E) C57BL/6 mice were injected with 2.5 × 10⁵B16F10 cells transfected with siControl (n = 8) or MITF siRNA (n = 8). (D) Tumor growth over time is displayed. Tumors were harvested on days 11 or 15, and immune cells were analyzed by flow cytometry. (E) Cells per mg tumor are displayed. Panels A to C are representative of three independent experiments. Panels D and E are pooled from two independent experiments.
Western Blot (Supplementary Figure 2B). When analyzing chemo-kine expression in YUMM1.1 cells, we found that MITF overexpression had no significant influence on CCL2 expression (Supplementary Figure 2C) but particularly led to upregulated CCL5 and CXCL10 expression on mRNA (Supplementary Figure 2A) and protein levels (Figure 2B) as compared to control cells. This was paralleled by increased immune cell migration, specifically, of the lymphocyte populations such as CD8+ and CD4+ T cells, B cells, and NK cells, which was induced by supernatants of
MITF-overexpressing YUMM1.1 cells (Figure 2C). No difference in migration was seen for DC and other CD11b+ myeloid cells (Supplementary Figure 2D).
MITF Overexpression and Tumor Growth in YUMM1.1
Melanomas
Next, we injected MITF-transduced YUMM1.1 cells subcutane-ously into mice. Surprisingly, MITF-transduced YUMM1.1 tumors showed accelerated growth as compared to control-transduced cells
A
0 20 40 60 80 Copies MITF/HPR T 0 20000 40000 60000 80000 CCL5 [pg/ml] p < 0.0001B
0 5000 10000 15000 CXCL10 [pg/ml] p < 0.0001Medium YUMM GFP YUMM MITF
Splenocytes CD3+CD8+ CD3+CD4+ Number of cells x 10 3 0 5 10 15 20 p < 0.001 0 5 10 15 p < 0.001 0 1 2 3 4 p < 0.001 NK cells 0 0.5 1.0 1.5 2.0 2.5 p < 0.001 0 0.5 1.0 1.5 p < 0.001 B220+ YUMM GFP YUMM MITF
C
T umor size [ mm 2 ] YUMM GFPE
0 2000 4000 6000 8000 0 500 1000 1500 2000 2500 0 200 400 600 800 YUMM MITF 4 6 8 14 18 22 0 20 40 60 80 100 0 p < 0.001 p < 0.001 Cells/mg tumor CD45+ CD3+ CD3+CD8+ p < 0.001 p < 0.001 p = 0.002Days after tumor induction
D
YUMM GFP YUMM MITF 0 100 200 300 400 500 0 50 100 150 200 250 0 100 200 300 400 Cells/mg tumor p = 0.032 p = 0.011 p = 0.009 CD3+CD4+ CD11c+ B220+Figure 2. MITF overexpression in YUMM1.1 cells changes chemokine expression and immune cell attraction. (A) Relative MITF mRNA expression of MITF-transduced YUMM1.1 cells. (B) ELISA assay for chemokine detection in supernatants of transduced YUMM1.1 cells was analyzed after 48 hours of culture. (C) A total of 106C57BL/6 splenocytes were allowed to migrate for 6 hours towards YUMM1.1 supernatants or migration medium and analyzed by flow cytometry. Dots indicate migrated cells per well. Three independently collected supernatants were used. (D, E) C57BL/6 mice were injected with 2 × 10⁶YUMM melanoma cells transduced with MITF (n = 10) or with GFP (n = 9). (D) Tumor growth over time. Tumors were harvested on days 22 or 27 and analyzed by flow cytometry. (E) Cells per mg tumor. Data are pooled from two independent experiments. Panel B is representative of three independent experiments.
(Figure 2D). When analyzing tumor infiltrating immune cells, we observed that the in vivo phenotype closely resembled the phenotype we had observed in MITF knockdown B16F10 tumors. The number of total CD45+ cells as well as of CD8+ T cells and CD4+ T helper
cells was decreased, while the numbers of CD11b+ myeloid cells and NK cells remained unchanged (Figure 2E and Supplementary Figure 2E). In contrast to the B16 model, numbers of B220+ B cells and CD11c+ DC were also decreased in MITF-transduced YUMM1.1
Total CD14+ 0 5 10 15 20 25 0 5 10 15 p = 0.029 p = 0.008
A)
WM8 0 0.1 0.2 0.3 0.4 0 5 10 15 20 TotalB)
WM35 p = 0.010 p = 0.031 CD56+ CD56+ 0 0.1 0.2 0.3 0.4 p = 0.049 siControlsiMITF 0.0 0.5 1.0 1.5 2.0 2.5 siControlsiMITF 0 1 2 3Copies MITF/GAPDH Number of cells x 10 Copies MITF/GAPDH
3
Number of cells x 10
3
siControl siMITF
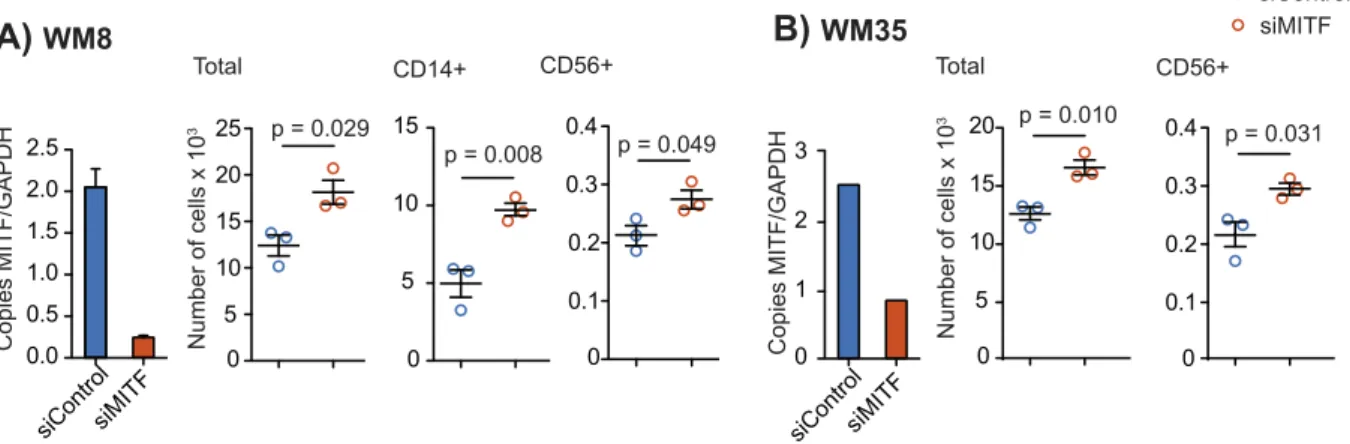
Figure 3. MITF knockdown in human melanoma cell lines WM8 and WM35. (A, B) Human WM8 (A) or WM35 (B) melanoma cells were transfected with control or with MITF siRNA. Knockdown efficiency was confirmed by q-RT-PCR. Copies of MITF per GAPDH are displayed. A total of 106human PBMCs were transferred into the upper well of a Transwell migration system; lower wells were loaded with WM8 or WM35 supernatants or migration medium. Cells were left to migrate for 6 hours, and migrated cells were analyzed by flow cytometry. Dots indicate migrated cells per well. Data are representative of at least three independent experiments.
A
Total CD14+ 0 2 4 6 8 10 Number of cells x 10 3 p = 0.041 0 0.5 1.0 1.5 CD19+ p = 0.049 0 2 4 6 8 p = 0.039 0 2 4 6 8 0 0.1 0.2 0.3 0.4 0 2 4 6 8 Total CD19+ CD14+ WM8 WM35 Number of cells x 10 3 p = 0.010 p = 0.045 p = 0.009 0 1 2 3 4 0 2 4 6 8 Copies MITF/GAPDH Copies MITF/GAPDHMedium Untransduced MITF transduced
siC siM UT MITF
CCL1 CCL2 CCL3 CCL3L1 CCL3L3 CCL4 CCL5 CCL7 CCL8 CCL11 CCL13 CCL14 CCL15 CCL16 CCL17 CCL18 CCL19 CCL20v1 CCL21 CCL22 CCL23 CCL24 CCL25v1 CCL26 CCL27 CCL28 CXCL1 CXCL2 CXCL3 CXCL4 CXCL5 CXCL6 CXCL7 CXCL9 CXCL10 CXCL11 CXCL12 CXCL13 CXCL14 CXCL16 CXCL17 XCL1 XCL2 CX3CL1 Comp F D IL-16 gp130
siC siM UT MITF
CCL1 CCL2 CCL3 CCL3L1 CCL3L3 CCL4 CCL5 CCL7 CCL8 CCL11 CCL13 CCL14 CCL15 CCL16 CCL17 CCL18 CCL19 CCL20v1 CCL21 CCL22 CCL23 CCL24 CCL25v1 CCL26 CCL27 CCL28 CXCL1 CXCL2 CXCL3 CXCL4 CXCL5 CXCL6 CXCL7 CXCL9 CXCL10 CXCL11 CXCL12 CXCL13 CXCL14 CXCL16 CXCL17 XCL1 XCL2 CX3CL1 Comp F D IL-16 gp130 0.02 0.04 0.06 0.08 0.10 WM8 WM35 Copies mRNA/GAPDH
B
C
Medium Untransduced MITF transduced
Figure 4. MITF overexpression in human melanoma cell lines WM8 and WM35. (A, B) Relative MITF mRNA expression of MITF-transduced WM8 (A) or WM35 (B) melanoma cells. MITF expression was confirmed by qRT-PCR. A total of 106human PBMCs were transferred into the upper well of a Transwell migration system; lower wells were loaded with WM8 or WM35 supernatants or migration medium. Cells were left to migrate for 6 hours, and migrated cells were analyzed by flow cytometry. Dots indicate migrated cells per well. Data are representative of three independent experiments. (C) Chemokine mRNA per GAPDH in MITF-transduced (MITF) and MITF knockdown (siMITF) WM8 and WM35 cells relative to control condition (siC, siControl; UT, untransduced). Data are pooled from three independent experiments.
tumors (Figure 2E). When analyzing intratumoral chemokine levels, we found that mRNA expression of most chemokines in MITF-transduced tumors remained unchanged or was reduced when compared to control tumors (Supplementary Figure 2F). This included CCL5 and CXCL10, which we had found upregulated in MITF-transduced YUMM1.1 cells in vitro (Supplementary Figure 2F).
MITF in Human Melanoma Cells and Immune Cell
Migration
We next sought to determine the role of MITF expression levels in human melanoma cells. We investigated WM8 and WM35 melanoma cell lines, both known to express intermediate baseline levels of MITF. This allows performing knockdown and overexpres-sion studies within the same cell line. MITF knockdown was performed with siRNA and was confirmed by qPCR (Figure 3, A and B) and Western Blot (Supplementary Figure 3, A and B). MITF knockdown resulted in an increased migration of peripheral blood mononuclear cells (PBMC), more specifically of CD56+ NK cells, towards tumor cell supernatants of both WM8 and WM35 cells (Figure 3, A and B). For WM8 cells, an increased migration of CD14+ monocytes towards tumor cell supernatant was observed (Figure 3A). There were no consistent changes in the migration of T or B cells towards MITF-silenced supernatants of WM8 or WM35 cells, with increased migration of CD4+ T cells in only 1 out of 3 experiments (Supplementary Figure 3, C and D). MITF overexpres-sion in WM8 and WM35 cells was confirmed by qPCR (Figure 4, A and B) and Western Blot (Supplementary Figure 4, A and B). MITF overexpression resulted in reduced migration of CD14+ myeloid cells and CD19+ cells towards tumor supernatants (Figure 4, A and B). When analyzing chemokine expression levels in WM8 and WM35 cells upon MITF siRNA knockdown or MITF overexpression, we found a comparable expression pattern in both tumor cell lines; MITF knockdown resulted in increased expression of CCL2; CXCL1; and, in WM8 cells only, of CXCL2, whereas levels of CCL15 and CCL19 were reduced in both cell lines. Vice versa, MITF overexpression mostly decreased expression of chemokines, e.g., CCL18, CXCL14, and CXCL16 (Figure 4C).
Discussion
We have analyzed the influence of MITF on melanoma cell chemokine expression and immune cell attraction. Unexpectedly, MITF was found to have opposing effects on chemokine expression in murine and human melanoma cells: In the murine cell lines, MITF knockdown resulted in reduced immune cell attraction, while MITF overexpression consistently resulted in increased immune cell migration. The exact opposite was observed in the human melanoma cell lines analyzed. We assume that this may be due to differences in genetic backgrounds, driver mutations of the melanoma cell lines, and diverging underlying mutations rather than to species-specific differences. Gene expression differences between murine and human melanoma cell lines have been described before [25]. For example, it is known that loss of PTEN, as for the YUMM1.1 cell line, mediates an immunosuppressive phenotype associated with decreased T cell infiltration[26]. Moreover, BRAF mutations have previously been reported to influence MITF transcription [27]. A more extensive analysis of different human and murine melanoma cell lines combined with an in-depth study of genomic mutations and
their interactions with MITF will be necessary to answer the observed differences of human and murine melanoma cell lines.
Chemokine expression patterns and immune cell subtypes attracted to the tumor cells also differed between the murine and human melanoma models: murine cell lines mostly attracted lymphoid cell types, whereas human cell lines preferentially attracted CD14+ monocytic cells. This is in line with previous reports, according to which B16F10 tumors are marked by a dominantly lymphoid cell infiltration, whereas human melanomas induce migration of myeloid cells [17,28]. Also in pancreatic cancer, different immune cell infiltrates in mice and humans have been reported: murine models are dominated by inhibitory myeloid cell infiltrates, while in humans, pancreatic adenocarcinomas T cells are highly prevalent [29]. Despite many conserved mechanisms and pathways, differences exist between the human and the murine immune system, including surface receptor expression, chemokine expression, and functional aspects of immune cell populations[30]. Interestingly, only few chemokines were expressed on mRNA level in the two murine cell lines studied. Of those, only CXCL10 was considerably reduced in MITF-deficient B16F10 cells. Strikingly, CXCL10 and CCL5 were upregulated in MITF-transduced YUMM1.1 melanoma cells. These chemokines are known to recruit T and NK cells to tumors via CCR5 and CXCR3. In CXCR3-KO mice, B16F10 tumors have decreased infiltration with CD8+T cells and reduced survival of mice[31–33]. Intratumoral CCL5 has also been reported to play a role in melanoma progression, with melanoma cell-intrinsic CCR5 expression [34,35]. It would be interesting to further dissect the role of MITF-regulated expression of these chemokines in melanoma.
In the human melanoma cell lines investigated in this study, MITF siRNA knockdown led to an increased migration of CD14+ monocytic cells, whereas overexpression of MITF showed opposing effects. These findings are in line with a recent study reporting the recruitment of CD14+ cells into MITFlow human melanomas[17]. In this study, murine MITFlow cell lines showed a high infiltration with CD14+ myeloid cells linked to a high expression of CCL2, CCL5, and CXCL10. In contrast to our study however, MITFlowcell lines were directly compared to MITFhigh cell lines, which did not allow for assessing acute changes of MITF levels within the same cell line. In our human melanoma cells, chemokine arrays showed an induction of CCL2 upon MITF knockdown, which is in line with current studies describing the CCL2-MITF axis as a component of the senescence-related secretome[12,17]. We also observed increased levels of CXCL1 in MITF-knockdown human melanoma cells. CXCL1 is known to be critically involved in melanoma development, angiogenesis, and growth[36,37]. MITF has been demonstrated to bind the CXCL1 promoter region in chromatin immunoprecipitation assays[38].
In our in vivo models, we observed reduced numbers of T cells and myeloid cells in MITF-knockdown B16F10 tumors concurrent with higher tumor growth. Surprisingly, MITF-transduced YUMM1.1 cells also showed accelerated tumor growth, and we found decreased intratumoral immune cell numbers. This is in contrast to the observed increase in immune cell attraction to MITF-transduced YUMM1.1 cells in vitro. When analyzing intratumoral chemokine levels, we found these diverging from in vitro tumor cell chemokine expression: overall chemokine levels were lower in both MITF-knockdown and MITF-transduced tumors. The opposing findings in vitro and in vivo for the YUMM1.1 cell line may be attributed to the
tumor environment where, in contrast to cell culture, stromal and immune cells contribute to chemokine production. While we can clearly demonstrate in vitro how changes in MITF levels affect chemokine levels in and immune cell attraction to melanoma cells, the complexity of the tumor microenvironment in vivo seems to overcome the in vitro effects, at least in the YUMM1.1 model. Several explanations are possible for the discrepancy of our in vitro and in vivo observations: tumor-associated immune cells might contribute to a high extent to intratumoral chemokine levels and thereby influence the tumor microenvironment; interactions with the tumor microen-vironment as well as the high growth rate might affect the biology of YUMM1.1 tumor cells in vivo, modifying chemokine secretion; or immune cell-mediated selective pressure might lead to the domina-tion of MITF low tumor cells in vivo. These results shed further light on the discrepancies in the consequences of different MITF levels for patient's prognosis. While higher or lower levels of MITF might have opposing consequences on the melanoma cells themselves, the impact on the environment will differ as well, thus potentially compensating or reverting function of MITF levels on disease outcome. Our data clearly show that changes in MITF levels influence the tumor microenvironment by suppressing immune cell migration to or accumulation at the tumor site and, thus, leading to an increased tumor growth. This is of importance since BRAF inhibitors, which are currently used for melanoma treatment, influence intratumoral MITF levels[39].
It is hard to define the exact role for MITF in shaping the immunological tumor microenvironment because of differing interactions with melanoma driver mutations in different melanoma cell lines (such as BRAF mutations, which are highly prevalent in human melanomas but only present in the YUMM1.1 cell line). Moreover, the kinetics of dynamic effects, as compared to stably decreased levels of MITF, may play a role in our knockdown and overexpression experiments. In our studies, we have both observed divergencies between in vitro and in vivo findings as well as divergencies between human and murine melanoma cell lines. We believe that melanomas of different origin, endowed with diverging underlying mutations and variable MITF expression at steady state, will react differently to transient changes in MITF levels. A detailed study of a higher number of different melanomas and their interactions with the immune system will be necessary to depict effects of MITF levels in different contexts. Nevertheless, our results show that MITF clearly influences chemokine expression and immune cell attraction in different murine and human melanomas.
Since the emergence of checkpoint blockade has revolutionized melanoma therapy in the past years[14,40]it has become more and more important to understanding the factors which regulate melanoma immunogenicity and immune cell infiltration. Our study provides a first step to understanding how MITF might influence the interaction of melanoma cells with immune cells and might provide a basis for further therapeutic interventions in combination with targeted immunotherapies.
Supplementary data to this article can be found online athttps:// doi.org/10.1016/j.tranon.2018.10.014.
Acknowledgements
We thank Dr. Bosenberg (Yale University, USA) for providing the YUMM1.1 cell line.
This study was supported by grants from the international doctoral program“i-Target: Immunotargeting of cancer” funded by the Elite
Network of Bavaria (to S.K. and S.E.), the Melanoma Research Alliance (grant number 409510 to S.K.), the Marie-Sklodowska-Curie “Training Network for the Immunotherapy of Cancer (IMMUTRAIN)” funded by the H2020 program of the European Union (to S.E. and S.K.), the Else Kröner-Fresenius-Stiftung (to S.K.), the German Cancer Aid (to S.K.), the Ernst-Jung-Stiftung (to S.K.), the LMU Munich’s Institutional Strategy LMU excellent within the framework of the German Excellence Initiative (to S.E. and S.K.), the Bundesministerium für Bildung und Forschung VIP+ grant ONKAT-TRACT (to S.E. and S.K.), the European Research Council Starting Grant (grant number 756017 to S.K.), the German Research Foundation (DFG) (to P.D.), and the CIPS-M women grant (to G.M.W.). Conflict of Interest Statement
The authors declare that no potential conflicts of interest exist. Parts of this work have been performed as parts of the doctoral theses of C. A., A. K., and B. C. at the Ludwig-Maximilians-Universität München, Germany.
References
[1] Garraway LA, Widlund HR, Rubin MA, Getz G, Berger AJ, Ramaswamy S, Beroukhim R, Milner DA, Granter SR, and Du J, et al (2005). Integrative genomic analyses identify MITF as a lineage survival oncogene amplified in malignant melanoma. Nature436(7047), 117–122.
[2] King R, Googe PB, Weilbaecher KN, Mihm Jr MC, and Fisher DE (2001). Microphthalmia transcription factor expression in cutaneous benign, malignant melanocytic, and nonmelanocytic tumors. Am J Surg Pathol 25 (1), 51–57.
[3] Cheli Y, Ohanna M, Ballotti R, and Bertolotto C (2010). Fifteen-year quest for microphthalmia-associated transcription factor target genes. Pigment Cell Melanoma Res23(1), 27–40.
[4] Ugurel S, Houben R, Schrama D, Voigt H, Zapatka M, Schadendorf D, Bröcker EB, and Becker JC (2007). Microphthalmia-associated transcription factor gene amplification in metastatic melanoma is a prognostic marker for patient survival, but not a predictive marker for chemosensitivity and chemotherapy response. Clin Cancer Res13(21), 6344–6350.
[5] Van Allen EM, Wagle N, Sucker A, Treacy DJ, Johanessesn CM, Goetz EM, Place CS, Taylor-Weiner A, Whittaker S, and Kruykov GV, et al (2014). The genetic landscape of clinical resistance to RAF inhibition in metastatic melanoma. Cancer Discov4(1), 94–109.
[6] Muller J, Krijgsman O, Tsoi J, Robert L, Hugo W, Song C, Kong X, Possik PA, Cornelissen-Steijger PD, and Geukes Foppen MH, et al (2014). Low MITF/ AXL ratio predicts early resistance to multiple targeted drugs in melanoma. Nat Commun5, 5712.
[7] Beuret L, Flori E, Denoyelle C, Bille K, Busca R, Picardo M, Bertolotto C, and Ballotti R (2007). Up-regulation of MET expression by alpha-melanocyte-stimulating hormone and MITF allows hepatocyte growth factor to protect melanocytes and melanoma cells from apoptosis. J Biol Chem 282(19), 14140–14147.
[8] Hoek KS, Schlegel NC, Brafford P, Sucker A, Ugurel S, Kumar R, Weber BL, Nathanson KL, Phillips DJ, and Herlyn M, et al (2006). Metastatic potential of melanomas defined by specific gene expression profiles with no BRAF signature. Pigment Cell Res19(4), 290–302.
[9] Javelaud D, Alexaki VI, Pierrat MJ, Hoek KS, Dennler S, Van Kempen L, Bertolotto C, Ballotti R, Saule S, and Delmas V, et al (2011). GLI2 and M-MITF transcription factors control exclusive gene expression programs and inversely regulate invasion in human melanoma cells. Pigment Cell Melanoma Res 24(5), 932–943.
[10] Carreira S, Goodall J, Denat L, Rodriguez M, Nuciforo P, Hoek KS, Testori A, Larue L, and Goding CR (2006). Mitf regulation of Dia1 controls melanoma proliferation and invasiveness. Genes Dev20(24), 3426–3439.
[11] Eccles MR, He S, Ahn A, Slobbe LJ, Jeffs AR, Yoon HS, and Baguley BC (2013). MITF and PAX3 play distinct roles in melanoma cell migration; outline of a "genetic switch" theory involving MITF and PAX3 in proliferative and invasive phenotypes of melanoma. Front Oncol3, 229.
[12] Ohanna M, Giuliano S, Bonet C, Imbert V, Hofman V, Zangari J, Bille K, Robert C, Bressac-de Paillerets B, and Hofman P, et al (2011). Senescent cells develop a PARP-1 and nuclear factor-{kappa}B-associated secretome (PNAS). Genes Dev25(12), 1245–1261.
[13] Strub T, Giuliano S, Ye T, Bonet C, Keime C, Kobi D, Le Gras S, Cormont M, Ballotti R, and Bertolotto C, et al (2011). Essential role of microphthalmia transcription factor for DNA replication, mitosis and genomic stability in melanoma. Oncogene30(20), 2319–2332.
[14] Hodi FS, O'Day SJ, McDermott DF, Weber RW, Sosman JA, Haanen JB, Gonzalez R, Robert C, Schadendorf D, and Hassel JC, et al (2010). Improved survival with ipilimumab in patients with metastatic melanoma. N Engl J Med 363(8), 711–723.
[15] Herbst RS, Soria JC, Kowanetz M, Fine GD, Hamid O, Gordon MS, Sosman JA, McDermott DF, Powderly JD, and Gettinger SN, et al (2014). Predictive correlates of response to the anti-PD-L1 antibody MPDL3280A in cancer patients. Nature515(7528), 563–567.
[16] van der Woude LL, Gorris MAJ, Halilovic A, Figdor CG, and de Vries IJM (2017). Migrating into the tumor: a roadmap for T cells. Trends Cancer3(11), 797–808.
[17] Riesenberg S, Groetchen A, Siddaway R, Bald T, Reinhardt J, Smorra D, Kohlmeyer J, Renn M, Phung B, and Aymans P, et al (2015). MITF and c-Jun antagonism interconnects melanoma dedifferentiation with pro-inflammatory cytokine responsiveness and myeloid cell recruitment. Nat Commun6, 8755.
[18] Kamaraju AK, Bertolotto C, Chebath J, and Revel M (2002). Pax3 down-regulation and shut-off of melanogenesis in melanoma B16/F10.9 by interleukin-6 receptor signaling. J Biol Chem277(17), 15132–15141.
[19] Smalley KS, Contractor R, Nguyen TK, Xiao M, Edwards R, Muthusamy V, King AJ, Flaherty KT, Bosenberg M, and Herlyn M, et al (2008). Identification of a novel subgroup of melanomas with KIT/cyclin-dependent kinase-4 overexpression. Cancer Res68(14), 5743–5752.
[20] Kobold S, Merk M, Hofer L, Peters P, Bucala R, and Endres S (2014). The macrophage migration inhibitory factor (MIF)-homologue D-dopachrome tautomer-ase is a therapeutic target in a murine melanoma model. Oncotarget5(1), 103–107.
[21] Meeth K, Wang JX, Micevic G, Damsky W, and Bosenberg MW (2016). The YUMM lines: a series of congenic mouse melanoma cell lines with defined genetic alterations. Pigment Cell Melanoma Res29(5), 590–597.
[22] Larribere L, Hilmi C, Khaled M, Gaggioli C, Bille K, Auberger P, Ortonne JP, Ballotti R, and Bertolotto C (2005). The cleavage of microphthalmia-associated transcription factor, MITF, by caspases plays an essential role in melanocyte and melanoma cell apoptosis. Genes Dev19(17), 1980–1985.
[23] Bourseguin J, Bonet C, Renaud E, Pandiani C, Boncompagni M, Giuliano S, Pawlikowska P, Karmous-Benailly H, Ballotti R, and Rosselli F, et al (2016). FANCD2 functions as a critical factor downstream of MiTF to maintain the proliferation and survival of melanoma cells. Sci Rep636539.
[24] Kobold S, Steffen J, Chaloupka M, Grassmann S, Henkel J, Castoldi R, Zeng Y, Chmielewski M, and Schmollinger JC, et al (2015). Selective bispecific T cell recruiting antibody and antitumor activity of adoptive T cell transfer. J Natl Cancer Inst107(1), 364.
[25] Nakayama J, Guan XC, Nakashima M, Mashino T, and Hori Y (1997). In vitro comparison between mouse B16 and human melanoma cell lines of the expression of ICAM-1 induced by cytokines and/or hyperthermia. J Dermatol24 (6), 351–360.
[26] Peng W, Chen JQ, Liu C, Malu S, Creasy C, Tetzlaff MT, Xu C, McKenzie JA, and Zhang C, et al (2016). Loss of PTEN promotes resistance to T cell-– mediated immunotherapy. Cancer Discov6(2), 202–216.
[27] Wellbrock C, Rana S, Paterson H, Pickersgill H, Brummelkamp T, and Marais R (2008). Oncogenic BRAF regulates melanoma proliferation through the lineage specific factor MITF. PLoS One3(7)e2734.
[28] Pachynski RK, Scholz A, Monnier J, Butcher EC, and Zabel BA (2015). Evaluation of tumor-infiltrating leukocyte subsets in a subcutaneous tumor model. J Vis Exp98.
[29] Pillarisetty VG (2014). The pancreatic cancer microenvironment: an immuno-logic battleground. Oncoimmunology3(8)e950171.
[30] Mestas J and Hughes CC (2004). Of mice and not men: differences between mouse and human immunology. J Immunol172(5), 2731–2738.
[31] Campanella GS, Medoff BD, Manice LA, Colvin RA, and Luster AD (2008). Development of a novel chemokine-mediated in vivo T cell recruitment assay. J Immunol Methods331(1–2), 127–139.
[32] Chheda ZS, Sharma RK, and Jala VR (2016). Chemoattractant receptors BLT1 and CXCR3 regulate antitumor immunity by facilitating CD8+ T cell migration into tumors. 197(5), 2016–2026.
[33] Martin-Fontecha A, Thomsen LL, Brett S, Gerard C, Lipp M, Lanzavecchia A, and Sallusto F (2004). Induced recruitment of NK cells to lymph nodes provides IFN-gamma for T(H)1 priming. Nat Immunol5(12), 1260–1265.
[34] Mrowietz U, Schwenk U, Maune S, Bartels J, Küpper M, Fichtner I, Schröder JM, and Schadendorf D (1999). The chemokine RANTES is secreted by human melanoma cells and is associated with enhanced tumour formation in nude mice. Br J Cancer79(7–8), 1025–1031.
[35] Payne AS and Cornelius LA (2002). The role of chemokines in melanoma tumor growth and metastasis. J Invest Dermatol118(6), 915–922.
[36] Dhawan P and Richmond A (2002). Role of CXCL1 in tumorigenesis of melanoma. J Leukoc Biol72(1), 9–18.
[37] Luan J, Shattuck-Brandt R, Haghnegahdar H, Owen JD, Strieter R, Burdick M, Nirodi C, Beauchamp D, and Johnson KN, et al (1997). Mechanism and biological significance of constitutive expression of MGSA/GRO chemokines in malignant melanoma tumor progression. J Leukoc Biol62(5), 588–597.
[38] Botton T, Puissant A, Cheli Y, Tomic T, Giuliano S, Fajas L, Deckert M, Ortonne JP, and Bertolotto C, et al (2011). Ciglitazone negatively regulates CXCL1 signaling through MITF to suppress melanoma growth. Cell Death Differ18(1), 109–121.
[39] Aida S, Sonobe Y, Tanimura H, Oikawa N, Yuhki M, Sakamoto H, and Mizuno T (2017). MITF suppression improves the sensitivity of melanoma cells to a BRAF inhibitor. Cancer Lett409, 116–124.
[40] Pawelec G (2018). Immune correlates of clinical outcome in melanoma. Immunology153(4), 415–422.