HAL Id: hal-02108309
https://hal.archives-ouvertes.fr/hal-02108309
Submitted on 24 Apr 2019HAL is a multi-disciplinary open access archive for the deposit and dissemination of sci-entific research documents, whether they are pub-lished or not. The documents may come from teaching and research institutions in France or abroad, or from public or private research centers.
L’archive ouverte pluridisciplinaire HAL, est destinée au dépôt et à la diffusion de documents scientifiques de niveau recherche, publiés ou non, émanant des établissements d’enseignement et de recherche français ou étrangers, des laboratoires publics ou privés.
The cytochrome b_6f complex is not involved in
cyanobacterial state transitions
Pablo Calzadilla, Jiao Zhan, Pierre Sétif, Claire Lemaire, Daniel Solymosi,
Natalia Battchikova, Qiang Wang, Diana Kirilovsky
To cite this version:
Pablo Calzadilla, Jiao Zhan, Pierre Sétif, Claire Lemaire, Daniel Solymosi, et al.. The cytochrome b_6f complex is not involved in cyanobacterial state transitions. The Plant cell, American Society of Plant Biologists (ASPB), 2019, 31 (4), pp.911-931. �10.1105/tpc.18.00916�. �hal-02108309�
1
RESEARCH ARTICLE
The Cytochrome b6
f Complex is Not Involved in Cyanobacterial State
Transitions
Pablo I. Calzadilla1*, Jiao Zhan1,2*, Pierre Sétif1, Claire Lemaire1, Daniel Solymosi3, Natalia Battchikova3, Qiang Wang2,4 and Diana Kirilovsky1,a
1 Institute for Integrative Biology of the Cell (I2BC), CEA, CNRS, Université Paris-Sud,
Université Paris-Saclay, 91198 Gif sur Yvette, France
2 Key Laboratory of Algal Biology, Institute of Hydrobiology, Chinese Acadamy of Sciences,
Wuhan 430072, Hubei, China
3 Molecular Plant Biology Lab, Biochemistry Dept, Faculty of Science and Engineering,
University of Turku, Turku, Finland
4 Key Laboratory of Plant Stress Biology, State Key Laboratory of Cotton Biology, School of
Life Sciences, Henan University, Kaifeng 475004, China *These authors contributed equally to this work
aCorresponding author: diana.kirilovsky@cea.fr
Short title: Cyanobacterial state transitions revisited
One-sentence summary: Cyanobacterial state transitions, which balance photosystem activities during photosynthesis, depend on the plastoquinone pool redox state but not on cytochrome b6f or phosphorylation reactions.
The author responsible for distribution of materials integral to the findings presented in this article in accordance with the policy described in the Instructions for Authors (www.plantcell.org) is: Diana Kirilovsky (diana.kirilovsky@cea.fr).
ABSTRACT
Photosynthetic organisms must sense and respond to fluctuating environmental conditions in order to perform efficient photosynthesis and to avoid the formation of dangerous reactive oxygen species. The excitation energy arriving at each photosystem permanently changes due to variations in the intensity and spectral properties of the absorbed light. Cyanobacteria, like plants and algae, have developed a mechanism, named state transitions, that balances photosystem activities. Here, we characterize the role of the cytochrome b6f complex and
phosphorylation reactions in cyanobacterial state transitions using Synechococcus elongatus PCC 7942 and Synechocystis PCC 6803 as model organisms. First, large Photosystem II fluorescence quenching was observed in State II, which does not appear to be related to energy transfer from Photosystem II to Photosystem I (spillover). This membrane-associated process was inhibited by betaine, sucrose and high concentrations of phosphate. Then, using different chemicals affecting the plastoquinone pool redox state and cytochrome b6f activity,
we demonstrate that this complex is not involved in state transitions in S. elongatus or
Plant Cell Advance Publication. Published on March 8, 2019, doi:10.1105/tpc.18.00916
2
Synechocystis PCC6803. Finally, by constructing and characterizing 21 protein kinase and phosphatase mutants and using chemical inhibitors, we demonstrate that phosphorylation reactions are not essential for cyanobacterial state transitions. Thus, signal transduction is completely different in cyanobacterial and plant (green alga) state transitions.
INTRODUCTION
1
Photosynthetic organisms must cope with changes in the quality and quantity of
2
incoming light. In order to survive and to optimize the use of light, they must adapt to
3
changing environmental conditions by regulating the energy arriving at the reaction centers.
4
Specific illumination of Photosystem II (PSII) or Photosystem I (PSI) creates an energy
5
imbalance that leads to the over-reduction or over-oxidation of the intersystem electron
6
transport chain. Murata (Murata, 1969) and Bonaventura and Myers (Bonaventura and Myers,
7
1969) were the first to propose a mechanism, called “State transitions”, which rebalances the
8
activity of reaction centers I and II. Two states were defined: State I, induced by light
9
preferentially absorbed by PSI and characterized by a high PSII to PSI fluorescence ratio;
10
State II, induced by light preferentially absorbed by PSII and characterized by a low PSII to
11
PSI fluorescence ratio. The transition from one state to the other is triggered by changes in the
12
redox state of the plastoquinone (PQ) pool (Allen et al., 1981; Mullineaux and Allen, 1990):
13
oxidation of the PQ pool induces the transition to State I and its reduction induces the
14
transition to State II.
15
In plants and green algae, reduction of the PQ pool induces the activation of a specific
16
kinase that phosphorylates the membrane-bound light harvesting complex II (LHCII). The
17
phosphorylated LHCII detaches from PSII and attaches to PSI during the transition from State
18
I to State II. Oxidation of the PQ pool deactivates the kinase and a phosphatase
19
dephosphorylates LHCII, which again migrates to PSII. The migration of LHCII from one
20
photosystem to the other allows for a readjustment in the distribution of excitation energy
21
arriving at PSI and PSII (see review (Minagawa, 2011)).
22
In red algae and cyanobacteria, the principal PSII antenna is the phycobilisome (PBS),
23
a large extramembrane complex constituted by phycobiliproteins organized in a core from
24
which rods radiate (reviews (Glazer, 1984; MacColl, 1998; Adir, 2008)). As a consequence,
25
the processes involved in state transitions in these organisms differ. In red algae, the large
26
fluorescence quenching induced by the illumination of dark-adapted cells is related to two
27
different mechanisms: a PSII non-photochemical-quenching mechanism (qE) induced by a
28
low luminal pH (Delphin et al., 1995; Delphin et al., 1996; Kowalczyk et al., 2013; Krupnik
29
et al., 2013), in which the fluorescence quenching occurs at the level of the reaction centers
3
(Krupnik et al., 2013), and state transitions induced by changes in the redox state of the PQ
31
pool, which involve changes in energy transfer from PSII to PSI (spillover) (Ley and Butler,
32
1980; Kowalczyk et al., 2013). The relative importance of each mechanism varies among
33
strains (Delphin et al., 1996; Kowalczyk et al., 2013). In cyanobacteria, the molecular
34
mechanism of the PQ-pool dependent state transitions remains largely obscure. This process,
35
which involves fluorescence changes occurring upon illumination of dark-adapted cells or
36
under illumination with light absorbed more specifically by PSII or PSI, indeed remains an
37
open question, despite the many studies resulting in the proposal of several hypotheses and
38
models.
39
In the mobile-phycobilisome model, the movement of phycobilisomes (PBSs) induces
40
changes in direct energy transfer from PBS to PSII and PSI (Allen et al., 1985; Mullineaux
41
and Allen, 1990; Mullineaux et al., 1997). This model attributes the low PSII fluorescence
42
yield in State II to a lower amount of energy transfer from PBSs to PSII, together with larger
43
energy transfer to PSI. The observations that PBSs are able to rapidly move on the thylakoid
44
surface (Mullineaux et al., 1997) and that chemicals inhibiting PBS diffusion also inhibit state
45
transitions support this model (Joshua and Mullineaux, 2004; Li et al., 2004; Li et al., 2006).
46
In the spillover model, the energy transfer from PBS to PSII remains equal in both states, but
47
the excess energy absorbed by PSII is transferred to PSI (spillover) in State II via a process
48
involving the movement of photosystems (Ley and Butler, 1980; Bruce and Biggins, 1985;
49
Olive et al., 1986; Biggins and Bruce, 1989; Biggins et al., 1989; Vernotte et al., 1992; El
50
Bissati et al., 2000; Federman et al., 2000). The hypothesis that changes at the level of
51
photosystems are responsible for state transitions is supported by various observations: state
52
transitions occur in mutants lacking PBSs (Bruce et al., 1989; Olive et al., 1997; El Bissati et
53
al., 2000); state transitions are accompanied by structural changes in membranes (Vernotte et
54
al., 1992; Folea et al., 2008) and PSI monomerization/trimerization (Kruip et al., 1994;
55
Schluchter et al., 1996; Aspinwall et al., 2004); and membrane fluidity influences state
56
transitions (El Bissati et al., 2000). Nevertheless, there has been no clear demonstration that
57
the spillover is larger in State II than in State I, although some studies have suggested this (see
58
(Mullineaux et al., 1991; Bruce and Salehian, 1992)). It was also proposed that these two
59
mechanisms coexist and are responsible for the fluorescence changes observed in state
60
transitions: movement of PBS (changes in direct energy transfer from PBSs to photosystems)
61
and movement of photosystems (changes in spillover) (Scott et al., 2006). However, more
62
recent studies have questioned the definition of cyanobacterial state transitions as a rebalance
63
of excitation energy arriving to one or another photosystem. The increase in fluorescence in
4
State I has principally been associated with the functional detachment of PBS from the
65
photosystems (Kana et al., 2009; Kana, 2013; Chukhutsina et al., 2015), whereas the decrease
66
in fluorescence in State II was mainly attributed to a specific fluorescence quenching of
67
Photosystem II not involving spillover (Ranjbar Choubeh et al., 2018).
68
Furthermore, the states of plants and cyanobacteria in darkness differ: while plants are
69
generally in State I, cyanobacteria are in State II (Aoki and Katoh, 1982; Mullineaux and
70
Allen, 1986). In cyanobacteria, respiration and photosynthesis occur in the thylakoid
71
membranes, and PQ, cytochrome (cyt) b6f and plastocyanin (or cyt c6) are electron carriers
72
common to both electron transport chains (review (Mullineaux, 2014)). During respiration,
73
the homologs of mitochondrial Complex I (NDH-1) and Complex II (Succinate
74
dehydrogenase, SDH) reduce the PQ pool, and different oxidases oxidize it (for review see
75
(Mullineaux, 2014)). Different cyanobacterial strains present different PQ pool reduction
76
states in darkness, giving different levels of dark PSII fluorescence (see for ex (Misumi et al.,
77
2016)). Upon illumination, PSI is activated and the PQ pool becomes more oxidized, leading
78
to State I (Mullineaux and Allen, 1990; Campbell et al., 1998).
79
In plants and green algae, the redox sensor of the PQ pool is the cyt b6f complex,
80
which interacts with a specific kinase of the major membrane chlorophyll antenna, LHCII
81
(Wollman and Lemaire, 1988). Phosphorylation of LHCII trimers induces their detachment
82
from PSII and partial (or total) attachment to PSI, inducing the transition to State II (Kyle et
83
al., 1984). Two reports suggest that cyt b6f also plays a role in cyanobacterial state transitions
84
(Mao et al., 2002; Huang et al., 2003). However, further evidence is still needed to confirm its
85
direct involvement. In this sense, the relationship between phosphorylation and cyanobacterial
86
state transitions is also an open question. Allen and coworkers suggested that specific types of
87
phosphorylation could occur during state transitions (Allen et al., 1985), but this was not
88
confirmed in more recent works. Nevertheless, analysis of phospho-proteomes showed that
89
phosphorylation takes place in PBSs and photosystems (Yang et al., 2013; Chen et al., 2015;
90
Spat et al., 2015). In addition, when residues Ser22, 49 and 154 and Thr94 of phycocyanin
91
(PBS protein) were mutated to non-phosphorylatable amino acids in Synechocystis cells, the
92
kinetic and amplitude of transition to State I induced by light illumination of dark adapted
93
cells appeared to be affected (Chen et al., 2015). Some functions of Ser/Thr kinases (Spk)
94
have already been described. For example, SpkA is involved in the control of cell motility
95
(Kamei et al., 2001; Panichkin et al., 2006); SpkB participates in the oxidative stress response
96
by phosphorylating glycyl-tRNA-synthetase -subunit (Mata-Cabana et al., 2012); SpkE
97
might be involved in the regulation of nitrogen metabolism (Galkin, 2003); SpkD might be
5
involved in adjusting the pool of TCA (tricarboxylic acid) cycle metabolites (Laurent et al.,
99
2008); SpkG plays an essential role in high-salt resistance (Liang et al., 2011); SpkC, SpkF
100
and SpkK are involved in the phosphorylation of the GroES chaperone protein (Zorina et al.,
101
2014); and SpkG is involved in the phosphorylation of Fd5 (ferredoxin 5) protein (Angeleri et
102
al., 2018).
103
As a whole, the molecular mechanism behind cyanobacterial state transitions is still a
104
matter of discussion, although many hypotheses have been proposed. Therefore, we decided
105
to further study this mechanism by specifically addressing the role of the cyt b6f complex in
106
this process.
107
In the past decades, state transitions have mainly been studied in the cyanobacteria
108
Synechocystis PCC 6803 (hereafter Synechocystis) (for ex: (Vernotte et al., 1992;
Emlyn-109
Jones et al., 1999; McConnell et al., 2002; Kondo et al., 2009; Chukhutsina et al., 2015)),
110
Synechococcus PCC7002 (McConnell et al., 2002; Dong and Zhao, 2008; Dong et al., 2009)
111
and Spirulina platensis (Li et al., 2004; Li et al., 2006). In these strains, the changes in
112
fluorescence related to state transitions (dark versus blue [or far-red] illumination) are rather
113
small, which makes mechanistic studies difficult. The differences in PSII fluorescence in
114
darkness (State II) and under blue-light illumination (State I) are significantly larger in
115
Synechococcus elongatus strain than in Synechocystis. Therefore, in the current study, we
116
characterized state transitions in S. elongatus and compared them to those in Synechocystis
117
PCC 6803, which allowed us to obtain clearer conclusions. Our results confirm recently
118
published data demonstrating that a large amplitude of PSII fluorescence quenching is
119
induced in State II in S. elongatus (Ranjbar Choubeh et al., 2018). This PSII quenching
120
appears to be unrelated to spillover. In addition, not only do we show that the results and
121
arguments used to link the cyt b6f complex with state transitions were not conclusive, but we
122
also demonstrate that cyt b6f and protein phosphorylation reactions do not participate in this
123
process in cyanobacteria. Thus, different signaling pathways are involved in state transitions
124
in cyanobacteria compared to plants and green algae.
125 126
RESULTS
127State transitions in S. elongatus and Synechocystis
128
77 K fluorescence spectra in State II and State I
6
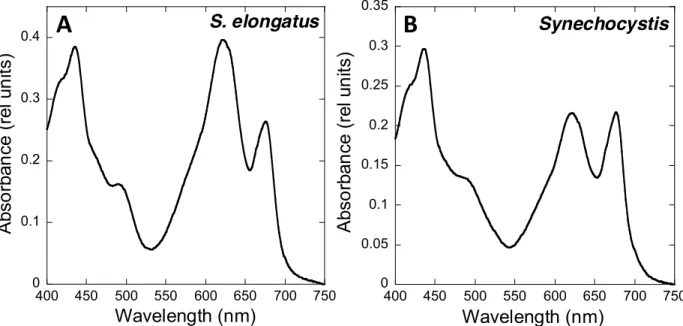
The absorbance spectra indicate that, under our growth conditions, S. elongatus
130
presents a higher phycocyanin (PC, absorbance at 620 nm) to chlorophyll (Chl, absorbance at
131
680 nm) ratio than Synechocystis (Figure 1). In addition, the PSI to PSII ratio (measured by
132
(FA, FB)- and TyrD+ EPR signals) was around 2–3 in S. elongatus and 4–5 in Synechocystis
133
cells (for details, see Methods).
134
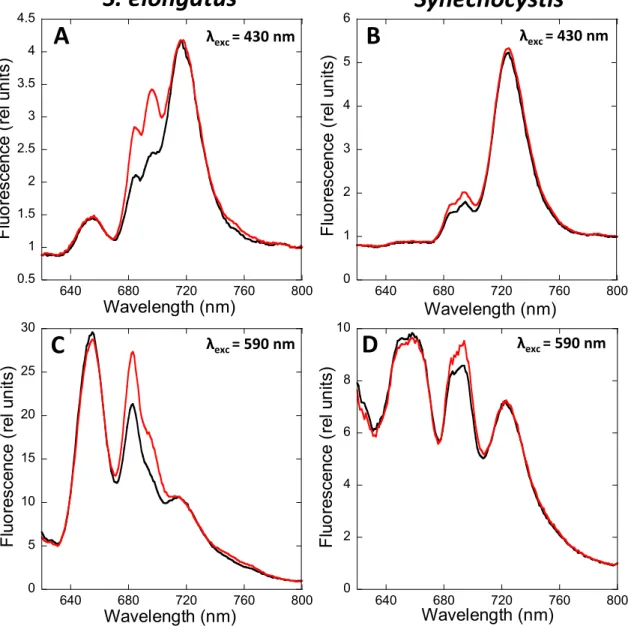
Figure 2 compares the low temperature (-196.15°C) 77 K fluorescence emission
135
spectra of dark and blue-light adapted S. elongatus (A, C) and Synechocystis (B, D) cells. At
136
this temperature, the fluorescence of both photosystems is visible, while at room temperature
137
only PSII-related fluorescence is observed.
138
Supplemental Figures 1 and 2 show the Gaussian decomposition of these spectra,
139
providing a visualization of different components of the spectra. When the PBSs were
140
preferentially excited (excitation at 590 nm), we observed a large peak at 650-660 nm related
141
to PC and allophycocyanin (APC) fluorescence, a peak at 683 nm related to the chlorophyll
142
binding protein CP43 and the last emitters of PBS, a peak (or shoulder in S. elongatus) at 695
143
nm corresponding to Reaction Center II and CP47, and finally a peak at 718 nm (S. elongatus)
144
or 722 nm (Synechocystis) related to PSI fluorescence (Vandorssen et al., 1987;
Siefermann-145
harms, 1988). The PSII-related peaks at 683 and 695 nm were higher in blue-light adapted
146
cells (State I) than in dark-adapted cells (State II). The differences between the peaks in State
147
I and II were larger in S. elongatus than in Synechocystis. Regarding PSI, the fluorescence
148
was similar in dark- and light-adapted cells of both strains.
149
When the chlorophyll was preferentially excited (excitation at 430 nm), the PSI
150
emission peak (at 718 nm in S. elongatus and 722 nm in Synechocystis) was the highest in
151
both strains. In addition, the PSII-related peaks at 685 and 695 nm were much higher in S.
152
elongatus than in Synechocystis, corresponding to a lower PSI to PSII ratio (2–3 in S.
153
elongatus versus 4–5 in Synechocystis). The PSI related peaks were similar in darkness and
154
blue-light illumination. The absence of changes in PSI-related fluorescence during state
155
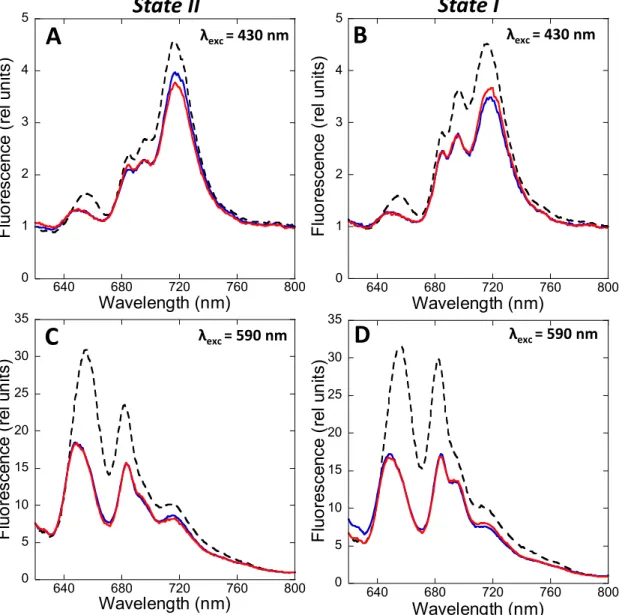
transitions was confirmed by normalizing the S. elongatus spectra with an external dye
156
(Rhodamine B) (Figure 3). The PSII-related peaks increased upon blue-light illumination in
157
both strains. Nevertheless, the emission at 695 nm increased more than the one at 683 nm
158
(Supplemental Figures 1 and 2).
159 160
Effect of hyper-osmotic buffers on state transitions
7
We investigated the effects of the hyper-osmotic buffers betaine (1 M, pH 7.0),
162
sucrose (1 M) and phosphate (0.5 M, pH 7.5) on state transitions in S. elongatus cells (Figure
163
4 and Supplemental Figure 3). Control cells were incubated in the absence of chemicals in the
164
dark (cells-II) or under blue-light illumination (cells-I). Aliquots of these cells were rapidly
165
frozen. Cells-II and cells-I were then incubated with chemicals for 5 min under identical
166
conditions (dark for cells-II, blue-light illumination for cells-I). Cells-II were then transferred
167
to blue-light for 5 minutes before freezing, whereas Cells-I were transferred to dark for 5
168
minutes before freezing. 77 K fluorescence spectra were then measured with excitation at 430
169
nm and at 590 nm. The first effect observed upon addition of betaine and sucrose was a large
170
general quenching of fluorescence, suggesting that these chemicals have an effect not only on
171
PBSs but also on membranes (Figure 4 and Supplemental Figure 3). The quenching effect of
172
hyper-osmotic media was previously reported in Synechocystis by (Papageorgiou et al., 1999),
173
who attributed it to alterations in membrane fluidity. Nevertheless, the PBS quenching
174
seemed to be larger than that of Chl, since the 683/695 and 660/695 ratios decreased after the
175
addition of betaine and sucrose with excitation at 590 nm. By contrast, phosphate addition had
176
a more specific quenching effect on PBS fluorescence, as seen by the relatively large decrease
177
in fluorescence at 660 nm (Supplemental Figure 3).
178
As previously observed (Joshua and Mullineaux, 2004; Li et al., 2004; Li et al., 2006),
179
no fluorescence changes were detected in 77 K emission spectra obtained by excitation at 590
180
nm when state transitions were tentatively induced in the presence of betaine, sucrose or
181
phosphate (Figure 4 and Supplemental Figure 3). In addition, the chemicals also inhibited the
182
fluorescence changes observed in the 77 K emission spectra obtained with 430 nm excitation
183
(Figure 4 and Supplemental Figure 3). These results demonstrate that betaine, sucrose and
184
phosphate also block the changes produced in the membranes. In conclusion, the effect of
185
these hyper-osmotic buffers on state transitions could be due to the inhibition of PBS
186
movement and/or processes occurring in the membrane.
187 188
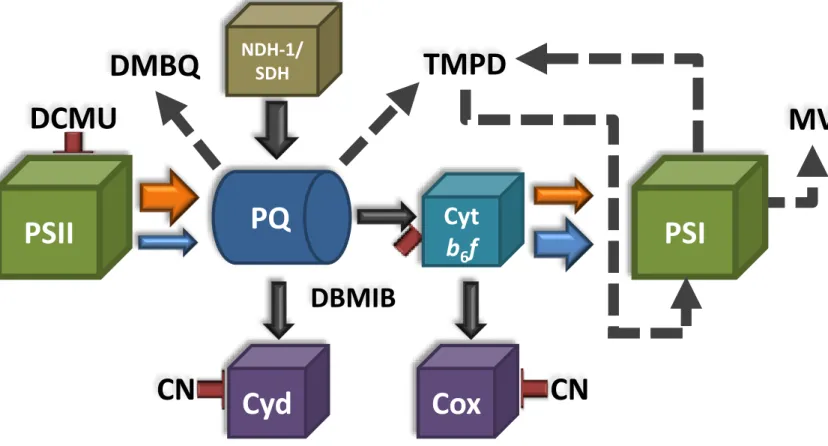
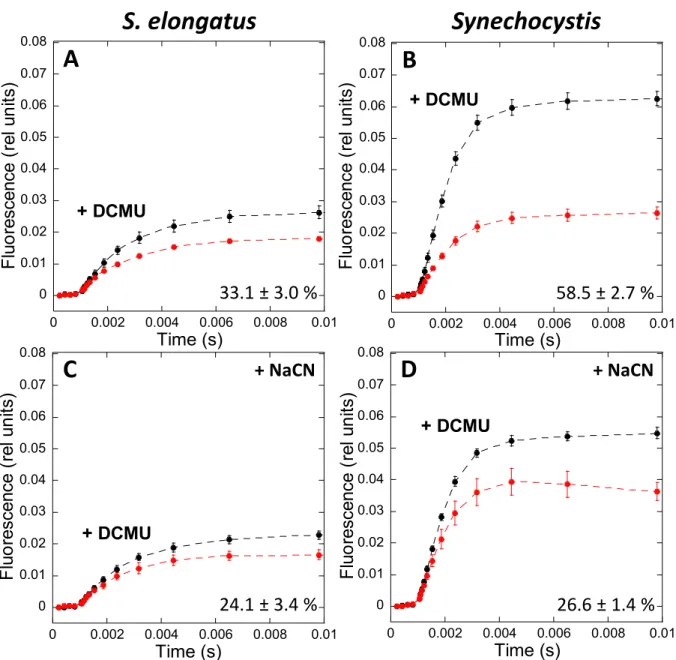
State transitions kinetics and the redox state of the PQ pool in darkness
189 190
Figure 5 shows typical traces of room temperature fluorescence kinetics measured
191
with a PAM fluorometer in dark-adapted S. elongatus (A) and Synechocystis (B) cells
192
successively illuminated by low intensities of blue and orange light. Dark-adapted cells
193
presented a low dark maximal fluorescence (Fmd), indicating that the cells were in State II.
194
Upon illumination with blue-light, which preferentially excites chlorophyll, a large and rapid
8
increase in Fm’ was observed (arriving at a maximal Fmb’ level), indicating the transition to
196
State I. The ratio Fvb to Fvd (Fv = variable fluorescence = Fm-F0) was approximately 4.0 in S.
197
elongatus but only 1.2 in Synechocystis cells (Figure 5). The dark Fvd/F0 was much smaller in
198
S. elongatus than in Synechocystis (0.22 versus 1.09). By contrast, small differences were
199
observed in the Fvb/F0 ratio (0.83 versus 1.26). These data suggest that dark-adapted S.
200
elongatus cells were in a “stronger” State II than Synechocystis cells.
201
In order to elucidate whether this could be explained by a more reduced PQ pool in
202
dark-adapted S. elongatus, we estimated the redox state of the PQ pool in each strain by
203
measuring fluorescence induction curves in the absence and presence of DCMU, which
204
inhibits electron transfer between the primary (QA) and secondary (QB) quinones in PSII
205
(Figure 6). When dark-adapted cells are illuminated, the PQ pool becomes more reduced and
206
the photochemical centers become partially closed. As a consequence, a concomitant
207
fluorescence increase is observed until a steady state level is reached. The increase kinetics
208
depends on both the initial redox state of the PQ pool and its rate of photochemical reduction
209
under illumination. However, when DCMU is present,a maximum level of fluorescence is
210
reached in which all the centers are closed and the rate of fluorescence increase depends only
211
on the antenna size and is independent of the dark redox state of the PQ pool. Figure 7 (A and
212
B) shows the fluorescence induction curves in the presence and absence of DCMU for S.
213
elongatus and Synechocystis dark-adapted cells. The area between the curves is much larger
214
for dark-adapted Synechocystis than for S. elongatus cells (59% vs. 33% of the DCMU area,
215
respectively).
216
Because the area between the curves is at least partially proportional to the amount of
217
dark-oxidized PQ (Bennoun, 1982; Srivastava et al., 1995), these results suggest that the PQ
218
pool is more reduced in dark-adapted S. elongatus cells than in Synechocystis. However,
219
under illumination, the rates of PQ reduction by PSII and of PQH2 (reduced PQ) reoxidation
220
by PSI also affect the kinetics of fluorescence induction. These rates could be different
221
between the strains, as the PSI to PSII and the phycobiliprotein to chlorophyll ratios are
222
different in Synechocystis and S. elongatus. Therefore, we performed a control experiment in
223
which the PQ dark reduction level in each strain was modified without changing the size of
224
the antenna or PSI and PSII activities. The dark PQ redox state depends on the relative
225
activities of NDH-1/SDH and of cyanide-sensitive terminal oxidases (Cyd and Cox) (see
226
Figure 6); thus, the addition of sodium cyanide (NaCN) should lead to a large PQ-reduction
227
level. A large effect of NaCN was observed in Synechocystis cells, in which the area between
228
the curves (+/- DCMU) decreased from 59 in the absence of NaCN to 27% in its presence
9
(Figure 7). By contrast, the effect was much smaller in S. elongatus cells, with only a decrease
230
from 33 to 24% (Figure 7). These results strongly suggest that the PQ pool was more strongly
231
reduced in S. elongatus than in Synechocystis.
232
The illumination of blue-light adapted cells with orange light (which preferentially
233
excites phycobiliproteins) induced a decrease in Fm’ in both cyanobacterial strains (Figure 5).
234
In Synechocystis cells, the steady state Fmo was similar to Fmd, whereas in S. elongatus, the
235
Fmo was higher. As already mentioned, the “strength” of State II depends on the concentration
236
of reduced PQ. Thus, our results indicate that the PQ pool was more strongly reduced in
dark-237
adapted S. elongatus than in orange light-illuminated cells. This was not the case in
238
Synechocystis cells, where the redox state of the PQ pool appeared to be similar under both
239
conditions.
240 241
Is cytochrome b6f involved in state transitions in S. elongatus?
242
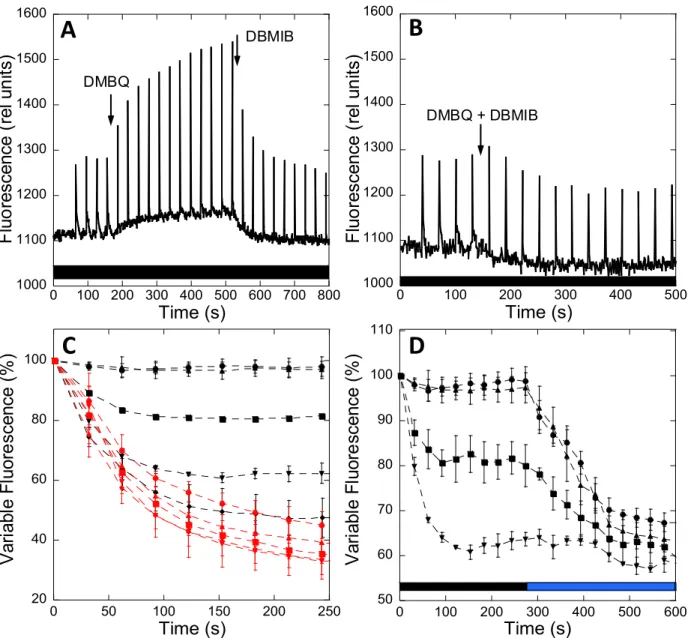
Effect of DMBQ and DBMIB on state transitions.
243
Mao et al. (Mao et al., 2002) and Huang et al. (Huang et al., 2003) proposed that cyt
244
b6f is involved in the signaling pathway of cyanobacterial state transitions, as observed in
245
green algae and plants. They based their proposal on the results obtained by chemically
246
inducing state transitions in Synechocystis and Synechococcus PCC 7002 using
2,6-247
dimethoxy-1,4-benzoquinone (DMBQ), p-benzoquinone (PBQ) and
2,5-dibromo-3-methyl-6-248
isopropyl-p-benzoquinone (DBMIB). DMBQ and PBQ accept electrons from the PQ pool
249
(Preston and Critchley, 1988), while DBMIB inhibits cyt b6f activity by attaching to the Qo
250
site (the PQH2 binding site), preventing reoxidation of the PQ pool (Roberts and Kramer,
251
2001) (Figure 6). These authors found that the addition of DMBQ (or PBQ) to dark-adapted
252
cells induced an increase in Fmd, which they attributed to a partial transition to State I
253
triggered by oxidation of the PQ pool. The simultaneous addition of DMBQ and DBMIB
254
inhibited this increase. Both authors hypothesized that under these conditions, the PQ pool
255
remained oxidized, which led them to conclude that the binding of DBMIB to the cyt b6f Qo
256
site was primarily involved in the transition to State II. However, none of these studies
257
demonstrated that the PQ pool remained oxidized under these conditions.
258
Figure 8 shows the effect of DMBQ and DBMIB on Fmd in dark-adapted S. elongatus
259
cells. The addition of DMBQ (250 µM) induced a slow increase in Fmd (and F0) related to a
260
partial transition to State I. Higher concentrations of DMBQ cannot be used because they
261
induce fluorescence quenching. When DBMIB (20 µM) was subsequently added, a rapid
10
decrease of Fmd (and F0) was observed (Figure 8A). When both chemicals were
263
simultaneously added, the DMBQ-induced increase in fluorescence was inhibited (Figure
264
8B). These effects of chemicals were therefore similar to those previously observed in
265
Synechocystis and Synechococcus PCC 7002 cells (Huang et al., 2003; Mao et al., 2003).
266
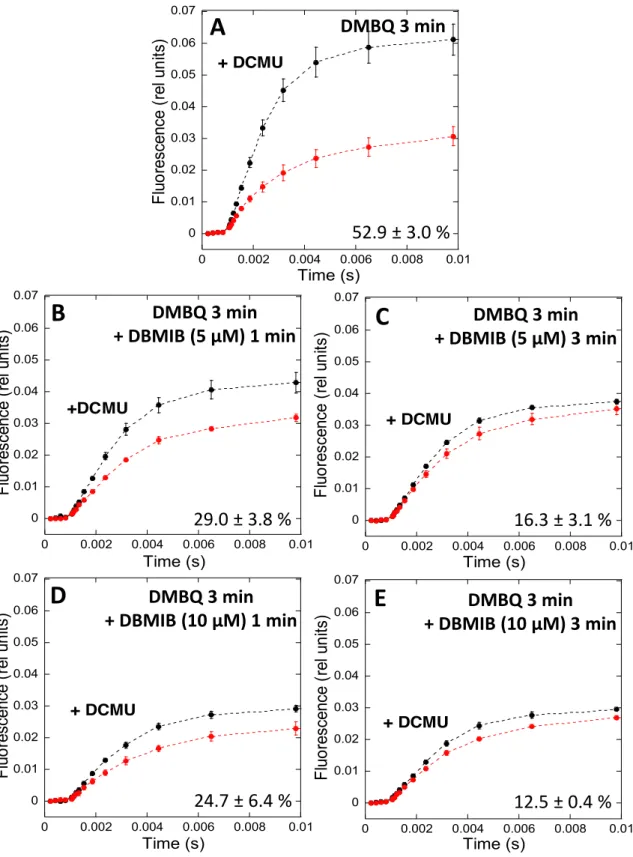
We then explored the dark redox state of the PQ pool in S. elongatus cells by
267
analyzing the kinetics of fluorescence induction in the presence and absence of DCMU (as
268
described in the previous section). The measurements were carried out in dark-adapted cells
269
(15 min) in the presence of DMBQ alone (250 µM) or DMBQ and DBMIB (5 and 10 µM).
270
The measurements were done after 3 min of incubation with DMBQ and at 1 and 3 min after
271
the addition of DBMIB (Figure 9). As mentioned above, the PQ pool is reduced in
dark-272
adapted S. elongatus cells: the area between the curves (+/- DCMU) is small and Fmd is low
273
(Figure 7A). The addition of DMBQ increased the level of Fmd and the area between the two
274
curves (+/- DCMU), suggesting that the PQ pool had become oxidized (Figure 9A). Since
275
DMBQ also accepts electrons from the PQ pool during the light measurement, the larger area
276
between the curves is also partially related to its activity during the measurement.
277
The addition of 5 µM DBMIB induced a rapid decrease of Fmd and of the area between
278
the curves. The smaller area indicated that the PQ pool was more strongly reduced in darkness
279
and during the light measurement in the presence of DBMIB (Figure 9B). Longer periods of
280
incubation with DBMIB induced a larger decrease in area, indicating a larger reduction of the
281
PQ pool even in the presence of DMBQ (Figure 9C). In line with these results, the addition of
282
10 µM DBMIB had a faster and larger effect (Figure 9D and E). Thus, the DMBQ-induced
283
transition to State I is inhibited by DBMIB, likely because DBMIB treatment leads to the
284
reduction of the PQ pool, even in the presence of DMBQ, at least in S. elongatus.
285
We further studied the effects of DBMIB by adding different concentrations of this
286
chemical (2.5, 5, 10, 15 and 20 µM) to S. elongatus cells adapted to State 1 by illumination
287
with blue-green light or by adding DMBQ in darkness (Figure 8C). Under illumination, all
288
concentrations of DBMIB efficiently induced a large transition to State 2 with rather similar
289
kinetics (red curves). However, concentrations higher than 5 µM were necessary to induce the
290
transition to State 2 in darkness and in the presence of DMBQ. In this case, the rate and
291
amplitude of the transition depended on DBMIB concentration. Thus, the same concentration
292
of DBMIB had different effects under illumination and in darkness, in the presence of
293
DBMQ. For example, 5 µM DBIMB induced almost maximum fluorescence quenching under
294
illumination but was unable to induce any quenching in darkness in the presence of DMBQ.
295
Upon illumination of dark-adapted cells in the presence of DMBQ and different
11
concentrations of DBMIB (2.5, 5, 10, 15 µM), larger fluorescence quenching was induced
297
(Figure 8D). These results strongly suggest that the transition to State II is induced by the
298
reduction of the PQ pool and not by the binding of DBMIB to the Qo site in cyt b6f.
299 300
Effect of the TMPD on state transitions
301 302
We then looked for another chemical compound that does not interact with cyt b6f and
303
can oxidize the PQ pool in the presence of DBMIB to further confirm that this complex does
304
not play a role in state transitions. N,N′,N′-tetramethyl-p-phenylenediamine (TMPD)
305
represents such a compound, since it restores oxygen evolution by reversing the inhibitory
306
effect of DBMIB on the photosynthetic electron transport chain (Draber et al., 1970; Nanba
307
and Katoh, 1985) (Figure 6). Nanba and Satoh (Nanba and Katoh, 1985) demonstrated that
308
TMPD accepts electrons from the PQ pool and directly donates them to P700+, bypassing the
309
DBMIB-poisoned cyt b6f complex. However, TMPD is also a good electron acceptor from
310
PSI and can generate cyclic electron transfer around PSI (Hiyama and Ke, 1972) (Figure 6).
311
This chemical has opposite effects on state transitions, depending on the preferential electron
312
donor to TMPD (PQ pool versus PSI).
313
It is expected that, under blue-light in the absence of DBMIB (State I), the addition of
314
TMPD should have no effect on fluorescence if TMPD is efficient at oxidizing reduced PQ,
315
as the PQ pool should remain oxidized. However, exactly the opposite effect was observed: a
316
large quenching of fluorescence was induced upon TMPD addition. The amplitude of
317
quenching depended on the TMPD concentration (Supplemental Figure 4A-D). This effect
318
can be explained by assuming that, under these conditions, TMPD is primarily involved in
319
cyclic electron transport and functions poorly as an oxidizer of reduced PQ. Cyclic electron
320
transport also limits linear electron flow through cyt b6f and consequently contributes to PQ
321
reduction. In accordance with the poor efficiency of TMPD in oxidizing reduced PQ under
322
these conditions, the addition of TMPD to DBMIB-poisoned cells led to no change in
323
fluorescence, indicating that State II was maintained (Supplemental Figure 4E). In addition,
324
TMPD did not hinder the effect of DBMIB on state transitions: large fluorescence quenching
325
was observed even in the presence of TMPD (Supplemental Figure 4F).
326
In an attempt to modify the behavior of TMPD, we added methyl viologen (MV) to
327
the reaction. MV is a good electron acceptor from PSI that could compete with TMPD at this
328
level. This approach was found to be successful: the addition of DBMIB following that of
329
TMPD led to only a small decrease in fluorescence, indicating that under these conditions,
12
TMPD was efficient at performing electron uptake from the PQ pool (Supplemental Figure
331
4G). Notably, the presence of MV did not affect state transitions in the absence of TMPD
332
(Supplemental Figure 4F and G).
333
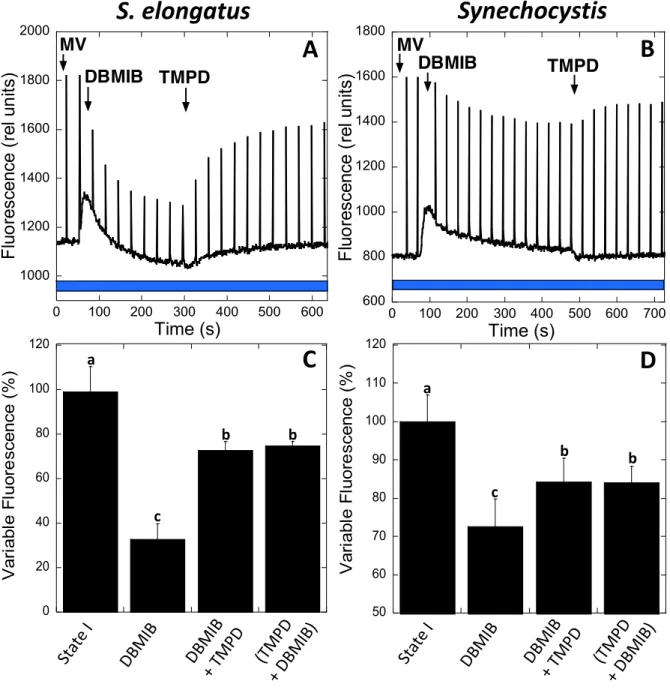
More importantly, when TMPD was added in the presence of MV to largely quenched
334
DBMIB-poisoned cells, it induced a large increase in fluorescence related to the transition to
335
State 1 (Figure 10). The final Fv was 70% that of cells under blue-light illumination in the
336
absence of chemicals. The transition to State 1 induced by TMPD under blue-light
337
illumination was larger than that induced by DMBQ in darkness (55%). Thus, TMPD is able
338
to reverse the effect of DBMIB by taking electrons from PQ and giving them to PSI,
339
bypassing the inhibited cyt b6f complex. Similar results were obtained with Synechocystis
340
cells using 3 mM MV and 7.5 µM TMPD (Figure 10). In conclusion, the transition to State I
341
can be induced even when cyt b6f is inhibited by DBMIB by partially oxidizing the PQ pool.
342 343
Are protein phosphorylation reactions required for cyanobacterial state transitions?
344
In plants and green algae, conformational changes induced in the cyt b6f complex
345
(especially in the Rieske protein) by the occupancy of the Qo site by a PQH2 molecule (Zhang
346
et al., 1998; Zito et al., 1999; Breyton, 2000; Finazzi et al., 2001) activates a specific kinase
347
(STN7/Stt7) (Depege et al., 2003; Bellafiore et al., 2005)), which phosphorylates the mobile
348
trimers of LHCII, inducing their detachment from PSII. As previously mentioned, at least two
349
studies suggested that protein phosphorylation by one specific Ser/Thr kinase could also
350
trigger cyanobacterial state transitions (Allen et al., 1985; Chen et al., 2015). To test this
351
hypothesis, we created Synechocystis protein kinase and phosphatase mutants. Synechocystis
352
has 12 genes encoding putative Ser/Thr kinases (SPTKs). Seven of these genes encode
353
proteins belonging to the PKN2 subfamily (spkA to spkG) and five belonging to the ABC1
354
subfamily (spkH to spkL) (Zorina, 2013). Each gene was individually deleted by replacing it
355
with a kanamycin resistance cassette (see Methods for details). We also individually deleted
356
genes encoding nine phosphatases: slr0328 (PTP family), sll1771, slr1860, sll1033, sll0602,
357
slr0114, slr1983 (PPM family), sll1387 (PPP family) and slr0946. Thus, we created 12 single
358
Synechocystis kinase mutants and 9 single Synechocystis phosphatase mutants. To determine
359
if the mutants were affected in state transitions, we illuminated dark-adapted mutant cells with
360
blue light to induce the transition to State I, followed by orange light to induce the transition
361
to State II (Figure 11). All of the dark-adapted single mutants went to State I upon blue light
362
illumination and then to State II during orange light illumination (Figure 11 and Supplemental
363
Figure 5). The rates of decrease in fluorescence during the State I to State II transition were
13
similar in WT and mutant cells (Figure 11 and Supplemental Figure 5). These experiments
365
indicate that no specific Ser/Thr kinase or phosphatase is involved in cyanobacterial state
366
transitions, as it is the case in green algae and plants.
367
To confirm that phosphorylation reactions are not essential for cyanobacterial state
368
transitions, we tested the effects of kinase and phosphatase inhibitors on Synechocystis and S.
369
elongatus. Staurosporine and K252a (a derivative of staurosporine) are potent inhibitors of
370
Ser/Thr and Tyr kinases that interact with their ATP binding sites ((Fernandez et al., 2006;
371
Nakano and Omura, 2009)). NaF inhibits Ser/Thr and acid phosphatases and Na3VO4 inhibits
372
Tyr and alkaline phosphatases ((Delphin et al., 1995; McCartney et al., 1997) and references
373
inside). Staurosporine and NaF were shown to inhibit state transitions in the green alga
374
Chlamydomonas reinhardtii ((Delphin et al., 1995) and references inside). Figure 12 shows
375
that the presence of staurosporine or K252a, which were added in excess (21 µM and 1 µM,
376
with the IC50 of these compounds 0.6 µM and 96 nM, respectively (Nakano and Omura,
377
2009)) did not inhibit state transitions in Synechocystis or S. elongatus.
378
To confirm that these kinase inhibitors are able to enter cyanobacterial cells and inhibit
379
phosphorylation reactions, we tested their effects on the phosphorylation of the PII protein in
380
S. elongatus. The PII protein (glnB gene product) is involved in the tight coordination of
381
carbon and nitrogen assimilation. Its activity involves the phosphorylation and
382
dephosphorylation of a Ser residue (Forchhammer and Tandeau de Marsac, 1995a, 1995b). In
383
ammonium-grown cells, PII is completely dephosphorylated. The transfer of cells to medium
384
lacking combined nitrogen induces phosphorylation of PII (Forchhammer and Tandeau de
385
Marsac, 1995a, 1995b). The phosphorylation state of PII can be analyzed by gel
386
electrophoresis in a phos-tag gel SDS page system and by immunoblot detection. In this
387
system, phosphorylated proteins migrate more slowly than non-phosphorylated ones
388
(Kinoshita and Kinoshita-Kikuta, 2011). Figure 12G shows that the presence of staurosporine
389
and K252a completely inhibited the phosphorylation of the PII protein under nitrogen
390
starvation conditions. This result indicates that both kinase inhibitors entered into S. elongatus
391
cells and were able to inhibit protein phosphorylation.
392
Finally, phosphatase inhibitors (NaF and Na3VO4) also did not affect state transitions
393
(Figure 13). Nevertheless, NaF induced the partial inhibition of the oxygen evolving activity
394
of PSII (Supplemental Figure 6) and a general decrease in fluorescence (Figure 13) in
395
Synechocystis, indicating that this chemical entered the cells. In conclusion, our experiments
396
show that phosphorylation reactions are not involved in cyanobacterial state transitions.
397 398
14
DISCUSSION
399
While the mechanism of state transitions in plants and green algae has been largely
400
elucidated, it remains to be characterized in cyanobacteria. Contradictory hypotheses have
401
been proposed about cyanobacterial state transitions based on studies addressing different
402
aspects of the mechanism: the movement of PBS, spillover, reorganization of membrane
403
complexes, involvement of Cyt b6f and/or phosphorylation reactions in signal transduction.
404
However, none of these hypotheses has been definitively supported. Our results help to
405
elucidate open questions about the mechanism behind the large fluorescence quenching
406
observed in State II and the alleged role of the cyt b6f complex in the signaling pathway
407
involved in cyanobacterial state transitions.
408 409
The contributions of phycobilisome versus the membrane to state transitions
410
It was previously shown that PBS can easily move and that high concentrations of
411
betaine, sucrose and phosphate inhibit the diffusion of PBS and state transitions (Joshua and
412
Mullineaux, 2004; Li et al., 2004; Li et al., 2006). Li and coworkers (Li et al., 2004) also
413
observed that, in Spirulina platensis, betaine inhibits changes in 77 K emission spectra with
414
430 nm excitation. However, the authors did not discuss this last result. Based on these works,
415
it was concluded that the movement of PBS from one photosystem to the other was the main
416
reason for the observed changes in fluorescence. By contrast, we demonstrated that these
417
chemicals, in addition to hindering PBS movement, inhibit fluorescence changes that depend
418
on membrane processes. No fluorescence change in 77 K emission spectra was detected in the
419
presence of betaine, sucrose or phosphate upon cells illumination, not only when PBSs were
420
excited but also when Chl was excited. Thus, based on these experiments, it cannot be
421
concluded that the movement of PBS is the main contributor to state transitions in
422
cyanobacteria.
423
Our experiments did not allow us to distinguish which changes, if any, occur at the
424
level of PBS during state transitions: detachment of PBS from one or both photosystems or
425
changes in energy transfer from PBS to one or the other photosystem. Nevertheless, we
426
expect the contribution of these changes to be small in both S. elongatus and Synechocystis,
427
since the main increase in fluorescence emission from State II to State I was related to PSII
428
(G3, 695 nm emission peak) (Supplemental Figures 1 and 2).
429 430
Photosystem II quenching is involved in State II
15
Van Amerongen’s group recently showed that state transitions involve a reversible
432
quenching of PSII fluorescence independently of spillover changes in S. elongatus cells
433
(Ranjbar Choubeh et al., 2018). They measured the fluorescence decay kinetics of cells in
434
State II and State I with a streak camera using 430 nm or 577 nm excitation at 77 K. By
435
performing global analysis of the data, the authors obtained decay-associated spectra. When
436
430 nm excitation was used, PSII emission decreased, but the decay-associated spectra
437
showed that PSI emission was similar in State I and State II. This argues against a change in
438
spill-over during state transitions. This was also observed in Synechocystis cells (Ranjbar
439
Choubeh et al., 2018).
440
Our results confirm these observations. We showed that both the 683 nm and 695 nm
441
peaks decrease in State II (under Chl and PBS excitation), whereas the 718 nm peak did not
442
change (see Supplemental Figures 1 and 2, including peak deconvolution to visualize different
443
components of the spectra). The absence of changes in PSI-related fluorescence during state
444
transitions was confirmed by normalizing the spectra with an external dye (Rhodamine B)
445
(Figure 3). These results indicate that PSII emission is largely quenched in State II and that
446
spillover from PSII to PSI does not contribute to this quenching. The PSII-related quenching
447
mechanism remains to be elucidated.
448 449
The role of Cyt b6f in cyanobacterial state transitions
450
One of the big questions that remain to be answered about the mechanism of
451
cyanobacterial state transitions is how the signal is transmitted from the PQ pool to the PBS
452
and/or photosystems to induce their movements or fluorescence quenching. In plants and
453
green algae, the binding (and subsequent release) of PQH2 in the Qo site of the cyt b6f
454
complex plays a critical role in the activation of a specific Ser/Thr kinase that phosphorylates
455
LHCII (Vener et al., 1995; Vener et al., 1997; Zito et al., 1999). The phosphorylated LCHII
456
detaches from PSII and totally (or partially) associates with PSI (Vener et al., 1997; Wollman,
457
2001). The role of the Qo site in state transitions was first suggested based on the effect of
458
DBMIB in Chlamydomonas, where DBMIB inhibits State I to State II transition, although in
459
its presence, the PQ pool is largely reduced (Finazzi et al., 2001). By contrast, in
460
cyanobacteria, DBMIB induces the State I to State II transition. This occurs even in the
461
presence of DCMU (which inhibits photoreduction of the PQ pool by PSII) or DMBQ (which
462
oxidizes the PQ pool by taking electrons from PQH2)(present results and (Mao et al., 2002;
463
Huang et al., 2003)). These authors proposed that the action of DBMIB is related to its
16
binding to the Qo site and not to the reduction of the PQ pool. The authors assumed that the
465
PQ pool remains oxidized in the presence of both DBMIB and DMBQ (or PBQ).
466
Here, we demonstrated that this is not true, as the addition of DBMIB induced
467
reduction of the PQ pool even in the presence of DMBQ. Moreover, we demonstrated that the
468
same concentration of DBMIB has different effects on state transitions depending on the
469
experimental conditions. For instance, DBMIB at 5 µM was unable to induce the transition to
470
State II in dark-adapted cells in the presence of DMBQ, whereas it induced large quenching in
471
blue-green light-adapted cells in the absence or presence of DMBQ. The amplitude of
472
fluorescence quenching induced by 10 µM DBMIB was also larger under illumination than in
473
darkness in the presence of DMBQ. Altogether, these experiments strongly suggested that the
474
cyt b6f complex is not involved in cyanobacterial state transitions. The finding that the
475
addition of TMPD to DBMIB-poisoned cells induced a large increase in fluorescence related
476
to PQ oxidation and transition to State I indicates that DBMIB binding to the Qo site of cyt
477
b6f is not involved in the transition to State II. Under these conditions, DBMIB remained
478
attached to the Qo site, and the cyt b6f complex was inactive. As an alternative, it was recently
479
proposed that the single chlorophyll a (Chl a) molecule present in cyt b6f could act as a redox
480
sensor and signal transmitter during state transitions (Vladkova, 2016). This Chl a molecule is
481
evolutionarily conserved and is present in all oxygen-evolving photosynthetic species
482
(Vladkova, 2016). However, changes in this Chl a were induced by binding of DBMIB or
483
PQH2 to the Qo site. Thus, based on our results, the involvement of this Chl a molecule in
484
cyanobacterial state transitions is not likely.
485
In addition, the characterization of 12 kinase and 9 phosphatase single mutants
486
demonstrated that no specific protein kinase and/or phosphatase is necessary for
487
cyanobacterial state transitions. More generally, the use of kinase and phosphatase inhibitors
488
demonstrated that phosphorylation reactions are not essential for state transitions in
489
Synechocystis and S. elongatus. Thus, signal transduction from the PQ pool to the antenna and
490
the photosystems is completely different in cyanobacteria vs. green algae and plants.
491
While DCMU and DBMIB have opposite effects on cyanobacterial state transitions,
492
they have the same effect on the transcription of photosynthetic genes (Alfonso et al., 1999;
493
Alfonso et al., 2000; El Bissati and Kirilovsky, 2001). Both DCMU and DBMIB induced an
494
increase in psbA transcription and a decrease in psaE transcription when added into
495
Synechocystis cells under white and orange illumination. These findings strongly suggest that
496
cyt b6f is involved in the redox transcriptional regulation of photosynthetic genes in
497
Synechocystis (Alfonso et al., 1999; Alfonso et al., 2000; El Bissati and Kirilovsky, 2001). In
17
conclusion, cyt b6f is not involved in cyanobacterial state transitions, but it appears to be
499
involved in redox transcriptional regulation.
500
Since it seems that in cyanobacteria, the principal effect of PQ reduction is an increase
501
in PSII quenching and that cyt b6f is not involved in the signaling pathway, it is tempting to
502
hypothesize that PSII itself senses the redox state of the PQ pool. Sensing cannot be linked to
503
QA- accumulation because both the presence of DCMU and the reduction of the PQ pool
504
increase QA-concentration, but while DCMU induces the transition to State I, the reduction of
505
the PQ pool induces the transition to State II. DCMU binding and over-reduction of the PQ
506
pool were previously found to accelerate photoinhibition but through different mechanisms
507
(Kirilovsky et al., 1994; Fufezan et al., 2005; Fischer et al., 2006). In line with this
508
observation, the QB site could be modified differently in the presence of DCMU or PQH2,
509
leading to different effects on QA redox potential, recombination reactions, and the generation
510
of PSII quenching related to State II.
511
The PQ pool redox state could be sensed not only at the level of the QB site but also
512
by the QC hydrophobic tunnel. The existence of this Qc tunnel formed by cyt b559 and psbJ
513
was suggested by the X-ray crystallographic structural model of PSII of
514
Thermosynechococcus elongatus at 2.9 Å resolution (Guskov et al., 2009). The function of
515
this tunnel as a quinone binding site remains to be confirmed, since later structures at higher
516
resolution did not contain a quinone in this hydrophobic pocket (Umena et al., 2011).
517
However, Synechocystis mutants containing mutations around the proposed QC site show
518
altered state transitions, making this site another interesting target of study (Huang et al.,
519
2016).
520
In addition of these QB/C sites, there are other ways by which the redox state of the PQ
521
pool could be sensed; the participation of other known proteins or novel factors in the
522
signaling pathway cannot be ruled out. Overall, while the PSII-quenching mechanism and the
523
redox sensor of the PQ pool remain to be elucidated, our results rule out the involvement of
524
cyt b6f in this process.
525 526
METHODS
527Culture conditions and replicates
528
The cyanobacteria Synechocystis PCC 6803 and Synechococcus elongatus (PCC 7942)
529
strains were grown photo-autotrophically in BG11 medium (Herdman et al., 1973). The cells
18
were incubated in a rotary shaker (120 rpm) at 31 °C illuminated by fluorescence white lamps
531
(50 µmol photons m-2 s-1) under a CO2 enriched atmosphere. The cells were maintained in
532
their logarithmic phase of growth for all experiments. The kinase and phosphatase mutants
533
were grown in the presence of kanamycin (40 µg/mL).
534
A biological replicate is a batch of cells on a particular day. The measurements were
535
performed several times using the same batch of cells (technical replicates). The mean of each
536
batch was calculated. The biologically independent experiments were performed on different
537
days separated by at least a week. Thus, completely different cells were tested.
538 539
Construction of kinase and phosphatase mutants
540
To obtain the kinase mutants (∆spkB, ∆spkD, ∆spkE, ∆spkF, ∆spkG, ∆spkI, ∆spkJ,
541
∆spkK, ∆spkL) a 500 bp fragment in the upstream region of each kinase gene was cloned into
542
the pMD T-18 vector (Takara, Japan) and digested with XbaI. The PRL446 plasmid
543
containing the kanamycin cassette was also digested with XbaI. Both linear fragments were
544
ligated to generate the plasmid use to transform Synechocystis WT cells in order to obtain the
545
knockout kinase mutants. The strategy to obtain the ∆spkA and the ∆spkC mutants was similar
546
with only two minor modifications: 1) the plasmid containing the 500 bp upstream fragment
547
was digested with SmaI instead of XbaI. 2) To obtain the final construction, the linearized
548
plasmid was ligated to the kanamycin cassette with blunt ends, and the
pPM-kinase-upper-549
kanamycin was obtained.
550
In parallel, a 500 bp fragment in the downstream region of each kinase gene was
551
cloned into the pMD T-18 vector (Takara, Japan) and digested with SalI to generate the
552
downstream fragment. Blunt ends were generated in the downstream fragment and in the
553
pPM-kinase-upper-kanamycin linearized using the SacI/SphI enzyme. The resulting blunt-end
554
DNAs were ligated together. After testing the direction of the inserted downstream fragment
555
by PCR, the pPM-kinase-upper-kanamycin-down was used to transform WT Synechocystis
556
cells.
557
To obtain the phosphatase mutants (∆slr0328, ∆sll1771, ∆slr1860, ∆sll1033, ∆sll0602,
558
∆slr0114, ∆slr1983, ∆sll1387 and ∆slr0946), a 500 bp fragment upstream of each
559
phosphatase gene, the kanamycin cassette and a 500 bp fragment downstream of each
560
phosphatase gene were spliced together using the PCR overlap extension method to obtain the
561
upper-kanamycin-down DNA fragment for each phosphatase gene. The resulting DNA
562
fragments were supplemented with a thymine at both termini and inserted into the T-cloning
19
vector pMD T-18 (Takara, Japan) to generate the final
pPM-phosphatase-upper-kanamycin-564
down plasmids.
565
Synechocystis WT cells were transformed with these plasmids to obtain the knockout
566
kinase and phosphatase mutants. The presence of the kanamycin cassette replacing the kinase
567
and phosphatase genes and the complete segregation of each mutant were tested by PCR
568
amplification and sequencing.
569
The oligonucleotides used in these constructions are described in Supplemental Table
570
1.
571
The spkH Synechocystis mutant was kindly provided by Dr. Anna Zorina (Dimitry
572
Los laboratory), and its construction is described in (Zorina et al., 2011).
573
Fluorescence measurements
574
PAM fluorometer
575
State transitions were monitored using a pulse amplitude modulated fluorometer
576
(101/102/103-PAM; Walz, Effeltrich, Germany) in a 1x1 cm square stirred cuvette. All
577
experiments were carried out at 31°C on dark-adapted (15 min) whole cells at a chlorophyll
578
concentration of 2.5 μg/mL. State I was induced by treatment with 85 µmol photons m-2 s-1 of
579
blue-green light (halogen white light filtered by a Corion cut-off 550-nm filter; 400 to 500
580
nm). State II was induced by treatment with 25 (or 40) µmol photons m-2 s-1 of orange light
581
(halogen white light filtered by a Melles Griot 03 FIV 046 filter; 600 to 640 nm) or by dark
582
incubation. Saturating flashes (400 ms x 1200 µmol photons m-2 s-1) were given to probe the
583
maximum fluorescence level. The fluorescence parameters used in the analysis are the
584
following: F0, basal fluorescence; Fmd, maximum fluorescence in darkness; Fm’, maximum
585
fluorescence under illumination; Fmb’, maximum fluorescence under blue-light illumination;
586
Fmo’, maximum fluorescence under orange light illumination; Fv = variable fluorescence = Fm
-587
F0; Fvd, variable fluorescence in darkness; Fvb, variable fluorescence under blue-light
588
illumination.
589
State transitions in the spkH mutant was measured in Turku (Finland) with a
dual-590
PAM and compared to its own WT. State I was induced by treatment with 50 µmol photons
591
m-2 s-1 of blue-light (460 nm) and then State II by treatment with 50 µmol photons m-2 s-1 of
592
orange light (635 nm). The measuring light was at 620 nm.
593
When mentioned, 2,6-dimethoxy-1,4-benzoquinone (DMBQ, 250 µM) and/or
2,5-594
dibromo-3-methyl-6-isopropyl-p-benzoquinone (DBMIB, 2.5 to 20 µM), methyl viologen (2
20
mM or 3 mM) or N,N,N′,N′-tetramethyl-p-phenylenediamine (TMPD, 7.5 or 10 µM) were
596
added to the stirred cuvette.
597
When mentioned, staurosporine (21 µM), K252a (1.07 µM), NaF (50 or 100 mM) or
598
Na3VO4 (1 mM) were added to dark-adapted cells. The kinase inhibitors were incubated for
599
90 min and the phosphatase inhibitors for 1 hour. Longer incubations gave the same results.
600
State transitions were then measured.
601 602
PQ pool redox state estimations
603
The PQ pool redox state was estimated by measuring fluorescence induction curves in
604
the presence and absence of DCMU in a PSI fluorometer (PSI Instruments, Brno, Czech
605
Republic). Whole cells (Chl concentration 2.5 μg/mL) were dark-adapted for 15 min at 31°C,
606
and illuminated (orange light 180 µmol photons m-2 s-1, λ = 630 nm) in the 1-ms to 1-s time
607
range with or without 3-(3,4-dichlorophenyl)-1,1-dimethylurea (DCMU, 10 μM). The
608
measuring light for these experiments was blue (λ = 460 nm), and detection was in the far-red
609
region (≥ 695 nm). The fluorescence induction curves were followed in each case, and the
610
area between them was considered to be proportional to the oxidation state of the PQ pool. In
611
addition, measurements in the presence of DMBQ (250 µM) and/or DBMIB (5 or 10 µM),
612
with or without DCMU (10 μM) were performed.
613 614
Fluorescence emission spectra
615
77 K Fluorescence emission spectra were monitored in a CARY Eclipse
616
spectrophotometer (Varian, Santa Clara, USA). In all cases, whole cells (Chl concentration
617
5.0 μg/mL) were dark-adapted for 15 min before the measurements. Then, spectra were
618
recorded corresponding to State II. For State I spectra, cells were illuminated for 5 min with
619
85 µmol photons m-2 s-1 of blue-green light (halogen white light filtered by a Corion cut-off
620
550-nm filter; 400 to 500 nm). Samples were collected in RMN tubes and frozen by
621
immersion in liquid nitrogen. Excitation was made at 430 nm or 590 nm, and emission was
622
scanned from 620 nm to 800 nm. All the spectra were normalized by the signal intensity at
623
800 nm. When Rhodamine B (0.4 µM) was added as an internal standard, excitation was
624
made at 430 nm and emission was scanned from 550 nm to 800 nm. In these cases, the spectra
625
were normalized to the Rhodamine B peak at 568 nm.
21
To address the effects of high osmotic buffers in state transitions, betaine (1 M),
627
sucrose (1 M) or K2HPO4/KH2PO4 buffer (0.5 M, pH 7.5) was added to cells pre-adapted to
628
State I or State II. The cells were incubated with the different buffers for 5 min, before State II
629
or I was induced by darkness or blue-light illumination (5 min), respectively. Samples were
630
taken before and after 5 min incubation with the chemicals and at the end of the light/dark
631
treatment. Excitation was at 430 nm or 590 nm, and emission was scanned from 620 nm to
632
800 nm. All of the spectra were normalized by the signal intensity at 800 nm.
633 634
EPR measurements
635
To assess the PSI/PSII ratio in the cyanobacterial strains, reduced FA/FB Fe-S centers
636
and TyrD+ were measured as an estimation of PSI and PSII levels, respectively. First, 300 mL
637
of cells (OD800 = 1.0) were harvested and washed with 50 mL of washing buffer (50 mM
638
HEPES pH 8.0, 5 mM MgCl2). The cells were then centrifuged at 6000 rpm for 10 min at 20
639
°C and washed again with 25 mL of washing buffer. This step was repeated and the cells were
640
washed with 2 mL of buffer. Finally, the cells were centrifuged at 3500 rpm for 10 min at 20
641
°C and re-suspended in 500 µL of buffer.
642
Calibrated EPR tubes were prepared with 150 µL of concentrated cells and 20 µL of
643
200 mM potassium ferricyanide. The tubes were illuminated for 30 sec and incubated in
644
darkness for 5 sec before freezing. This treatment elicited full oxidation of TyrD+ with no or
645
very little P700+ (a few percent). In case some P700+ was present, its contribution was
646
substracted in order to obtain a pure TyrD+ line shape before spin quantitation. The spectra
647
were recorded at 20 K with an ESR300D X-band spectrometer (Bruker, Rheinstetten,
648
Germany), using a TE102 resonator equipped with a front grid for sample illumination within
649
the cavity. Illumination was performed using a halogen lamp (250 W). The temperature was
650
controlled with a helium cryostat (Oxford Instruments, UK). Samples were first measured in
651
darkness for TyrD+ spectra and FA/FB baseline, and then, after 2 min illumination at 20 K, for
652
the singly reduced FA/FB spectra. The FA/FB difference light-induced spectrum was used for
653
quantitation after suppressing the P700+ signal. Isolated PSI was used to check that charge
654
separation was 100% efficient at 20 K by comparing the dithionite-reduced (FA-/FB-) spectrum
655
(2 spins per P700) to the light-induced singly reduced FA/FB difference spectrum (1 spin per
656
PSI). The following EPR parameters were used: for TyrD+, modulation amplitude: 2 G,
657
microwave power: 2 µW, number of scans: 8. For FA/FB spectra, modulation amplitude: 10 G,
658
microwave power: 0.8 mW, number of scans: 2. These microwave powers were found to be
659
non-saturating at 20 K. The singly reduced (FA/FB)and TyrD+ relative spin amounts were