Crowdsourcing Moral Psychology
by
Sohan Savio Dsouza
B.S., Illinois Institute of Technology (2004)
M.B.A., SP Jain Centre of Management (2007)
M.S., British University in Dubai (2009)
Submitted to the Program in Media Arts and Sciences, School of
Architecture and Planning
in partial fulfillment of the requirements for the degree of
Master of Science in Media Arts and Sciences
at the
Massachusetts Institute of Technology
February 2021
c
○ Massachusetts Institute of Technology 2021. All rights reserved.
Author . . . .
Program in Media Arts and Sciences
January 22, 2020
Certified by . . . .
Andrew Lippman
Senior Research Scientist
Accepted by . . . .
Tod Machover
Academic Head, Program in Media Arts and Sciences
Crowdsourcing Moral Psychology
by
Sohan Savio Dsouza
Submitted to the Program in Media Arts and Sciences, School of Architecture and Planning
on January 22, 2020, in partial fulfillment of the requirements for the degree of
Master of Science in Media Arts and Sciences
Abstract
Ethical trade-off surveys have played a key role in building a data-driven understand-ing of human moral psychology. They have been conducted all over the world for decades, eliciting assessment of ethical dilemma outcomes from populations as diverse as those of rural, tribal settlements, and industrialized, information-age, cosmopoli-tan cities. While much data has been gathered through these surveys, attempts to compare what people across cultures consider ethically justifiable have been hindered by the fact that the surveys used have been reformulated for different cultures in the scenarios they depict, and in their framing. The objective of this thesis project is to build a survey tool with global reach and internationalized surveys, in order to collect survey data from around the world using consistent scenarios and framing. Building on the precedent and success of the Moral Machine tool for surveying people around the world regarding ethical dilemmas involving autonomous vehicles, I built and de-ployed a tool for conducting surveys with scenarios of the classic action/omission trolley problem, to collect ethical dilemma survey data internationally, in ten lan-guages, for three variants of the trolley problem – one for remote action/omission with no double effect consideration, one for double effect consideration with direct action/omission, and one for double effect consideration with remote action/omission. Analyzing data from this experiment, I conclude that differences in preferences across the variants are confirmed across populations, and that they are universal across pop-ulations in order of preference.
Thesis advisor: Andrew Lippman
Crowdsourcing Moral Psychology
by
Sohan Savio Dsouza
This dissertation/thesis has been reviewed and approved by the following committee members
Andrew Lippman . . . . Senior Research Scientist Massachusetts Institute of Technology
Joseph A. Paradiso . . . . Professor in Media Arts and Sciences Massachusetts Institute of Technology
Iyad Rahwan . . . . Director Max Planck Institute for Human Development
Acknowledgments
I thank the Massachusetts Institute of Technology and the MIT Media Lab for the opportunity to work on this project and to be a part of their scholarly communities. I thank my thesis advisor, Andrew Lippman, my thesis reader, Joseph A. Paradiso, and administration at the Lab, for guiding me through the final phases of this thesis. I wish to express my deep gratitude to Scalable Cooperation group principal in-vestigator Iyad Rahwan, for his pivotal mentorship and guidance in this project, this thesis, and much of my educational and career growth. I thank the rest of the Moral Machine team for working with me on the project: Edmond Awad (in whose own Mas-ters dissertation the Moral Machine features prominently, and to whom I specifically credit Section 3.1.1), Azim Shariff, and Jean-François Bonnefon.
I also thank others who contributed to the development of the Moral Machine platform: Paiju Chang (who additionally contributed significantly to the coding of the Classic trolley dilemma version) and Danny Tang.
I acknowledge the following publications that emerged from the project that in-cludes my thesis work, and credit all authors thereof:
∙ Edmond Awad, Sohan Dsouza, Richard Kim, Jonathan Schulz, Joseph Henrich, Azim Shariff, Jean-François Bonnefon, and Iyad Rahwan. "The Moral Machine experiment." Nature 563, no. 7729 (2018): 59-64.
∙ Awad, E., Dsouza, S., Bonnefon, J. F., Shariff, A., and Rahwan, I. (2020). "Crowdsourcing moral machines." Communications of the ACM, 63(3), 48-55. ∙ Awad, E., Dsouza, S., Shariff, A., Rahwan, I., and Bonnefon, J. F. (2020).
"Universals and variations in moral decisions made in 42 countries by 70,000 participants." Proceedings of the National Academy of Sciences, 117(5), 2332-2337.
In this project, I contributed hereby:
∙ Design of the experiment, especially story boards, visual design, user interface design, system architecture, and other aspects.
∙ Coding of the experiment platform, especially in the Design interface, Results screen, internationalization, and other components.
∙ Development of the public-facing experiment results visual exploration interface. ∙ Analysis of part of the data from the Classic trolley dilemma survey (presented
in this thesis).
I thank my father, Victor S. Dsouza, and my mother, Lizzie M. Dsouza, for support and motivation throughout my educational journey; my sister, Sharon D. Dsouza, for being an example and inspiration; my aunt, Daisy Godbole, and my uncle, Shyam Godbole, for encouraging me to seek opportunities for greater achievement; and all the educators, colleagues, counselors, family, and friends, who have helped me cope, grow, and learn.
Contents
1 Introduction 11
1.1 Motivation . . . 11
1.2 Research Questions . . . 12
2 Literature Review 13 2.1 The Trolley Problem . . . 13
2.2 Cross-Cultural Comparisons . . . 16
2.3 Limitations and Opportunities . . . 17
3 Experiment 19 3.1 Moral Machine AV . . . 19
3.1.1 Scenario Model Generation . . . 19
3.1.2 Scenario Element Design . . . 25
3.1.3 Interaction . . . 27 3.1.4 Results . . . 29 3.1.5 Demographic/Opinion Survey . . . 31 3.1.6 Create/Browse . . . 33 3.1.7 Social Sharing . . . 37 3.1.8 Other Features . . . 37 3.1.9 Data Gathering . . . 37 3.1.10 Communication . . . 38
3.2 Moral Machine Classic . . . 40
3.2.2 Scenario Element Design . . . 40 3.2.3 Interaction . . . 43 3.3 Experiment Ethics . . . 45 3.4 Architecture . . . 45 4 Results 47 4.1 Dataset . . . 47 4.2 Results by Variant . . . 48 4.3 Geographic . . . 49 5 Analysis 53 5.1 Limitations . . . 53 5.2 Implications . . . 54 5.3 Future Work . . . 55
Chapter 1
Introduction
In this section, I will describe my motivation for working on this project, and the questions I would like answered.
1.1
Motivation
With this thesis project, I seek to build an online platform for the study of moral psychology using the trolley problem. Previous attempts to study moral psychology have been dispersed inconsistently across geography and time, hindering efforts to study how populations in different places would assess the same dilemmas.
The study of moral psychology has significant implications in understanding how to communicate with people in matters where trade-offs might have to be made. A pandemic, for example, might pose a choice between committing a nation to an economically devastating lockdown, but one that can result in deaths of relatively fewer people.
The survey platform would also have far more flexibility than ordinary survey techniques, with several dimensions of variation in the trade-offs. This would also be of use in teasing out how people in different places might assess dilemmas differently if variables were changed in omission vs commission, or demographics, or the double effect dimension, which also has relevance with regard to situations like responding to and communicating regarding national public health crises in different parts of the
world.
In building the platform and exploring the data from some of the scenarios, I intend to demonstrate the efficacy of these methods towards taking the empirical study of moral psychology into new and exciting territory, that offers us a deeper understanding of how ethical apes think.
1.2
Research Questions
The thesis project will seek to answer the following questions:
1. How does the empirical study of moral psychology, and specifically ethical dilemma trade-offs, benefit from the use of online experimentation platforms? 2. Are there any differences in preference for sacrificial outcomes in different
un-avoidable harm dilemmas across populations?
3. Do differences in preference for sacrificial outcomes in unavoidable harm dilem-mas vary across populations in a consistent order?
Chapter 2
Literature Review
This section explores the trolley problem as a concept, along with its variants, and explores and caveats prior research using it and similar ethical dilemmas to conduct research into moral psychology across cultures, to emphasize the need for a platform like the one developed for this project.
2.1
The Trolley Problem
The trolley problem is a thought experiment used by moral philosophers to abstract away the complexities of ethical dilemmas involving unavoidable harm. The typical scenario involves a trolley careening down a track, and a hypothetical man placed before a switch. The man can pull the switch to divert the trolley onto a side track, where it will crash into and kill one worker on the track. Or the man can leave the switch untouched, and the trolley continues ahead, killing five workers on the straight track.
A number of variants have been proposed to account for different possible elements of moral decision-making that can factor into the choice. One is the doctrine of double effect [6], which posits that there is a fundamental difference in judgement between sacrificial outcomes that are intended by the action, and sacrificial outcomes that are side effects of the action. To address this, the “footbridge” variant was designed, with only a straight track over which a footbridge spans, and with five workers down
the track. The man is in the middle of the footbridge over the track, behind a large person (or a person with a large backpack, in some formulations). The man has the option of either pushing the person onto the track – thereby stopping the trolley by using the person’s bulk – or not doing anything, and letting the five workers on the track get hit and killed by the trolley.
Figure 2-1: The basic version of the Trolley Problem, posing a dilemma between inaction to sacrifice more lives on the one hand, and action to spare more lives on the other
One objection that could be raised to this variant is the introduction of the physical interaction between the man and the sacrificial victim, whereas the original trolley problem had the man merely pull a switch. As a result, the “loop” variant was proposed, which is similar to the original side-track form of the trolley problem, but places the five workers further down the track, and has the side track rejoin the main track before the section with the five workers begins, forming a loop track. The loop track has one worker on it; if the trolley hits this worker, the worker will die, but the trolley will be brought to a halt. Here, pulling the switch causes the trolley to be diverted onto the loop track, where it crashes into the worker and is thus prevented from going further to rejoin the main track, saving the lives of the five workers on it. If the man does not pull the switch, the trolley will remain on the main track, crashing into and killing the five workers [12]. The effect was surveyed in a WEIRD (Western, Educated, and from Industrialized, Rich, Democratic countries) respondent population [8], which found that there was a significant preference for side-effect harm over means-effect harm. This was backed up in a later, larger-scale replication-focused study [5].
for this is that in the loop variant, removing the physical interaction between the man and the victim also changes the effect of the action – from moving the victim into the path of the trolley, to moving the trolley onto the path of the victim. To return this element to the dilemma, a new scenario is constructed with all the elements of the footbridge variant, but with the man now at a switch some distance away, instead of behind the victim. If the man pulls the switch, a mechanism is activated to push the victim onto the tracks, killing the victim and stopping the train .
As popular as the trolley problem has been in experimental psychology studies, it has its limitations in getting respondents to relate to it or see it as realistic. This is especially an obstacle in pre-industrial societies that might not have encountered or even have the technology background to conceive of locomotives and rail switching. As a result, some alternative formulations have been used to pose similar utilitarian omission-commission dilemmas to respondents in these societies.
One formulation has five patients at a hospital in desperate need of a different organ each, when a patient in critical condition is brought in. The critical patient has all five organs in good condition, and an organ donor consent card. The doctor is faced with a choice to save the critical patient and let the five patients die from organ failure, or let that patient die and use their organs to save the five patients’ lives [12].
Another study [7] posed a fictional scenario dilemma between the inaction default of feeding one orphan, or diverting a virtual token that would instead activate food supply to five orphans.
Finally, in a survey conducted in a small-scale agrarian Mayan population [1], side effect and means effect dilemmas were presented in the forms of stories in the local language. The side effect story features an agent who calls out to alert the driver of a truck moving towards a group of five men, causing the driver to swerve away. This prevents the truck from killing the five men, but the truck then runs over and kills one man. In the means effect stories, the non-contact version has a agent call out to a man across the road to come to him, causing the truck to kill him, but then not kill the five men down the road. In the contact version, the agent achieves the same
effect by instead pushing the one man into the path of the truck. Finally, an omission formulation of the non-contact means effect story has the agent choose to not call out to the man across the road, whereupon the truck continues on its path to hit and kill the five men.
Figure 2-2: Variants of the trolley problem
2.2
Cross-Cultural Comparisons
A few empirical studies have been conducted by deploying the trolley problem across multiple cultural groups to examine the differences among them in ethical preferences. One [3] surveyed switch, footbridge, and loop trolley problem variants among men and women in two broad age categories across the UK, USA, Canada, and Russia. This study discovered cross-cultural preference against harm by commission (that is, against harm caused by taking action, as opposed to harm by omission, or refraining from acting), against harm by means effect (that is, against harm used as a means to an end, as opposed to that foreseen as a side effect), and against harm by direct physical contact, while noting that male and younger respondents preferred utilitar-ian outcomes more frequently than their female and older counterparts (utilitarutilitar-ian outcomes being the ones that minimized overall harm). They also discovered an inter-cultural difference between the responses of Russian men and those of the other countries’ men, in that the former tended to be less utilitarian than did the latter – but only in the male demographic column.
Another [2] discovered differences in switch trolley problem responses among three surveyed population groups, with the Chinese respondents less likely to choose utili-tarian outcomes compared to American and Russian respondents.
A particularly out-of-the-way study [1] conducted among a small-scale, agrarian Mayan population discovered a consistency between this population and the global norm in preference for side effect harm over means effect harm, but was not able to find a significant difference in preference for omission over commission.
Finally, a trolley problem survey conducted across 9 cultures – Bali, Costa Rica, France, Guatemala, Japan, Madagascar, Mongolia, Serbia, and the USA – found a consistent cross-cultural preference for utilitarian over non-utilitarian outcomes [11].
Figure 2-3: Countries colored by cultural group (red=western, green=southern, blue=eastern)
2.3
Limitations and Opportunities
Several limitations, however, constrain the utility of the aforementioned studies in un-derstanding cross-cultural similarities and differences in ethical trade-off preferences. While we have trolley problem response data from 12 cultural/national group samples, this leaves out large parts of the world, including many heavily-populated
countries like Brazil, Germany, and India. The studies were also conducted in heavily concentrated areas, thereby limiting the geographic scope even within the countries samples.
Additionally, these studies do not use all variants of trolley problem. Some merely study the double effect, direct contact, and some study plain utilitarianism in side track formulations. As a result, the preferences across cultures as they pertain to whether the relative preferences across variants holds across cultures cannot be con-firmed.
Another confounding factor is the lack of a consistent presentation of the trolley problem across sampling populations. For example, the problem presented to the respondents in [3], the trolley does hit and kill the five workers in the non-utilitarian outcome, but it is the rail switching itself, and not the trolley, that kills the one sacrificial victim worker by crushing him. Even where the variants are functionally identical, they might be described to the experimental subjects with different verbal phrasing and construction. This puts the validity of cross-cultural comparisons of the relative trade-off preference patterns in further doubt.
For these reasons, a reliable picture of trolley problem responses across variants and cultures cannot be produced using existing studies. Composing this would require a study conducted across several closely and distantly related cultures, using the same trolley problem variants, depicted and described in the same way.
Chapter 3
Experiment
This section describes the Moral Machine experiment platform, focusing on the au-tonomous vehicle ethics experiment application for which it was originally designed, and the classic trolley problem section that was added.
3.1
Moral Machine AV
The Moral Machine was originally designed to survey human subjects for prescriptions of autonomous vehicle ethics in scenarios of unavoidable harm. This section describes the application developed for surveying online users on autonomous vehicle ethics.
3.1.1
Scenario Model Generation
Each scenario features characters from the following set: 𝐶 = {Man, Woman, Preg-nant Woman, Baby in Stroller, Elderly Man, Elderly Woman, Boy, Girl, Homeless Person, Large Woman, Large Man, Criminal, Male Executive, Female Executive, Fe-male Athlete, Male Athlete, FeFe-male Doctor, Male Doctor, Dog, Cat }.
The scenarios are generated using randomization under constraints, so that sce-narios explore the following dimensions:
1. Species. This dimension tests the extent to which users are willing to save or sacrifice pets vs. humans. We consider two sets of characters: 1) pets:
𝑆1 = {𝐷𝑜𝑔, 𝐶𝑎𝑡}, and 2) humans: 𝑆2 = 𝐶 ∖ 𝑆1. The number of characters on
each side1 (same number on both sides) 𝑧 is sampled from the set of positive
integers {1, 2, . . . , 5}. Then, 𝑧 pairs of characters are sampled (unordered sam-pling with replacement) from the Cartesian product of the two sets 𝑆1𝑆2 (e.g.
(Dog, Female Doctor)). The first entries of the ordered pairs (i.e. pets) go to one side, while the second entries of the ordered pairs (i.e. humans) go to the other side.
2. Social Value.2 This dimension tests the extent to which users are willing to save/sacrifice characters of higher social value (e.g. a Pregnant Woman, or a Male Executive) when put against characters of lower social value (e.g. a Crim-inal ). We consider three sets of characters, corresponding to three levels: 1) characters of low social value: 𝐿1 = {Homeless Person, Criminal }, 2) characters
of neutral social value: 𝐿2 = {Man, Woman}, and 3) characters of high social
value: 𝐿3 = {Pregnant Woman, Male Executive, Female Executive, Female
Doc-tor, Male Doctor }. In the main article, we restrict the analysis of this dimension to Homeless Person vs Male and Female Executives, for a cleaner focus on social status. The number of characters on each side (same number on both sides) 𝑧 is sampled from the set of positive integers {1, 2, . . . , 5}. Then, 𝑧 pairs of charac-ters are sampled (unordered sampling with replacement) from the following set: (𝐿1𝐿2) ∪ (𝐿1𝐿3) ∪ (𝐿2𝐿3). The first entries of the ordered pairs (i.e. lower-level
characters) go to one side, while the second entries of the ordered pairs (i.e. higher-level characters) go to the other side. For example, (Criminal, Man), (Woman, Male Doctor), and (Homeless Person, Female Executive) are all possible sampled pairs where the first entries are strictly of lower value than the second entries.
1We use the term side to refer to one of the two options that the cars will choose to save/kill. Depending on the relationship to vehicle dimension (mentioned later), the side can refer to inside the car, or on the zebra crossing ahead or on the other lane.
2Note here that “social value” refers to the perceived social value i.e. the widespread perception of the characters. We do not endorse the valuation of any humans above others, and we do not suggest that AVs should discriminate on the basis of any of the classifications presented in Moral Machine.
3. Gender. This dimension tests the extent to which users are willing to save/sacrifice female characters when pitted against male characters. We consider two sets of characters: 1) female characters: 𝐺1 = {Woman, Elderly Woman, Girl, Large
Woman, Female Executive, Female Athlete, Female Doctor }, 2) male characters: 𝐺2 = {𝑚 | 𝑚 = 𝑔(𝑓 ), 𝑓 ∈ 𝐺1}, where 𝑔 is a bijection that maps each female
character to its corresponding male character (e.g. 𝑔(Female Athlete) = Male Athlete). To generate a scenario of this dimension, the number of characters on each side (same number on both sides) 𝑧 is sampled from the set of positive in-tegers less than 6. Then, 𝑧 pairs of characters are sampled (unordered sampling with replacement) from: {(𝑓, 𝑚) | 𝑓 ∈ 𝐺1, 𝑚 = 𝑔(𝑓 )}. The first entries of the
ordered pairs (i.e. female characters) go to one side, while the second entries of the ordered pairs (i.e. male characters) go to the other side.
4. Age. This dimension tests the extent to which users are willing to save/sacrifice characters of younger age when put against characters of older age. We consider three sets of characters, corresponding to three levels: 1) characters of young age: 𝐴1 = {Boy, Girl }, 2) neutral adult characters: 𝐴2 = {Man, Woman}, and
3) elderly characters: 𝐴3 = {Elderly Man, Elderly Woman}.
5. Fitness. This dimension tests the extent to which users are willing to save/sacrifice characters of higher physical fitness when put against characters of lower phys-ical fitness. We consider three sets of characters, corresponding to three levels: 1) characters of low fitness: 𝐹1 = {Large Man, Large Woman}, 2) characters
of neutral fitness: 𝐹2 = {Man, Woman}, and 3) characters of high fitness:
𝐹3 = {Male Athlete, Female Athlete}. Consider the following two
gender-preserving bijections 𝑓1 : 𝐹1 → 𝐹2, and 𝑓2 : 𝐹2 → 𝐹3 (e.g. 𝑓1(Large Man) =
Man, and 𝑓2(Woman) = Female Athlete). To generate a scenario of this
dimen-sion, the number of characters on each side (same number on both sides) 𝑧 is sampled from the set of positive integers less than 6. Then, 𝑧 pairs of characters
are sampled (unordered sampling with replacement) from the following set:
{(𝑙, 𝑛) | 𝑙 ∈ 𝐹1, 𝑛 = 𝑓1(𝑙)}∪
{(𝑛, 𝑓 ) | 𝑛 ∈ 𝐹2, 𝑓 = 𝑓2(𝑛)}∪
{(𝑙, 𝑓 ) | 𝑙 ∈ 𝐹1, 𝑓 = 𝑓2∘ 𝑓1(𝑙)}
The first entries of the ordered pairs (i.e. characters of lower fitness) go to one side, while the second entries of the ordered pairs (i.e. characters of higher fitness) go to the other side.
6. Utilitarianism. This dimension tests the extent to which users are willing to save/sacrifice a group of characters when put against the same group of characters in addition to a positive number of characters (that is, one side Pareto dominates the other side). To generate a scenario of this dimension, the number of characters on each side (same number on both sides) 𝑧 is sampled from the set of positive integers less than 5 (instead of 6). Then, 𝑧 pairs of characters are sampled (unordered sampling with replacement) from the following set: {(𝑐, 𝑐) | 𝑐 ∈ 𝐶}, where 𝐶 is the set of all characters, defined above. This will create two sides with identical groups of characters. Then, the number of additional characters 𝑢 is sampled from the set of positive integers less than 6 − 𝑧. Then, the 𝑢 additional characters are sampled (unordered sampling with replacement) from 𝐶. All the additional characters go to the same side.
Given that the six dimensions above are mutually exclusive in terms of the gener-ated scenarios, the overall number of distinct scenarios of the six dimensions equal to the sum of the numbers above i.e. 𝑁 = 1, 421, 927. (citation to paper appendix) Each user is presented with two randomly sampled scenarios of each of the above dimen-sions, in addition to one completely random scenario (that can have any number of characters on each side and in any combination of characters). These together make the 13 scenarios per session. The order of the 13 scenarios is also counterbalanced over sessions.
In addition to the above six dimensions, the following three dimensions are ran-domly sampled in conjunction with every scenario of the six dimensions above:
1. Interventionism. This dimension tests the extent to which the omission bias (i.e. the favorability of omission/inaction over the commission/action). In every scenario, the car has to make a decision as to stay (omission) or to swerve (commission). To model this dimension, each of the generated scenarios would have one side as the omission, and the other as the commission, or vice versa. This multiplies the number of scenarios by two. To see why, consider a gender-dimension scenario. It can have two possibilities when Interventionism is added: females sacrificed on omission vs. males sacrificed on commission, and vice versa.
2. Relationship to vehicle. This dimension tests the preference to save the passengers over the pedestrians and to what degree it differs from the case of saving some pedestrians over another group of pedestrians. Each scenario presents a tradeoff of either between passengers and pedestrians, or between pedestrians and other groups of pedestrians. A large concrete barrier serves as a visual indicator of the case where the passengers may be sacrificed. Pedestrians are rendered over a zebra crossing, which is split by an island in case of a pedestrian vs pedestrian scenario. Pedestrians can be crossing either ahead of the car (for the case of passengers vs. pedestrians), on the other lane (also for the case of passengers vs. pedestrians), or on both lanes (for the case of pedestrians vs. pedestrians). To model this dimension, each of the generated scenarios would have both sides on zebra crossings; one side inside the car, and the other on the zebra crossing; or vice versa. This multiplies the number of scenarios by three. To see why, consider again the gender-dimension scenario. It can have in conjunction with this dimension the following possibilities: female passengers vs. male pedestrians, female pedestrians vs. male passengers, and female pedestrians vs. male pedestrians.
complica-tions in the form of pedestrian crossing signals. Scenarios can have no crossing signals (no legal complications), crossing signals on either side of the crossing, that all have the same light color, red or green (for the case passengers vs. pedestrians), or crossing signals on either side of each lane’s crossing, if split by an island, where the light color of one side is different from the light color of the other side e.g. green vs. red (for the case of pedestrians vs. pedestrians). In the last case, the crossing signal on the main lane can be green (i.e. legal crossing), in which case, the crossing signal on the other lane is red (illegal crossing), or vice versa. In the case of matching green/red light crossing sig-nals, the two signals are either both green (legal) or red (illegal). To model this dimension, each of the generated scenarios would have no legal complication, one side as legal, or the same side as illegal (the other side will be a function of this side). This multiplies the number of scenarios by three. To see why, consider again the gender-dimension scenario. It can have in conjunction with this dimension the following possibilities: female pedestrians with no legal con-siderations, female pedestrians crossing legally, and female pedestrians crossing illegally. The other side would always feature male pedestrians/passengers with their legal considerations determined as a function of the legal considerations of the female pedestrians.
The above three extra dimensions can be factored independently from each other. Hence, they all together multiply the number of distinct scenarios by 18. Thus, the overall number of distinct scenarios of the nine dimensions (i.e. excluding the completely random scenarios) is 𝑀 = 18 × 𝑁 = 25, 594, 686 (or approximately 26𝑀 ). (citation to paper appendix)
The stay/swerve outcomes are rendered on the fly by overlaying vector graphic stylized icons of the characters and dynamic objects on a static image background depicting the respective outcome course, and the left/right position of each outcome is switched randomly, so as to avoid any bias from handedness. A short delay featuring an animated visual distraction is forced between choice commitment and the rendering of the next scenario, so as to allow the user to mentally clear and shift.
The damage level to each character is depicted using either a skull icon (death), an equal-armed cross icon (injury), or a question mark icon (unknown). For simplicity, scenarios generated in the Judge interface have the possibility of death only. The other two levels (injury and unknown) are only used in the Design interface.
Apart from the instructions available on the main page, a brief description of each outcome may also be viewed by clicking a button below the depiction of each outcome, describing the circumstances of the vehicle (autopilot with sudden brake failure), its course in that outcome, and any pedestrian crossing signal(s) involved, as well as a list of the impacted characters and the damage to them that will result in that outcome.
After the user has completed assessing all 13 scenarios, they are presented with a summary of their decisions, a sample of which can be seen in Fig. 3-4.
Whether the option to do the survey appeared before or after the user saw their Results page was counterbalanced between users. In addition, the survey questions were presented in four blocks. Each block contains one group of questions: (a) the stated preference sliders, (b) the demographic questions (age, gender, income, and education), (c) the political and religious view questions, and (d) the “attitude towards machine intelligence” questions. The order of the blocks and the order of questions within each block was also counterbalanced between users.
Each set of 13 scenarios consist of 6 pairs testing along each of the six primary dimensions, and one completely randomized scenario. The scenarios are then re-ordered randomly to be fed into the sequence presented to the respondent.
3.1.2
Scenario Element Design
The aesthetic was designed to abstract the scenarios into consistent visual components that could be visually comprehended with ease. the simple vector figures with as few shades, segments, visual markers as necessary to indicate the characteristics. I had to resort to some stereotypes in some cases (e.g. walking stick for elderly man, skirt for woman and girl, etc).
in-cluded shades of: - grey: for static background elements like the road and guardrails - blue: for dynamic, but morally inconsequential elements like the car and the lane barrier - red: for morally consequential elements like humans and animals
The pedestrian crossing signal symbols were colored to convention – red for “do not cross” and green for “okay to cross”.
The viewer perspective was designed to look up the road, centered, from overhead slightly ahead of the crossing, to emphasize that the respondent is an observer and is not in control of the vehicle. This perspective is evident in the shape of the road and the car, as well as the relative sizes of the characters at the crossing compared to the characters in the vehicle.
The characters at the pedestrian crossing are rendered using their side profile sprites, although the pedestrian crossing signal faces down the road, so as to be visible to the respondent. Any characters in the vehicle are rendered in the AV’s seats, using the sprite that depicts them upwards from the mid-section.
The AV always starts in right-side lane, can only swerve to left-side lane. The different layouts are depicted with the use and lane placement of the barrier.
Two sets of indicators are varied between outcome panels, to distinguish the de-piction of decisions and consequences in each; they are otherwise identical.
The first is a thick yellow arrow line, running down-road from the AV to the side of the crossing at which the AV ends up, indicating the course the AV will take in each outcome. In the case of omission outcome, the arrow runs down the length of the right lane, just before the crossing. In the case of commission, the arrow curves from the left lane into the right lane, just before the crossing.
The other is the fate indicators, which appear above the characters in their re-spective positions. If the outcome results in death for a character, a skull icon will be placed above them. In the case of injury, the icon will be that of a medical cross. In the case where the outcome for the character is not certain, the icon is of a question mark.
Figure 3-1: Example of a “passengers vs pedestrians” AV dilemma scenario, where passengers are killed in both the omission outcome and the commission outcome. This example also features crossing signals on both lanes.
3.1.3
Interaction
Respondent interaction with the user interface varies considerably between desktop and mobile modes.
In the desktop mode, the two outcome panels are depicted side by side for each scenario. The respondent selects a preferred outcome by clicking it; hovering the mouse cursor over a panel highlights the panel with a palette red glow effect. Alter-natively, if the respondent is using desktop mode with a touchscreen, they can use the touch interface to select their preferred outcome. A button under each outcome panel toggles between display and concealment of the description text for the outcome depicted in that panel, positioned in the designated empty space to the left of the left-side panel, and to the right of the right-side panel.
In mobile mode, only one outcome panel is displayed at a time. The screen layout has a panel space for the displayed outcome, and a button panel below it.
Figure 3-2: Example of a “passengers vs pedestrians” AV dilemma scenario, where passengers are killed in the omission outcome, and pedestrians are killed in the com-mission outcome. This example also features a crossing signal setup spanning the road.
A placeholder panel with no dynamic features is displayed to begin with, and the respondent clicks the omission or commission button in the button panel to toggle the displayed outcome panel between omission and commission. Another button may be clicked to lock the outcome being displayed as the respondent’s preferred choice, then moving the interface to the next scenario, or to the results screen. A button with a question mark icon, also in the button panel, toggles display or concealment of an overlay containing the description text for the scenario then being displayed.
As the user moves from scenario to scenario in the 13-scenario survey, by clicking or locking in their preferred outcomes for each, a transition screen appears between the display of each scenario. This screen shows animated rotating gear icons for about two seconds before the next scenario screen is displayed, to allow the respondent to mentally reset, and recognize the change in scenario. After the respondent makes their choice in the last scenario, the control moves to the result screen.
Figure 3-3: Example of a “pedestrians vs passengers” AV dilemma scenario, where pedestrians are killed in the omission outcome, and passengers are killed in the com-mission outcome. This example features no crossing signal.
At any point, the user can can click out to another screen using the menu in the Judge screens. If they attempt to do so, they will be notified in a dialog that their session will be interrupted if they confirm their selection. Assenting on the dialog will reset the session and switch control to the screen that the user selected.
3.1.4
Results
Figure 3-4: Results screen indicators of most frequently saved and sacrificed characters
Figure 3-5: Results screen indicators of propensity to save more lives, to save lives of passengers over those of pedestrians, and to prefer legal crossings where crossing signals are factored in
are counted and the ones that number the most and the least are displayed to the respondent.
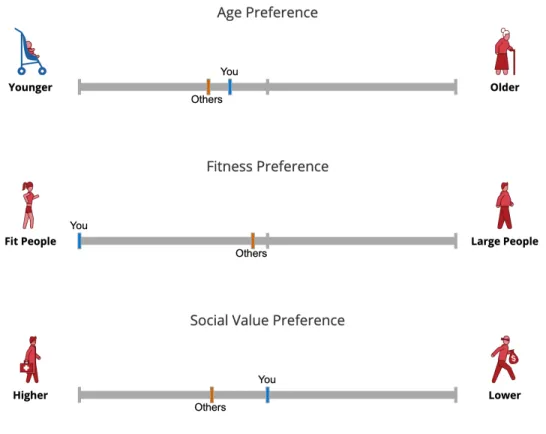
Below those, each of the three layout variables and the six character variables are depicted as slider scales, with each extreme on either end. The average decision across each of those dimensions for the respondent in the session is computed, and indicated along the corresponding scale using a blue pip.
An orange pip indicating the global (across all respondents) average decision along each dimension is also indicated along each scale. This feature allows to user to see how they compare with others, and adds encouragement to share the results, so that others in their social network can use the shared permalink to view the sharing user’s results.
A shortcut to start a new sequence of scenarios is placed at the top and bottom of the page, allowing the user to start assessing a new sequence of scenarios in a fresh session.
Figure 3-6: Results screen indicators for propensity to default to inaction, save lives of female characters over male ones, and save the lives of the non-human animal characters over the human ones
As experiment ethics would oblige, an opt-out section is placed at the bottom of the page, notifying the user that they were part of an experiment, telling them why this had to be concealed from them until the results page, describing the purpose and scope of the experiment, and offering the user a link to remove their responses from the application’s database.
3.1.5
Demographic/Opinion Survey
Four months after the initial deployment, an extension of the user result interface was added to collect demographic information, and feedback on the user’s perception of their own moral priorities along each dimension. This survey helps us understand the type of users visiting our website, and to assess the effects of demographic char-acteristics, political views or religious beliefs on moral preferences [9].
Figure 3-7: Results screen indicators for propensity to save lives based on age, ap-parent physical fitness, and apap-parent social value
The survey contains demographic questions about age, gender, income, education, religious views, and political views. Further, it asks users to provide their stated preferences over the nine dimensions using sliders. Additionally, the survey contains four questions that concern the attitude towards machine intelligence. However, we do not use respondents’ answers to these questions here or in the main manuscript.
All question sets are randomized in order, and so are the questions within each set. Additionally, whether the offer to answer the survey appears before or after the results are displayed is also randomized. In the former case, declining to answer the survey will simply skip to the main result screen. In the latter case, the offer will appear at the bottom of the result screen, after the results.
Figure 3-8: The share prompts on the result screen of the Moral Machine Judge mode. The prompts vary depending on the language selected
3.1.6
Create/Browse
In addition to the Judge section, the website serves as a platform for the design, publication, and viewing of scenarios by users of the site.
The Create interface, accessible by clicking “Design” in the menu bar operates like a step-by-step customization menu. The user is presented with the three possible layouts. Selecting a layout slides the layout menu away to reveal the three pedestrian crossing signal configurations possible for the selected layout. After a selection is made here, the signal configuration menu slides away to reveal a panel of characters under
Figure 3-9: An example of a survey slider question. This is repeated for each of the 3 layout and 6 character dimensions. The default is set to the result session average for that dimension. The respondent can move the slider to the position they see as best depicting their trade-off prescription.
Figure 3-10: A free-text prompt for the respondent to describe rules outside the trade-off weights described by the slider positions.
Figure 3-11: Questions related to the respondents’ views about autonomous machines and vehicles
each outcome, and a dropdown menu for selection among three possible character fates – death (as a default), injury, and unknown – represented by their corresponding icons. The user selects from the panels up to five characters to meet the currently
Figure 3-12: Questions about the respondent’s demographics
selected fate in the adjacent outcomes. As the user makes selections in this menu setup, the scenario visualization is updated. The user may enter a title in the text box and publish the scenario to the gallery by clicking “Submit Scenario” (a check mark in mobile) , or press “Start Over” (a cross mark in mobile) to reset the scenario to before the first step.
The gallery accessible by clicking “Browse” in the menu bar can be navigated by clicking the chevron buttons to the left (chronologically backward) and right (chrono-logically forward), as well as clicking the “Random” button to skip to a random scenario in the gallery. Apart from the standard set of social sharing and permalink shortcuts, a “Like” button (with a “thumbs up” symbol) is also present to allow the user to mark each scenario they like, and view the number of such “Likes“ that have been accumulated for that scenario. A third-party discussion thread for each pub-lished scenario is embedded under the scenario, allowing users to discuss and debate each scenario.
Figure 3-13: AV dilemma scenario design tool for use by visitors.
3.1.7
Social Sharing
A social sharing widget set into the Results interface, the Browse interface, and the About page. The input for the widget is the permalink of what is being shared. The permalink is offered in a read-only text box, for the user to directly copy into their clipboard. A panel of shortcuts for the most popular social networks allows the user to share the permalink to Facebook, Twitter, Google+, LinkedIn, Reddit, Digg, and StumbleUpon.
The sharing template fed into each network’s sharing page supplements the perma-link with a call-to-action text and hashtags; this is done to reduce the effort in the sharing, and to increase the chances of the link being clicked. The hashtags help the content trend where applicable, and help us estimate its popularity at any time. This text is generated differently for each page being shared, and depending on the social network platform to which the user is sharing the content. The text is translated into the language then in use, and the language setting in some cases also generates additional language-specific social network sharing shortcuts in the page (e.g. Weibo when using Chinese, VK when using Russian, etc).
3.1.8
Other Features
We included a feedback input box overlay that is displayed when the user clicks the “Feedback” link in the menu bar. Visitors can use this feature to send us their thoughts on the platform and the experiment, or to report any problems with the site. Clicking the “About” link in the menu bar navigates to a page that describes the purpose of the experiment, and lists credits, media, scientific writings, and acknowledgements. This page also contains a multi-platform share widget for the site as a whole.
3.1.9
Data Gathering
Users and scenario survey sessions are assigned unique identification character se-quences. The user identifier is stored on client-side storage as well, so as to identify which users are returning.
For each scenario response, a set of data is logged including the following fields: The choice of response is logged, together with the scenario object (containing all information about the scenario), and the left/right randomized side presentation switch flag.
The amount of time the user takes to select a response from the time a scenario is presented to them is logged, along with information about the browser, and whether the user is interacting in mobile or desktop mode.
The unique session identifier is recorded to identify scenarios in the same session, the client IP address is recorded to aid in approximate geolocation, and the unique user identifier is recorded in order to identify returning users.
Finally, the order in which the scenario appears is stored, along with the session-level ordering of scenarios.
If the user opts out of data collection on the result screen, the responses are erased from the database.
3.1.10
Communication
This section describes the important design decisions in communicating with users, in-cluding text prompts, language internationalization, and user instructions/assistance.
Prompt
The central prompt on the landing page is the question “What should the self-driving car do?”.
Internationalization
The Moral Machine interfaces are fully internationalized with 10 language options: Arabic, German, English, Spanish, French, Japanese, Korean, Portuguese, Russian, and Chinese. These were chosen based on how widely they were used among online populations. Having the Portuguese option, for example, would permit access to Portuguese and Brazilian users in their preferred language.
The user-selected language of the site, which is English by default, is displayed in a control, as an abbreviation of the language’s native-script name next to a world globe icon, at the end of the menu bar. Activating this control displays a dialog containing controls labeled with native-script names of languages to which the controls can be used to switch.
When a user visits the Moral Machine for the first time, the language selection dialog is open by default, so that they do not have to look around for the language selector. Language selection is also reflected in the site URL as a parameter, so that links shared from the site can be shared in the user’s (and presumably, their audience’s) preferred language.
In the case of the one Right-To-Left language option offered – namely, Arabic – the orientation of the menu bar and text segments are toggled accordingly.
In order to ensure accuracy of the translations, back-translation was employed. That is, each original English text was translated to the target language by one translator, and another translator was walked through a test version of the site with the translated text, and their interpretations of the text were checked for possible miscommunications.
Instructions and Assistance
The site’s landing page features a brief overview of the site, and a control to display an overlay full-window dialog with more detailed instructions is included among those presented on the page. The instructions describe a walk-through and the actions possible in each interface. For the Judge interface, it also describes the perspective from which the scenario is to be viewed by the user, and the visual/textual assistance offered.
In the Judge interface, the description for each scenario is pieced together from text segments which are reorganized, and between which dynamic elements are inter-spersed, depending on the scenario parameters. To ease generation, comprehension, and internationalization, the part of the description that describes casualties is struc-tured as a set of bullet-point lists for each casualty type, with each character type
listed against the number of corresponding casualties for that character type.
3.2
Moral Machine Classic
This section describes and justifies the design of the manual-action moral dilemma part of the experiment. This was labeled “Classic”, as it is based on the original trolley problem thought experiments.
3.2.1
Scenario Model Choices
As described in the review, an exploration of moral psychology across cultures would be incomplete without taking into account double effect and proximal action as possi-ble decision-making factors. Therefore, three scenarios were decided upon for trolley problem experiments on the application: the Switch, the Footbridge, and the Loop.
Other parameters are static. Instead of varying numbers of characters impacted by the decisions, the scenarios all pose a “1 vs 5 dilemma”, so as to most closely match, and therefore produce results that can be compared with, those of earlier experiments. The only character types are mutually-indistinguishable workers on the tracks, the one moral agent character, and the one large character on the footbridge in the Footbridge scenarios.
3.2.2
Scenario Element Design
Since they all have static parameters, the Classic trolley problem scenarios are not rendered on demand. They are instead pre-rendered as three pairs of images, with one pair depicting the two outcomes for each scenario.
Tracks are depicted as straight rails without visible support bars, running down recessed lanes. In the Footbridge scenario, a solid footbridge spans the track and the platform on either side, with an arched column on either side of the tracks. The track redirect control in the Switch and Loop scenarios is depicted as a large, simple, vertical shaft lever mounted on a rounded spanning base connected to the rail segment
(a) Switch scenario (b) Footbridge scenario
(c) Loop scenario
Figure 3-15: Variants of the classic trolley problem to be presented to respondents
just before the fork.
To represent omission in Switch and Loop scenarios, the lever is in a vertical position, with the agent standing at ease nearby. To represent commission, the lever is tilted towards the agent, who has a hand on its top end.
In the Footbridge scenario, omission has the large person still on the footbridge, with the moral agent still behind him. In case of commission, the moral agent is on the footbridge with arms extended, and the large person is laying across the tracks below.
The moral agent bears the same appearance as the adult male in the AV scenarios, depicted in front profile in the Footbridge scenario, and in side profile otherwise. The workers on the tracks and the large person on the footbridge are depicted as adult males with hardhats, belt, and work boots. The workers are leaning over their section of the tracks, in side profile, while the large person is in front of the agent, also in
front profile, facing the same direction, on the footbridge right above the tracks. Otherwise, much of the design remains the same as in the AV scenarios. The user perspective remains centered down-track, looking up the tracks at the approaching trolley. In the Switch and Loop scenarios, the track is changed in the same direction i.e. user-right.
The color scheme also remains the same. Static background elements like the tracks, footbridge, and platform are colored grey. Characters impacted by the moral choice, like the workers on the track, and the large person on the footbridge, are colored shades of red. Dynamic, but morally inconsequential elements, like the trolley, switch, and moral agent, are shaded blue.
Yellow semi-transparent arrows indicate the path of the trolley in each outcome, up to the point where it kills either the one or the five. Deaths are indicated using the same skull icons above the killed characters, as in the AV scenarios. In order to further visually distinguish the Classic and AV experiments for the user, a mottled sepia-tone filter was applied to the images of the Classic trolley problem scenarios.
Figure 3-17: The presentation of the Footbridge scenario
3.2.3
Interaction
The prompt in the Classic scenarios ask "What should the man in blue do?". And instead of controls to toggle display of the description for each outcome, a single block of text describing the scenario is rendered under the scenario block.
Controls are otherwise similar to the controls in the AV version. In the desktop view, the user clicks the outcome they perceive to be ideal. In the mobile view, the user uses buttons to toggle between the two outcomes, and locks in a selection of the one they choose.
The three scenarios are presented in random order, and there are no results dis-played after the three have been assessed by the user. Instead, the user is presented with a block of social share links for the Classic trolley problem survey, an optional demographic survey with randomly ordered questions like the one offered after the AV moral dilemma sequence (minus the questions about technology and autonomous vehicles). And as with the AV version, the user is presented with a note about the experiment, and a link to opt out of having their choices stored for analysis. The transition delay and animation, and the dialog to warn the user about interrupting the sequence to move to a different page in the application, remain in the Classic
Figure 3-18: The presentation of the Loop scenario
version.
Figure 3-19: The post-sequence demographic survey
Data collection in the Classic trolley problem survey logs the same data points as in the AV dilemma survey, including choice, timing, sequence and ordering, but the scenario definition is a simple code code indicating which of the three Classic trolley problem scenarios were displayed. The Classic survey sequence is also back-translated into and presented in the same languages as the AV dilemma version.
3.3
Experiment Ethics
The Internal Review Board approval was sought for the experiment once design was finalized for the first deployment, and then for each successive major changes like internationalization and the addition of the Classic version. All researchers involved in the project completed the ethical experimentation knowledge certification course mandated by IRB protocols.
At the ends of both AV and Classic ethical dilemma surveys, the experimental purpose and goals of the application were revealed to the user, along with the reason for concealing it until after the surveys had been completed. If the user used the opt-out link that was then presented to them, all their survey responses were deleted from the response dataset, with only a non-identifiable record of the fact of the deletion stored in order to keep track of which users opted out and when.
In order to protect user privacy, no identifying information was solicited from the users. The IP addresses of the users are not included in any public datasets from the project.
3.4
Architecture
The Moral Machine was developed on the Meteor JS framework. This was chosen because of its reactive, isomorphic features, integration with deployment platforms and services, extensive function libraries, and its having been built on the powerful Node JS.
The experiment was originally deployed on its own Linux servers, until the ex-periment started getting far more traffic than originally anticipated, and needed to drastically scale up. To this end, the system was migrated to the Galaxy deployment platform, with the databases served by the mLab platform. This permitted scaling up and down through non-disruptively controlling the numbers and capacities of virtual Meteor app servers, depending on the volume of incoming traffic, as well as other traffic handling, rolling deployment, backup, and security features.
In order to ensure a consistent appearance of scenarios across views in the experi-ment, a standard HTML5 SVG widget was developed to render scenarios specifically. Each scenario was defined by a standard object modeling all the elements therein, their positions, and their markers, if any. The model object would be produced by the scenario generator in Judge view, or by the Create designer wizard, and saved in the database along with the respondent’s choices in the Judge sequence, or as a scenario creator’s design in the Create tool, to be later retrieved and rendered in the Browse gallery. The rendering widget used a single sheet designed by our vector graphics artist to grab sprites, and scale and position them based on the data in the scenario model object, and based on the scale, position, and outcome specified in the call parameters. The visualization library d3 JS was used to dynamically render the sliders in the Results page.
When the popularity of the experiment reached a point where internationalization and localization (i18n) became necessary, the tap-i18n library was integrated into the architecture, and language codes were integrated into the URL scheme and its parser, using the common "/hl/" scheme. This scheme would be used to modify the URL so that the language selected by the site user (or by the user who shared the URL) was always part of the URL. The URL parser was also set up to direct the controller to the Results page if a shared Results page URL was received, accounting for the language it was viewed in at the time it was shared.
The Classic trolley problem scenario sequence and Results was presented using a trimmed-down version of the Judge sequence and Results pages. Static images of scenario outcomes were rendered in advance by our graphics artist, and displayed and logged using static scenario codes. There being no results to display, the user would, upon finishing the short sequence, be directed immediately to the exit survey. The only change in the controller was the addition of a pattern "/classic/" to direct control from URLs specifying shares of the Classic trolley problem page.
Chapter 4
Results
The Moral Machine AV experiment enabled us to collect 40 million ethical dilemma responses, surveyed in ten languages, from millions of respondents across 233 countries and territories. As these responses were surveyed for multidimensional combinations of several morally significant factors (described in Section 3.1.1), we were able to parse out broad patterns of preferences of dilemma outcomes across the global population with regard to each factor, as well as to observe differences in preferences among the cultural clusters noted in Fig. 2-3 [4]. These findings suggested that global patterns and regional variations might also be discovered when it came to the classic trolley problem.
This chapter describes the data and results from the classic trolley problem ex-periment deployed on the Moral Machine website, exploring the dataset, examining responses by trolley problem variant, and examining the global and regional patterns in outcome preference across geography.
4.1
Dataset
The trolley problem dataset is drawn from records of user responses on the classic trolley problem experiment on the Moral Machine website. The data analyzed for the classic trolley problem experiment spans responses collected between June 2017 (when the Classic interface was launched) and March 2019 i.e. 20 months.
During this period, data was collected from all over the world, but concentrated more heavily in the Americas, Europe, and East Asia, as can be seen in Fig. 4-1. The demographics of the dataset skew more male and young, but are more balanced along other dimensions, as seen in Fig. 4-2.
As can be seen in Fig. 4-3, respondents took more time to respond to the first scenario with which they were presented; however, this was mitigated by the random-ization of scenarios.
The data analysis is limited to a selection of responses of 70,000 participants, collected in 10 languages and 42 countries, with a lower-bound of 200 responses per scenario and country.
For the analysis, the records containing responses for all three scenarios were isolated.
Figure 4-1: Scatter map of geolocated responses. Each dot is a response.
4.2
Results by Variant
Analysis of the respondents’ choices by variant reveals that sacrificial outcomes, on average, are preferred most in the Switch scenario, then in the Loop scenario, and least in the Footbridge scenario, as seen in Fig. 4-4
Figure 4-2: Demographic overview of responses for the classic trolley problem This is reflected in Fig. 4-5, showing respondents took the most time to ponder the Footbridge scenario, followed by the Loop scenario, and then the Switch scenario. This pattern could indicate greater moral hesitation.
Analysis of the respondents’ choices by scenario order (Fig. 4-6) reveals that, on average, sacrificial outcomes were preferred slightly more in the first scenario in the sequence, compared to the other two, validating the design decision to randomize the ordering of the three variants to be displayed to the respondents.
4.3
Geographic
The responses were split by country, and then by variant, to examine if and how ordering of sacrificial outcome preference by variant might vary based on geography, as seen in Fig. 4-7. These were ordered by average preference of sacrificial outcome in the Switch variant, for display.
The observation is of sacrificial outcomes being most preferred in the Switch vari-ant, then in Loop, and then in Footbridge. This provides confirmation that the or-dering of preference hypothesized from the pattern observed in various studies holds across human cultures, even as the preferences themselves vary geographically.
Figure 4-3: Time taken to respond to each scenario by scenario order
Figure 4-5: Time taken to respond to each scenario by scenario type
Figure 4-7: Frequency of sacrificing responses by country and variant, ordered by fre-quency in switch variant, connected across countries within each variant to highlight consistency of pattern across countries
Chapter 5
Analysis
This section covers caveats about known and speculated limitations of the experiment, discussion of the implications of the platform, and the suggestions for future research extending from or facilitated by this project.
5.1
Limitations
Although the sample is large, its collection relied on voluntary participation in a viral online experiment. As expected thereby, the sample suffers some measure of self-selection. The self-selection would be expected along dimensions of demography, but would also be expected to vary based on internet access, online time, fluency in at least one among the 10 available i18n languages, and encountering the site having sought out or been directed to the AV experiment. As described in the demographic analysis, the sample is skewed in terms of age, gender, and education, towards being disproportionately composed of young, college educated men.
Possible misunderstandings of scenarios caused by limits in communication clarity, and necessity of brevity in instructions and descriptions for a platform intended to spread organically and virally, could also influence study outcomes.
The sample therefore does not optimally reflect the diversity of population in the countries from which data was collected. All the same, it is unprecedented in its scope, as no research group has previously attempted to collect data on moral preferences
from nationally representative samples in 42 countries.
With this caveat, the data provides the best existing evidence that people uni-versally endorse sacrifice in Switch more than in Loop, and in Loop more than in Footbridge. Given this universal result, it seems appropriate to explain the quali-tative Switch-Loop-Footbridge pattern in terms of basic cognitive processes, rather than to seek explanations based on cultural norms.
Concern may also be raised that merely collecting judgements in such sacrificial dilemmas does not account for dissociated moral psychological dimensions of viewing harm as a justifiable tool for a greater good ("instrumental harm"), versus impartially maximizing welfare for sentient beings ("impartial beneficence"). Since these have been shown to not form a unitary psychological phenomenon, caveat must be issued against drawing conclusions about one or the other from just this study. [10]
5.2
Implications
Most people would agree that killing is wrong—but perhaps not in all circumstances. Homicide is such a grave act, that it is of considerable psychological interest to un-derstand the contexts in which people may tolerate the killing of another human.
For at least two decades now, moral psychologists have been collecting data on one such context: when do people find it acceptable to sacrifice one life to save many? These data suggested a complex pattern of universals and variations in the way different cultures tackle this question.
On the one hand, data suggested that people from different cultures displayed a remarkable qualitative regularity, the Switch-Loop-Footbridge ordered pattern of preferences. On the other hand, data also suggested that people from different cul-tures displayed quantitative variations in the exact degree to which they endorsed sacrifice in each of these scenarios—mostly such that people from Eastern countries showed less acceptance than people from Western countries.
One limitation of these findings is that they were often based on small samples from a small number of countries outside of the Western world. Thanks to the popularity
of the Moral Machine website, we were able to collect data at a much greater scale, and confirm the pattern of preference for broadly utilitarian outcomes, adjusted for double effect and direct contact, across the world.
Understanding of moral psychology through ethical dilemmas this way could have implications for applied psychology, including in the military, risk assessment, etc. More to the significance of the large-scale studies across regions and cultures, both the consistency of the ordering of distal interaction, double effect, and proximal in-teraction scenarios, through all countries, and their baseline variations from country to country, could impact how applied psychology implemented in the real world can be more finely tuned for a region’s specific moral psychological profile.
The experience with this experiment can help address limitations of offline exper-iments, micropayment-incentivized online crowdsourcing task platforms, and limited subject pool survey platforms, by serving as a prototype for crowdsourcing data on values and experimental psychology at scale, through mostly organic growth and reach.
5.3
Future Work
Possible future work could start with addressing the paucity of data from many regions in the world. Broader population samples could be collected from the countries that did not make the cutoff response rate, perhaps by inorganically jump-starting promotion of the site in those countries.
Additionally, offline experiments using the same scenarios could be conducted in some countries, especially ones covered in studies mentioned in the literature review, to compare and contrast with the online experiment results.
Other unavoidable harm dilemmas, such as those described in the literature re-view, could also be added to the range of scenarios. The architecture is easy to extend for any number of scenarios, so scenarios (including ones not involving a trolley) such as the classic organ transplant scenario, or variants thereof, could be platformed thus.