Publisher’s version / Version de l'éditeur:
Vous avez des questions? Nous pouvons vous aider. Pour communiquer directement avec un auteur, consultez la première page de la revue dans laquelle son article a été publié afin de trouver ses coordonnées. Si vous n’arrivez pas à les repérer, communiquez avec nous à [email protected].
Questions? Contact the NRC Publications Archive team at
[email protected]. If you wish to email the authors directly, please see the first page of the publication for their contact information.
https://publications-cnrc.canada.ca/fra/droits
L’accès à ce site Web et l’utilisation de son contenu sont assujettis aux conditions présentées dans le site LISEZ CES CONDITIONS ATTENTIVEMENT AVANT D’UTILISER CE SITE WEB.
Paper (National Research Council of Canada. Institute for Research in
Construction), 1986
READ THESE TERMS AND CONDITIONS CAREFULLY BEFORE USING THIS WEBSITE. https://nrc-publications.canada.ca/eng/copyright
NRC Publications Archive Record / Notice des Archives des publications du CNRC :
https://nrc-publications.canada.ca/eng/view/object/?id=68f2e69c-b4ab-479d-ab55-ba802d52d480 https://publications-cnrc.canada.ca/fra/voir/objet/?id=68f2e69c-b4ab-479d-ab55-ba802d52d480
NRC Publications Archive
Archives des publications du CNRC
This publication could be one of several versions: author’s original, accepted manuscript or the publisher’s version. / La version de cette publication peut être l’une des suivantes : la version prépublication de l’auteur, la version acceptée du manuscrit ou la version de l’éditeur.
For the publisher’s version, please access the DOI link below./ Pour consulter la version de l’éditeur, utilisez le lien DOI ci-dessous.
https://doi.org/10.4224/40001384
Access and use of this website and the material on it are subject to the Terms and Conditions set forth at
Numerical analysis of fire gas toxicity: mathematical predictions and
experimental results
Sor I
TH1
NaUonal Research C o d 1 nationel
1
N21d
Council Canada denchrshawnd.no.
1399
c . 2 Institute for lnstitut de
BLDG
I Research in recherche en/'
Construction.
constructionNumerical Analysis
of
Flre
Gas
Toxicity:
Mathematical Predictions
and
Expetimental
Results
ANALYZED
Reprinted from
Journal of Fire Sciences Vol. 4, No. 2, March/April 1986
p. 126-134
(IRC Paper No. 1399)
by Y. Tsuchiya and I. Nakaya
Price $2.00 NRCC 26339
On a e l a b o r e d e s e q u a t i o n s p e r m e t t a n t de p r k o i r l e temps n e c e s s a i r e B l ' a p p a r i t i o n d'un e f f e t t o x i q u e chez un organisme v i v a n t expose 3 une atmosphere renfermant un gaz t o x i q u e ou un melange de gaz t o x i q u e s . Les v a l e u r s d e s c o n s t a n t e s c o n t e n u e s d a n s l e s C q u a t i o n s du CO e t du HCN o n t S t 6 c a l c u l 6 e s 3 p a r t i r de donnses c o n c e r n a n t d e s e x p e r i e n c e s s u r animaux, t i r b s d e l a l i t t g r a t u r e . Les temps p r s v u s o n t S t 6 comparCs B ceux r e l e v e s l o r s d l e x p C r i e n c e s 03 l a c o n c e n t r a t i o n d e gaz t o x i q u e s v a r i a i t s e l o n l e temps.
Numerical Analysis
of
Fire
Gas Toxicity: Mathematical
Predictions and
Experimental
Results
Y o s ~ z o
TSUCHZYA
ANDICHZRO
NAKAYA
Fire Research Section
National Research Council, Canada Institute for Research in Construction Ottawa, Canada
KIA OR6
(Received December 4, 1985) (Revised April 8, 1986)
ABSTRACT
Equations were developed to predict the time required before a toxic effect is observed in a living body exposed to air containing a toxic gas or a mixture of toxic gases. Values for the constants in the equations for CO and HCN were calculated from data on animal experiments found in literature. The predicted times were compared with times from experiments where thesoncentration of toxic gases was varied with time.
Keywords: Lethality, incapacitation, effective exposure time, effective concen- tration.
INTRODUCTION
THE AUTHORS RECENTLY PRESENTED EQUATIONS FOR INCAPACITATION
times resulting from exposure of a living body to an atmosphere con- taining a toxic gas or a mixture of toxic gases
[ll.
The equations take into account the effect of each component (main effect) and of two- and three-component interactions, and may be used to quantitatively evaluate the relative importance of the main effects and interactions. Interactions between more than three components are consideredNumerical Analysis of Fire Gas Toxiciw 127 negligible. Constants in the equations specific to each toxic gas compo- nent were calculated using data from experiments in the literature 121 in which mice were exposed to six toxic gases singly or in two- or three- component mixtures, and incapacitation times were measured.
Additional experimental data suitable for use in these calculations have been obtained from the literature. In these experiments the con- centrations of toxic gases were fixed. Because the concentrations in ac- tual fires are always changing, it is desirable to examine the authors' method when applied to toxic gases of varying concentration. Recently Hartzell et a1 exposed rats to varying concentrations of CO and HCN and measured times to incapacitation and death [31. These times have been compared with those predicted by the authors' calculations.
THEORY
A simplified derivation of the equations and the method of
calculating values of constants in the equations have been published ill. The principle of derivation in a more complete form is presented here.
The dose of a n inhaled toxic compound that is taken into the living body may be simply considered as the product of the concentration, C, of the compound in the atmosphere and the exposure time, t. A given
toxicity effect is often assumed to result from a constant dose of the tox- icant. Thus,
where t, is the critical time for an apparent toxicity effect when the tox- icant concentration is C, and "a" is a constant specific for a species of toxic gas and type of toxicity effect. The toxicity effect could be death, incapacitation or some other effect. Experimental data on a narcotic gas such as CO or HCN approximately follow Equation (1 ') except a t very high or low concentrations (for example, experimental data in Reference [41).
The present authors defined the "effective concentration:' C - CO, and the "effective exposure time:' t - P, and modified Equation (1') into
When a living body inhales a toxicant there is a threshold concentra- tion, CO, below which no toxic effect is apparent, and a delay time, to, before any toxicity effect occurs. C0 and to are assumed to be constants specific for each toxic gas and type of toxicity effect, and C0 r 0 and to r 0. Equation (2) is shown as a 45" straight line on a plot of log(C - CO) and log(t - to). The intercept on the vertical axis is -1oga. Equation (2) shows the basic relation between concentration of the toxicant and the time required for a toxicity effect to become apparent. For an exposure time t, where t
<
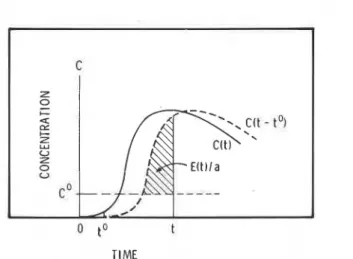
t,, there would be no apparent tox- icity effect, but a living body would still receive a latent toxicity effect, E(t), such thatThe value of E(t), which may be positive or zero, increases with ex- posure time. When 0
<
E(t)<
1 the toxicity effect is latent, and when E(t) 2 1 it is apparent; a t t = t,, E(t) = 1 as in Equation (2).When the toxicant concentration varies with time, C may be written as C(t). Instead of C(t), we consider C(t - to), the toxicant concentra- tion, as a function of the effective time. For a finite short time, At, a n increment of the toxicity effect is
The effective concentration, C(t - to) - CO, is not' negative; when
TIME
Numerical Analysis of Fire Gas ToxiciQ 129
C(t - to)
<
C O , C(t - to) - C 0 is set to zero and AE(t) = 0. Expressing Equation (4) in a differential form and integrating it, one obtains4
The equation is illustrated in Figure 1. The integration on the right- hand side is shown as the shaded area. When E(t) = 1, a specific tox- icity effect, such as incapacitation or death, occurs. If the effect is in- capacitation, the time giving E(t) = 1 is the maximum allowable escape time from a burning building.
For a multiple-component mixture of gases, the following equation was derived. It is analogous to the single-component system, but a t the same time takes into account the effects of individual components and interactions between two or three components [I].
where n is the number of components, and i, j, k are subscripts for dif- ferent toxic components.
VALUES OF CONSTANTS
Sakurai [21 exposed mice to six toxic gases; namely, CO, NH,, NOz, HCl, HCN, and CO,, to one gas alone and to two- or three-component mixtures of them, and measured times for death and for incapacitation. Using the data on incapacitation, constants in Equations ( 5 ) and (6)
were calcualted using the least squares method [I].
Using additional experimental data collected from the literature, dif-
ferent sets of constants were calculated. All data were for single toxic gas component systems. In the calculations, values of constants a, C 0
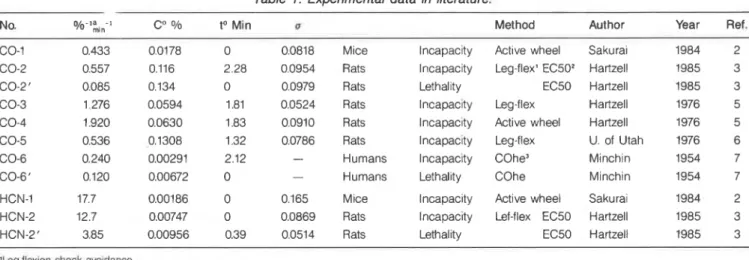
No. % - l a - I
mln
Table 1. Experimental data in literature.
to Min u Method Author Year Ref.
0 0.0818 Mice lncapac~ty Active wheel Sakurai 1984 2 2.28 0.0954 Rats Incapacity Leg-flex' EC502 Hartzell 1985 3 0 0.0979 Rats Lethality EC50 Hartzell 1985 3 1.81 0.0524 Rats Incapacity Leg-flex Hartzell 1976 5 1.83 0.0910 Rats lncapac~ty Active wheel Hartzell 1976 5 1.32 0.0786 Rats Incapacity Leg-flex U. of Utah 1976 6 2.12 - Humans Incapacity COhe3 Minchin 1954 7 0 - Humans Lethality COhe Minchin 1954 7
HCN-1 17.7 0.00186 0 0.165 Mice Incapacity Active wheel Sakurai 1984 2 HCN-2 12.7 0.00747 0 0.0869 Rats Incapacity Lef-flex EC50 Hartzell 1985 3 HCN-2' 3.85 0.00956 0.39 0.0514 Rats Lethality EC50 Hartzell 1985 3 'kQ-fle~10n shock avordance.
'Etfectiw concentration for hall of the individual specimens. 'Estimated from blood CO haemoglobln.
Numerical Analysis of Fire Gas Toxicity 131
2
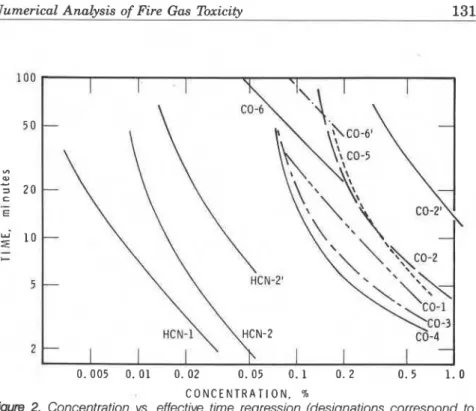
0.005 0. 0 1 0. 02 0. 05 0. 1 0. 2 0.5 1 . 0 C O N C E N T R A T I O N , 70
Figure 2. Concentration vs. effective time regression (designations correspond to Table 1).
and to in Equation (2) were obtained by the method of best fit [I] using the experimental data. Calculated values depended to some extent on experimental conditions such as the type of toxicity effects, the method of measurement, and the kinds of animals. Results are summarized in Table 1 and regression curves are shown in Figure 2. In the table, a in- dicates dispersion of data from the regression curve. In the figure, designation of the curves corresponds to numbers in the table. In order to show all the curves on one graph, a coordinate of logt vs. logC is used in the graph and regression curves are not linear. The curves are linear on a coordinate of log(t - to) vs. log(C - CO).
CO-1 and HCN-1 are data on mice while all the others except CO-6 and CO-6 ' are data on rats. There was not much difference between the reactions of mice and those of rats exposed to CO. CO-2' and HCN-2' are results of lethality experiments, and all others are results of in- capacitation experiments except for CO-6 and CO-6'. The concentra- tions required for lethality in rodents were 2 to 4 times higher than for incapacitation. CO-6 and CO-6' were studies on human incapacitation and lethality, respectively. The curves were estimated based on experi-
84 1.0 z- 2 C
2
0.5E
0 Z8
0 LETHALITY 0 5 10 15 20 25 30 EXPERIMENT TIME, minutes(a) CO EXPERIMENT NO. 1
l NCAPACITATION EXPERIMENT 84 1.0 2- 0 C 0.5
E
Z 0 0 5 10 15 20 25 30 35 4 0 45 5 0 55 6 0 TIME, minutes (bl CO EXPERIMENT NO. 2e PRED I CTEDi PREDICTED
TI ME, minutes ( c ) HCN EXPERIMENT NO. 1 0 10 15 20 25 30 35 40 TIME, minutes LETHALITY EXPERIMENT INCAPACITATION EXPERIMENT ( d ) HCN EXPERIMENT NO. 2
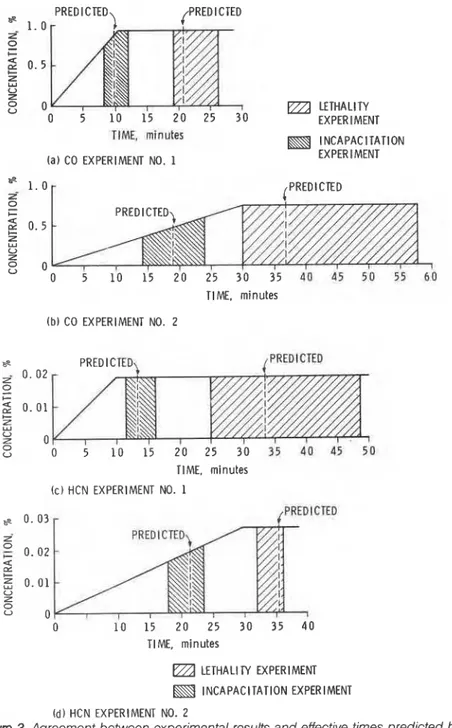
Figure 3. Agreement between experimental results and effective times predicted by
Numerical Analysis of Fire Gas lhxicity 133
ments in which carboxyhaemoglobin in blood was determined after a mild exposure to CO [71.
AGREEMENT BETWEEN PREDICTION AND EXPERIMENTS
Equation (6) is to be used for calculating the time required before a toxicity effect is observed in the course of a fire. Although, in a fire, the concentrations of toxic gases are always changing with time, concentra- tions were fixed in the experiment from which values of the constants in Equation (6) were calculated. The authors' predicted effective times calculated using Equation (6) should be compared with experimental data in which the concentrations are changing. Such experimental data were presented by Hartzell et al., who exposed rats to concentra- tions of toxic gases that were increased linearly from zero to a certain level and held there [3].
The times to incapacitation and to lethality predicted by the authors (for the calculation, values of constants CO-2 and HCN-2 for incapacita- tion and (20-2' and HCN-2' for lethality in %ble 1 were used), and those obtained by experiments of Hartzell et al., are given in Figure 3.
The predicted times' are within the range of the given experimental data (shaded areas).
CONCLUSION
The authors' method for calculating the time required before a n effect from a toxic gas is observed has been examined by comparing the predicted effective times with experimental data in which the concen- tration of toxic gases was varied with time. Agreements between the predictions and the experimental data were quite good.
REFERENCES
1. Tsuchiya, Y. and Nakaya, I., "Numerical Analysis of Fire Gas Toxicity: Sin- gle and Multiple-Component Systems," 4th expert meeting of the Canada-Japan-USA cooperative study on fire gas toxicity, Tsukuba, Japan, Proceedings in print (May 15-16, 1985).
2. Sakurai, T, '"hxic Gas Test by the Several Pure and the Mixture Gas," presented a t the 3rd expert meeting of the Canada-Japan-USA cooperative study on fire gas toxicity, Ottawa, Canada (October 23-25, 1984). 3. Hartzell, G. E., Priest, D. N. and Switzer, W. G., "Mathematical Modeling of
Intoxication of Rats by CO and HCN," J Fire Sciences, Vol. 3, p. 115 (1985). 4. Kaplan, H. L. and Hartzell, G. E., "Modeling of Toxicological Effects of Fire
5. Hartzell, G. E., Packham, S. C. and Switzer, W. G., "Assessment of Toxic Hazards of Smoke: 'Ibxicological Potency and Intoxication Rate Thresholds:' Fire and Materials, Vol. 7, p. 128 (1983).
6. Hartzell, G. E., Packham, S. C., Hileman, F. D., Islael, S. C., Dickman, M. L., Baldwin, R. C. and Micelson, R. W., "Physiological and Behavioral Responses to Fire Combustion Products:' 4th Intl. Cellular Plastics Con- ference, SPI Canada, Montreal, Canada (Nov. 18, 1976).
7. Minchin, L. T., "Mild Carbon Monoxide Poisoning as a n Industrial Hazard:' Industrial Chemist, Vol. 30, p. 381 (1954).
BIOGRAPHIES Yoshio Buchiya
Dr. Yoshio Tsuchiya is a senior research officer a t the Fire Research Section, Institute for Research in Construction, National Research Council of Canada. He received his Bachelor of Engineering (1953) and Doctor of Engineering (1962) degrees from the University of Tokyo. He is the author of over 70 papers in the fields of explosives, pyrolysis and combustion of polymers, indoor air quality and fire gas toxicity. Ichiro Nakaya
Dr. Ichiro Nakaya, a research officer a t the Building Research In- stitute of Japan, was Research Associate a t the National Research Council of Canada (July 1984-December 1985). His Master of En- gineering and Doctor of Engineering degrees in 1979 and 1983, respec- tively, from the University of Tokyo were based on work in cornpart- rnent fire modelling. He is currently involved in both toxicity and corn- partment fire studies.
T h i s p a p e r i s b e i n g d i s t r i b u t e d i n r e p r i n t form by t h e I n s t i t u t e f o r R e s e a r c h i n C o n s t r u c t i o n . A l i s t of b u i l d i n g p r a c t i c e and r e s e a r c h p u b l i c a t i o n s a v a i l a b l e from t h e I n s t i t u t e may be o b t a i n e d by w r i t i n g t o t h e P u b l i c a t i o n s S e c t i o n , I n s t i t u t e f o r R e s e a r c h i n C o n s t r u c t i o n , N a t i o n a l Research C o u n c i l of C a n a d a , O t t a w a , O n t a r i o , K l A OR6. Ce document e s t d i s t r i b u C s o u s forme de t i r d - 8 - p a r t p a r 1 ' I n s t i t u t de r e c h e r c h e e n c o n s t r u c t i o n . On peut o b t e n i r une l i s t e d e s p u b l i c a t i o n s de 1 ' I n s t i t u t p o r t a n t s u r l e s t e c h n i q u e s ou l e s r e c h e r c h e s en m a t i s r e d e b l t i m e n t e n 6 c r i v a n t B l a S e c t i o n d e s p u b l i c a t i o n s , I n s t i t u t de r e c h e r c h e en c o n s t r u c t i o n , C o n s e i l n a t i o n a l d e r e c h e r c h e s du Canada, Ottawa ( O n t a r i o ) , KIA 0R6.