HAL Id: hal-00163675
https://hal.archives-ouvertes.fr/hal-00163675
Preprint submitted on 17 Jul 2007
HAL is a multi-disciplinary open access
archive for the deposit and dissemination of
sci-entific research documents, whether they are
pub-lished or not. The documents may come from
teaching and research institutions in France or
abroad, or from public or private research centers.
L’archive ouverte pluridisciplinaire HAL, est
destinée au dépôt et à la diffusion de documents
scientifiques de niveau recherche, publiés ou non,
émanant des établissements d’enseignement et de
recherche français ou étrangers, des laboratoires
publics ou privés.
investigating prokaryotic ORF expression potentialities,
in relation with potentially high transcription
Christine Sinoquet, Sylvain Demey, Frédérique Braun
To cite this version:
Christine Sinoquet, Sylvain Demey, Frédérique Braun. Genome-comparative computational approach
for investigating prokaryotic ORF expression potentialities, in relation with potentially high
tran-scription. 2007. �hal-00163675�
— Bioinformatics, Computational Biology —
R
ESEARCH
R
EPORT
No HAL identifier
July 2007
Genome-comparative computational approach for
investigating prokaryotic ORF expression
potentialities, in relation with potentially high
transcription
Christine Sinoquet†, Sylvain Demey†, Fr´ed´erique
Braun‡
†Lina - Laboratoire d’Informatique de Nantes-Atlantique, CNRS - FRE 2729, Universit´e de Nantes, 2 rue
de la Houssini`ere, BP 92208, 44322 Nantes Cedex, France, ‡INSERM U601, D´epartement de Recherche en Canc´erologie, Universit´e de Nantes, 9 quai Moncousu, 44093 Nantes Cedex 01, France
LINA, Université de Nantes – 2, rue de la Houssinière – BP 92208 – 44322 NANTES CEDEX 3
Tél. : 02 51 12 58 00 – Fax. : 02 51 12 58 12 – http
:
//www.sciences.univ-nantes.fr/lina/
Braun‡
Genome-comparative computational approach for
investigating prokaryotic ORF expression
potential-ities, in relation with potentially high transcription
30p.
Les rapports de recherche du Laboratoire d’Informatique de Nantes-Atlantique sont disponibles aux formats PostScript®et PDF®`a l’URL :
http://www.sciences.univ-nantes.fr/lina/Vie/RR/rapports.html
Research reports from the Laboratoire d’Informatique de Nantes-Atlantique are available in PostScript®and PDF®formats at the URL:
http://www.sciences.univ-nantes.fr/lina/Vie/RR/rapports.html
© July 2007 by
Christine Sinoquet†, Sylvain
Demey†, Fr´ed´erique Braun‡
for investigating prokaryotic ORF expression
potentialities, in relation with potentially high
transcription
Christine Sinoquet†, Sylvain Demey†,
Fr´ed´erique Braun‡
christine.sinoquet@univ-nantes.fr
Abstract
To synthesize a protein of interest, biotechnological techniques associate a strong promoter and a synthetical 5’ Un-Translated Region (UTR) optimized to enhance gene expression. Besides, in prokaryotic genomes, transcription and translation are temporally and spatially related events. Therefore, it is worth investigating whether potentially high transcription is associated or not with high translation potentiality. Secondly, since bacteria share common character-istics related to transcription (binding sites); a cross-genome comparison of 5’ UTRs’ features is of importance for insights into genome organization.
We implemented BACTRANS2, a software platform dedicated to the identification of genes harbouring putative strong promoters in prokaryotic genomes. Through a complementary software suite, we analysed such genes identified in 32bacterial genomes with respect to various characteristics related to translation: nature of start codon, location of Shine-Dalgarno sequence upstream of the start codon, AT-richness in the regions flanking translation signals, inter-ference of secondary structure with translation signals, possible influence of mRNA 5’ terminal secondary structure on mRNA stability. In particular, regarding AT-richness and interference with secondary structure, we show that pu-tative strong promoters are characterized by a typical bias common to the known functional promoters of Escherichia
coli genome. Generally speaking, all five criteria related to translation indicate that putative strong promoters are
not favoured over known functional promoters. On the other hand, the large-scale genome-comparison implemented highlights the similarity of the 5’ UTR characteristics between genes harbouring putative strong promoters. Platform BACTRANS2 is available at http://www.sciences.univ-nantes.fr/lina/bioserv/BacTrans2/. The present work required implementing many more softwares devoted to the analysis of mRNA translatability in rela-tion with potentially transcriprela-tion. The source code is freely distributed to academic users upon request to the authors. The annotation files relative to the 32 genomes studied are available at http://www.sciences.univ-nantes.fr/lina/bioserv/BacTrans2/putative strong promoters.
tion, or mRNA synthesis, is promoted by two short sequences at -10 and -35 positions or thereabouts upstream of the Transcription Start Site (TSS). Binding to RNA polymerase, these sequences initiate transcription. Translation, which is the process of synthesizing a protein from an mRNA transcript, is regulated by the sequence and structure of the 5’ untranslated region (UTR). Within the 5’UTR, the Shine-Dalgarno sequence binds to the ribosome. Transcription has been widely studied in E. coli K-12
(Hawley and McClure, 1983; Harley and Reynolds, 1987; Collado-Vides et al., 1991; Lisser and Mar-galit, 1993; Fenton et al., 2000; Gruber and Gross, 2003; Pager and Helmann, 2003; Herring et al., 2005; to cite but a few works). In the meanwhile, various methods devoted to bacterial promoter prediction have been proposed (Huerta and Collado-Vides, 2003; Eskin et al., 2003; Bulyk et al., 2004; Shultzaberger et
al., 2007; to restrain to a few examples). Furthermore, since the RNA polymerase is conserved through
evolution in bacteria, research was extended to other bacteria (Gross et al., 1992; Gralla and Collado-Vides, 1996; Li et al, 2002; Martinez-Antonio and Collado-Vides (2003); Huerta et al, 2006; for some illustrations).
In vivo, transcriptional regulations are known to compensate for promoter weakness (Gross et al.,
1998; Browning and Busby, 2004). Thus, identifying putative strong promoters is valuable to biotechno-logical applications for enhancing the expression of genes of interest. Besides, evaluating mRNA trans-latability associated with potentially high transcription is of importance to advances in biotechnologies as well as fundamental knowledge. Our study deals with the σ70 promoter, including a non-canonical
vari-ant consisting of three binding sites. In addition to the usual -10 and -35 boxes, the Upstream Promoter element (UP element) is located approximately4 bp upstream of the -35 region, conferring additional
strength to the promoter. The UP element was experimentally identified in E. coli (Ross et al., 1993; Estrem et al., 1998; Estrem et al., 1999), Bacillus subtilis (Fredrick et al., 1995), Vibrio natriegens (Aiyar
et al., 2002) and Geobacillus stearothermophilus (Savchenko et al., 1998). For our purpose, we analyse
five classes of features related to translation potentiality. We compare the trends between32 prokaryotic
genomes. Then we compare these trends with the trends observed for genes harbouring known functional promoters in Escherichia coli genome. In the sequel, genes harbouring Putative Strong Promoters are denoted PSP genes and genes harbouring Functional Promoters are referred to as FP genes.
2
Systems and Methods
2.1
Annotation of genomes with potentially strong σ70 promoters
Thirty-two annotated genome files were taken from the publicly available database GenBank. We selected the two well-studied models Escherichia coli and Bacillus subtilis, as well as an extremophilic model,
Thermotoga maritima. Our selection provides a good representation of the bacteria spectrum (Actinobac-teria, Chlamydia, Firmicutes, Proteobac(Actinobac-teria, Spirochaetales). We restrained our investigation to genes
coding for mRNAs. The canonical σ70 promoter structure is described in 5’ to 3’ direction as [−35 box] <spacer>[−10 box]. In Genbank files, the only location annotation available is the start codon location.
Hence, for each gene, the start codon (SC) is considered a right anchor and each region upstream of SC is scanned to retrieve in priority the structured motif[U P element] <spacer4> [−35 box] <spacer3> [−10 box] <spacer2> [SD] <spacer1>, where SD denotes the Shine-Dalgarno sequence. The full motif
identification is performed in the 3’ to 5’ direction, successively considering each possible occurrence of the current box as a right anchor. In the absence of any UP element, the structured motif[−35 box] <spacer3>[−10 box] <spacer2> [SD] <spacer1> is looked for. Three types of constraints must be
set: box contents (consensuses) are specified, a minimal similarity threshold relative to each such box is fixed, the spacers are described through the minimal and maximal bp distances allowed for them. For
each box of the structured motif, the minimal similarity threshold is expressed as the maximal number of mismatches allowed. To identify the best candidate in the regulatory region, an exact combinatorial approach is implemented rather than a probabilistic approach: reducing the number of mismatches with regard to each box consensus is the optimization criterion used instead of maximizing information con-tent (Schneider et al., 1986). The justification for this is that our aim is identifying pocon-tentially strong promoters, not predicting functional promoters. Thus, in essence, there are no strong promoters available over the32 genomes studied to learn models from, contrary to previous works ((Huerta et al., 2003),
where288 Position-Specific Scoring Matrices were learned from E. coli; (Shultzaberger et al., 2007),
which considered6 models for functional promoters in E. coli).
In the work reported here, the structured motif is tuned as[N N AAAW W T W T T T T N N AAAAN N N ] <0-15>[U U GAC] <15-20> [T AT AAT ] <10-200> [GGAGG] <2-10>. The maximal mismatch errors allowed are respectively: 0 (SD), 2 (-10 box), 3 (-35 box) and 4 (UP element). The increase of the specificity
requirement in the 5’ to 3’ direction is modeled after observations relative to functional σ70
promot-ers. Moreover, we intentionally focus on the subset of putative strong σ70 promoters already potentially
favoured by the presence of an optimal SD sequence. The presence of the SD sequence has been ascer-tained for a large number of bacteria (Osada et al., 1999) and it was established that the extent to which a SD sequence is conserved relates to its translation efficiency (Ma et al., 2002). On the other hand, our choice of a shorter consensus for the -35 box rather than the canonical -35 box itself (UUGACA) is moti-vated by sixth nucleotide having the lowest conservation level. Our choice simply amounts to taking into account the canonical -35 box allowing4 mismatches at most. Besides, at most 4 mismatches may seem a
low constraint for such a22 bp-long box as the UP element. But indeed, the content description is already
rather flexible with5 wild-card N nucleotides and 3 W nucleotides (T or A). Finally, when given a genome
file, a structured motif specification and the numbers of mismatches allowed for the corresponding boxes, BACTRANS2outputs0 or 1 putative strong promoter per gene coding for an mRNA.
2.2
Sorting the strong promoters
For each gene encoding a protein, a sequence of interest upstream of the start codon is investigated for potentially strong promoter candidates. This sequence of interest encompasses the largest possible configuration resulting from the user’s specification (283 nucleotides in our case). To identify the strong
promoter with the highest potentiality, a scoring function is defined, based on bp distances and mismatch error numbers. In the sequel, d35.10 and dU P.35 respectively denote the bp distances between the -10
and -35 boxes, and between the -35 box and the UP element; e10, e35 and eU P respectively describe the
maximal numbers of mismatches allowed with respect to the -10 box, the -35 box and the UP element. In the present study, the score is computed as follows: score= 0.60 × e10 + 0.40 × e35 + eU P + t1+ t2
where t1 = 0 if d35.10 belongs to interval [17, 19] else t1 = 5 × d35.10, and t2 = 0 if dU P.35
ranges in interval[3, 5] else t2 = 3 × dU P.35. When no UP element can be found, the score becomes: score= penalty + 0.60 × e10 + 0.40 × e35 + t1. The lower the score, the more likely the identified putative promoter is a strong one. The penalty value is set in order to systematically favour a candidate with an UP element within the regulatory region.
2.3
Features describing transcription and translation potentialities
For each gene harbouring a putative strong promoter, the following characteristics retative to transcription are provided: score, putative binding site contents, corresponding numbers of mismatches, bp distances between all boxes of the structured motif aforementioned. The transcription start site (TSS) is identified as the9thnucleotide downstream of the extremity of the -10 box.
On the one hand, several experimental works demonstrated that the use of AUG start codon could increase gene expression level in E. coli and B. subtilis genomes (Roy et al., 1988; Vellanoweth and
Rabinowitz, 1992). On the other hand, the secondary structure of mRNA 5’ extremity is known to play an important role in post-transcriptional gene regulation. First, such a structure is likely to perturb translation initiation when interferring with the start codon or the Shine-Dalgarno sequence. Here, interference means that a translation signal is located in a stem (partially or entirely). Besides, AT-richness is known to prevent the formation of steady secondary structures and it was shown for E. coli that the AT-richness of the region following the initiation codon plays a significant enhancing role in gene expression (Sato
et al., 2001; Qing et al., 2003; Voges et al., 2004). Finally, hairpins at mRNA 5’ extremity have been
shown to play various roles regarding mRNA stabilization: (i) the possibility to form a hairpin very close to the 5’ end is known to stabilize the mRNA molecule in Escherichia coli (Emory et al, 1992; Bricker and Belasco, 1999; Carrier and Keasling, 1999; Cebe and Geiser, 2006); (ii) stem-loop structures are also likely to protect mRNA against the attacks by the main decay-initiating ribonuclease, RNase E (Bechhofer, 1993; Unniraman et al, 2002); (iii) the presence of double-stranded RNA is also required for mRNA degradation by RNase III enzyme. Such stabilization regulations are used by prokaryotes for expression control purpose (Belasco and Brawerman, 1993; Cohen and McDowall, 1997; Carrier and Keasling, 1997).
In this work, we describe genes harbouring putative strong promoters through five classes of features related to translation: (i) start codon nature, (ii) location of the Shine-Dalgarno sequence upstream of the start codon, (iii) AT-richness of the regions flanking the Shine-Dalgarno sequence and the start codon, (iv) interference between translation signals and mRNA 5’ terminal secondary structure, (v) possible presence of a stabilizing secondary structure at mRNA 5’ extremity. Regarding AT-richness context of translation signals, we examine5 bp-long left and right flanking regions.
2.4
Processing the mRNA 5’ terminal secondary structure
Transcription and translation are quasi simultaneous processes in prokaryotic genomes. Hence the ribo-some flattens the mRNA secondary structure when it proceeds along this molecule. Therefore we need only consider a sub-region at mRNA 5’ extremity for folding. In the sequel, this sub-region is called the mRNA 5’ terminal sub-region; it obligatorily contains both transcription signals. A threshold lθ is specified for discrimining between short and long 5’UTR regions. In the case of a long 5’UTR region, the 5’ terminal sub-region considered is restrained to the 5’UTR region and is automatically sized to ld nucleotides downstream, including the start codon. When the 5’UTR region’s length l is less than or equal to lθ, we consider up to n downstream nucleotides, including the start codon, with l+ n equal to lθ+ ld. In this study, lθ and ld are respectively tuned to70 and 10. For each gene with a putative strong promoter identified, the mRNA 5’ terminal sub-region is folded using the program RNAsubopt of the Vienna RNA Package (Hofacker et al., 1994; Wuchty et al., 1999). The resulting folding depends on the temperature optimal for the life of the prokaryote considered. This temperature is tuned to37o
C for all species considered except for hyperthermophilic prokaryotes (Thermoanaerobacter tengcongensis (75o
C), Aquifex aeolicus (96o
C) and Thermotoga maritima (80o
C)). For each gene harbouring a poten-tially strong promoter, we select the folding predicted with the lowest free energy, among all suboptimal secondary structures calculated within 1 kcal/mol above the minimum free energy.
Table 1 describes seven types of stem-loop or helix structures whose average frequencies were com-puted. The first four types were searched for within close distance from TSS, namely in the range
[+1, +4]. No interior loop is allowed in these four types. Depending on the stem length, the loop length
and the number of bulges, some hairpins might favour or not mRNA stability (T1 to T 4). But hairpins
are also known to play a direct role regarding mRNA degradation. We looked for type T5, characterized
as a hairpin containing at least half of the RNase E cleavage site. The reader is referred to Table 2 for a description of the various sites RNase E is able to cleave. Moreover, in this case, we were careful to check that no full RNase E cleavage site was also present in single-stranded RNA located between the former hairpin identified and a second hairpin. Consistently, we also looked for type T6, consisting of two
hair-distance interior loop stem loop number number of specificity presumed reference from TSS allowed length length of bulges nucleotides in bulge influence
T1 [+1, +4] no ≥14 ≤4 ≤1 ≤2 — + Carrier and Keasling, 1999
T2 ” ” yes — ≥7 — — — - ” ”
T3 ” ” yes — — ≥2 — — - ” ”
T4 ” ” yes ≥ 4 [4, 6] — — — + Arnold et al, 1998
T5 [+1, +20] no ≥ 6 ≤ 4 — ≤2 RNase E cleavage site + Naureckiene and Uhlin, 1996
trapped in stem
T6 ” ” no ” ” ” ” ” ” ” ” two hairpins flanking - R´egnier and Hajnsdorf, 1991
an RNase cleavage site
T7 [+1, +20] × ≥20 ≤3 ≤2 helix - Cheladurai et al., 1991
Table 1: Seven various types of stem-loop and helix structures and their presumed influence on the stability of mRNA. —: indifferent; ×: inadequate
cleavage site reference G/AUUU Lundberg et al, 1990
U/AUUU ” ”
A/AUUU Ghora and Apirion, 1978
A/AUAA ” ”
U/AUUU Tomcsanyi and Apirion, 1985 A/AUUA Muddet al., 1988 AAU/UU Faubladier et al., 1990 AA/GCU R´egnier and Hajnsdorf, 1991
AG/UUU ” ”
G/AUCG Mackie, 1991
GU/AUU Nilsson and Uhlin, 1991
AAU/UU Gross, 1991
GU/UUU ” ”
G...U Ehretsmann et al., 1992 or .AUU.
or A...A
Table 2: Various cleavage sites for the RNase E of Escherichia coli. The slash character indicates the cleavage location.
pins separated by single-stranded RNA harbouring an RNase E cleavage site. Type T5 is presumed to
prevent mRNA decaying through interference with RNase E cleavage site. On the opposite, in type T6
conformation, the cleavage site is accessible to RNase E. Moreover, this unfavourable conformation is stabilized by the two flanking hairpins. For both types T5 and T 6, we arbitrarily examined the possibility
of such a conformation to start in the range[+1, +20] (with respect to TSS). Finally, the presence of
a hairpin may be unfavourable to mRNA stability since RNase III enzymes require a double-stranded cleavage site harboured in an hairpin. A specific cleavage site consensus is known for E. coli: it is de-scribed as WNAGWGCNNCWUNNN/NAWGNNCWCUNW in 5’ to 3’ direction, with its complement WNUCWCGNNGWAN/NNNUWCNNGWG ANW on the other strand (Krinke and Wulff, 1990). The six boldface characters correspond to conserved nucleotides. The slashes in both halves point out the cleavage site. However, it was also shown in vitro that provided an helix had a sufficient length (over
20), it could be subject to degradation by RNase III (Cheladurai et al., 1991). In the present study, T 7
2.5
ORF potential expression: functional promoters of E. coli versus potentially
strong promoters
Known functional σ70 promoters of E. coli genome are available in repositories such as RegulonDB
(Salgado et al., 2006) and PromEC (Hershberg, et al., 2001). RegulonDB is the reference database for E. coli curated knowledge;601 σ70 promoters are listed in 5.6 RegulonDB release (january 2007,
http://regulondb.ccg.unam.mx/data/Promoter Set.txt). PromEC is entirely dedicated to functional σ70 E.
coli promoters (http://margalit.huji.ac.il/); it includes471 entries, among which some are common to
RegulonDB. E. coli genome contains4173 genes coding for mRNAs (out of 4288 genes). The trends
for the five classes of translation features described in the previous subsection are compared between ORFs associated with functional promoters of E. coli genome and ORFs associated with putative strong promoters identified in the32 genomes studied, E. coli genome comprised. In particular, we compare the
distributions for the location of Shine Dalgarno sequence upstream of the start codon. But RegulonDB and PromEC only provide experimentally identified TSSs. Therefore, for each functional promoter, we have to infer the Shine-Dalgarno sequence location; we identify the subsequence located between7 and 15 bp upstream of the start codon, and most similar to the optimal Shine-Dalgarno sequence.
2.6
Implementation
We first implemented a software devoted to the identification of putative strong σ70 promoters in the
hy-perthermophilic model genome of Thermotoga maritima. Subsequently, the generic platform BACTRANS2
was developped: it allows the exhaustive search of any structured motif consisting of3 to 4 boxes in any
bacterial genome specified. The web-interface assists the user in specifying the description of the struc-tured motif (bp distances between boxes and minimal similarity thresholds); an expert user may modify the tuning of the scoring function. In addition, BACTRANS2provides a browser to navigate through, visu-alize and classify the best mRNA 5’ terminal secondary structures predicted for each PSP gene. Besides, this platform presents intra- and inter-genomic statistics through various plots. The client-server system implemented facilitates efficient handling of sessions. Each session is relative to both a given genome and a specification. In particular, BACTRANS2identification core software has already been used intensively to study the statistical significance of putative strong promoters, in the32 bacterial genomes studied.
Finally, a software suite was developped to thoroughly investigate mRNA translatability in relation with high transcription potentiality. The components of this software suite were adapted to process E. coli FP genes. FP genes were obtained merging data from RegulonDB and PromEC repositories, under redun-dancy control. The software suite was written in Java and the scripts automating the analysis over the32
genomes selected were written in Unix shell. Figure 1 depicts the various software components used in the present study.
3
Results
3.1
High transcription potentiality
For each genome, a first annotation file was produced, which contains the comprehensive list of poten-tially strong promoters (see Figure 2 (a)). These putative promoters are sorted in decreasing order, with respect to their scores. Promoters harbouring an UP element are listed at the top of the list. In addition, for visual facilities, we annotated the genes containing putative strong promoters with tags corresponding to all boxes aforementioned (see Figure 2 (b)). In the context of another study devoted to hyperthermophilic bacterium Thermotoga maritima, the experimental verification of7 putative strong promoters also
uncov-ered by BACTRANS2was performed (Sakanyan et al., 2003; Sinoquet et al., 2007): the7 promoters were
Figure 1: Description of the various software components and data flows implemented for the study of translation potentiality associated with putative strong transcription or known functional transcription.
The 6 smallest genomes are those of either obligate intracellular pathogens, symbionts or animal
commensal parasites (Borrelia burgdorferi (0.91 Mbp), Chlamydophila pneumoniae (1.22 Mbp),
My-coplasma genitalium (0.58 Mbp), Mycoplasma pneumoniae (0.81 Mbp), Rickettsia prowazekii (1.11
Mbp) and Treponema pallidum nichols (1.13 Mbp)). In a prior study, we established that the presence
of the putative strong σ70 promoter aforedescribed is statistically significant for 22 species out of the 26
ones with genomes over1.5 Mbp (Sinoquet et al., 2007). We performed a statistical analysis based on the
comparison of the frequency of PSP genes in each prokaryotic genome and the average frequency cal-culated over100 randomly generated genomes. These latter genomes were only constrained to have the
same total number of genes coding for mRNAs, and the same proportions of nucleotides A, T, C and G as the bacterial genome. We find interesting to keep Haemophilus influenza, Helicobacter pylori, Vibrio
cholerae, Xanthomonas campestris and the6 species with the smallest genomes in the present
genome-comparative analysis. Supplementary Appendix 1 compares the frequencies of putative strong promoters obtained over the32 genomes, enlightening the proportion of putative strong promoters harbouring an
UP element.
3.2
Translation potentiality
3.2.1 Nature of start codon
In Escherichia coli genome, the three pre-eminent start codons AUG, GUG and UUG are known to be less favourable to gene expression when considered from AUG to UUG. On average, we check that the respective percentages for AUG, GUG and UUG are80.36%, 12.18% and 7.19%, over the 32 genomes
(for more details, see Supplementary Data, Appendix 2).
3.2.2 Location of Shine-Dalgarno sequence upstream of the start codon
Due to the contraints specified for the present application, Shine-Dalgarno sequence’s 5’ extremity ranges between7 and 15 bp upstream of the start codon. For an overwhelming majority of genomes, a single
location is clearly pre-eminent. Regarding the8 Firmicutes which are not Mollicutes, we observe that the 8 most frequent locations vary in the range [11, 13], 12 being the most represented location. Quite another
trend is observed with respect to Proteobacteria: for11 Proteobacteria out of the 13 studied, the most
frequent locations observed vary between9 and 10. The other phyla studied show maxima intermediary
between those of Firmicutes and Proteobacteria, namely between10 and 12. All corresponding plots are
displayed in Supplementary Appendix 3.
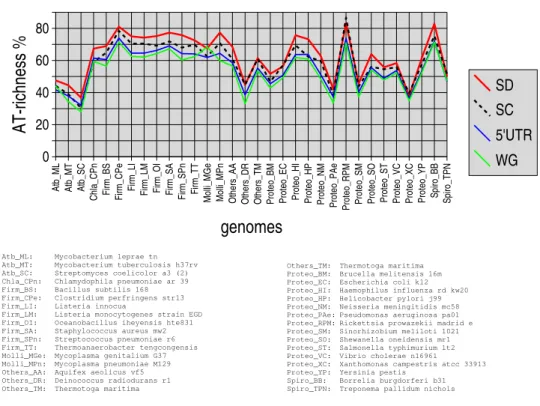
3.2.3 AT-richness in the regions flanking translation signals
For each genome studied, four AT-richness percentages are computed: average AT-richness in the regions flanking SD, average AT-richness in the regions flanking SC, average AT-richness in the 5’UTRs, aver-age AT-richness calculated over the whole genome (WG) (see Figure 3). The three former averaver-ages are computed over the PSP genes. We observe two striking features. First, all four values are highly corre-lated when considered pairwise (the correlation coefficients range in interval [0.95, 0.99]). This result
is all the less trivial as AT-richnesses in the regions flanking SC and SD are calculated considering only
10 nucleotides. Secondly, the order for AT-richnesses is always the same, whatever the genome: SD >
SC > 5’UTR > WG. Mycobacterium leprae and Mycoplasma genitalium slightly depart from this trend as showing an inversion between 5’UTR and WG AT-richness ranks. Streptomyces coelicolor,
Chlamy-dophila pneumoniae and Helicobacter pylori present an inversion between SC context AT-richness and
5’UTR AT-richness. An exception regarding the ranks of SD and SC context AT-richnesses is also ob-served for Rickettsia prowazekii; in the case of Escherichia coli, SD and SC context AT-richnesses are very close (56.31% and 56.98%, respectively). The average difference between SD and SC contexts is
4%, with 11% as a maximum (Helicobacter pylori). The difference between SD context and 5’UTR is 8% on average (maximum 13% for Mycoplasma pneumoniae). The difference between SD context and
the whole genome is10% on average (maximum 17% for Mycoplasma pneumoniae).
3.2.4 Interference of secondary structure with translation signals
We recall that the mRNA 5’ terminal sub-region considered for its secondary structure includes both Shine-Dalgarno sequence and start codon. The rule described for calculating the length of this sub-region depends on 5’UTR length. According to this rule, the sub-region length is at least equal to lθ+ ld (80). An overview of the trend relative to 5’UTR lengths is provided in Supplementary Appendix 4.
Figure 4 (a) describes interference with SD through classes SD0 to SD5. The PSP genes having i
SD nucleotides involved in base pairing together define class SDi. SCi classes are defined similarly. A common trend is observed for all32 genomes, which is reflected by the following averages: class SD0: 16.70%, class SD1: 7.06%, class SD2: 14.96%, class SD3: 25.51%, class SD4: 24.48%, class SD5: 11.25%. Between classes 1 and 5, the curve is bell-shaped and the most frequent classes are SD3 and SD4. Thus, about 60% of the genes concerned seem unfavoured with interference involving more than
half of the SD nucleotides. However, we note that the most unfavourable case, class SD5, is twice less
frequent than class SD3 or class SD4. Moreover, interestingly, the most favourable class SD0 is apart
and ranks before classes SD1 and SD2. Neither Firmicutes nor Proteobacteria with large genomes show
a deviation from this trend. Figure 4 (b) depicts interference with start codon through the description of classes SC0 through SC3. Classes SC0 to SC3 respectively total 25.76%, 16.50%, 31.54% and 26.15%
on average. Again, we observe the outstanding exception of the most favourable class, SC0, which
departs from the bell-shaped distribution. Furthermore, the proportion of genes without SC interference is greater than that of genes without SD interference (25.76% versus 16.70%, on average). Finally, the
trends respectively observed for large Firmicutes and Proteobacteria genomes are in accordance with that observed over the32 genomes.
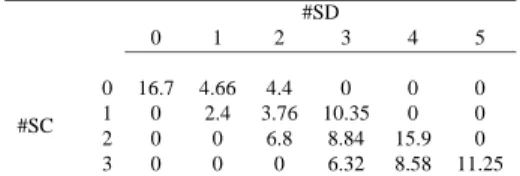
Bad accessibility to SD could be compensated by a conformation locally favourable to SC accessi-bility and vice versa. Though, quite unexpectedly, the joint distribution of #SD and #SC, the numbers of SC and SD nucleotides interferring with the secondary structure, shows a strong bias: (i) half of the
24 possible pairs (#SD, #SC) are never represented in any genome; (ii) moreover, pairs with both high
(respectively low) #SD and #SC values are pre-eminent. For each possible pair (#SD, #SC), Table 3 recapitulates the average frequencies computed over the 32 genomes: it is clearly shaped as a
quasi-diagonal matrix. Supplementary Appendix 5 compares the distributions for the24 possible pairs (#SD,
#SC) over all32 genomes. Except for small genomes such as Mollicutes and Rickettsia prowazekii, the
trend observed for each genome does not deviate from the average trend. We recapitulate the following rules observed: (i) complete SD interference (#SD=5) implies full start codon interference (#SC=3); (ii) the defavourable #SC value of3 is never encountered if #SD value is less than or equal to 2; (iii) the
favourable #SD value of1 is only associated with #SC values 0 and 1; (iv) if SD does not interfere with
the secondary structure, then neither does SC. Both previous cases (iii) and (iv) total23.76% on average.
3.2.5 Possible influence of mRNA 5’ terminal secondary structure on mRNA stability
Figure 5 depicts the frequencies of the various types exhibited in the32 genomes. Though the orders of
magnitude may differ between genomes, the order T3 > T4 > T2 > T5 > T7 is constantly observed for frequencies, with minor deviations for3 small genomes. Favourable type T 1 is rarely encountered: all
frequencies are null or close to null. Amongst T2 and T 3 presumed unfavourable types, less restrictive
type T3 is encountered with the average frequency of 39.16% (minimum and maximum respectively 26.66% and 51.35%) while type T 2 is present for 13.83% of PSP genes on average (minimum and
#SD 0 1 2 3 4 5 #SC 0 16.7 4.66 4.4 0 0 0 1 0 2.4 3.76 10.35 0 0 2 0 0 6.8 8.84 15.9 0 3 0 0 0 6.32 8.58 11.25
Table 3: Interference of mRNA 5’ terminal secondary structure with translation signals for genes har-bouring putative strong σ70 promoters, average percentages over 32 prokaryotic genomes. #SD denotes
the number of nucleotides in the Shine-Dalgarno sequence which are involved in a stem. #SC is defined similarly with respect to the start codon.
27.54% of PSP genes (minimum and maximum respectively 6.66% and 50%). Favourable type T5 is
absent from the two Mollicutes genomes as well as Rickettsia prowazekii’s; the average frequency is
4.92% (maximum 12.62%). Unfavourable type T6 is shown to be constantly absent from all genomes
studied whereas unfavourable type T7 is rarely encountered (average0.89%, maximum 2.94%). Finally,
on average, unfavourable types, UT, (T2, T 3, T 6, T 7) are slightly more frequent than favourable types,
FT, (T1, T 4, T 5). The average ratio U T
F T computed over the32 genomes is 1.57; it reflects acutely the tendancy for each genome (standard deviation0.23).
3.3
Comparing trends between putative strong promoters and functional
pro-moters of Escherichia coli genome
The characteristics of the255 genes harbouring potentially strong σ70 promoters were compared with
the characteristics of the583 genes harbouring functional σ70 promoters from RegulonDB and PromEC.
Moreover, when possible, we also compared some characteristics with those of the4173 genes coding for
mRNAs (out of a total of4288 genes). Hereafter, in addition to the PSP and FP notations, respectively
referring to genes harbouring putative strong promoters and genes harbouring functional promoters, such genes encoding proteins will be called mRNA genes.
3.3.1 Nature of start codon
Figure 6 describes the distributions relative to mRNA genes, FP genes and PSP genes, in E. coli genome. The mRNA genes divide between classes AUG, GUG, UUG and Other as follows : 81.81%, 14.95%, 3.20% and 0.02%. For FP genes, the distribution is 90.05%, 8.74%, 0.85% and 0.34% whereas it is 85.88%, 10.59%, 3.14% and 0.39% for PSP genes. First, we observe that the orders of magnitude for
the AUG and GUG percentages are quite conserved through the three gene sets. Moreover, the AUG and GUG percentages relative to PSP genes are intermediary between the percentages of the other two gene sets. Over all three gene sets, AUG is the most represented for FP genes. Consistently, GUG is the least represented for the latter genes. Interestingly, FP genes are associated in the majority with the two most performing start codons AUG and UUG.
3.3.2 Location of Shine-Dalgarno sequence upstream of start codon
Locations quite evenly distribute in interval [10, 13] for both E. coli FP genes and E. coli PSP genes.
In this interval, FP percentages range between13, 90% and 17, 83%, whereas PSP percentages range
For PSP genes, the maximal frequency,25.09%, is observed at location 9. Supplementary Appendix 3
outlines the similarity of the two curves relative to E. coli.
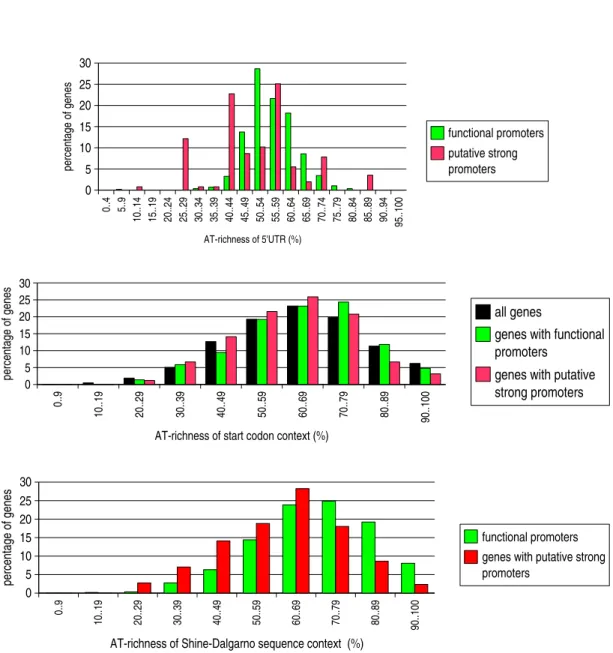
3.3.3 AT-richness in the regions flanking translation signals
Table 4 compares the AT-richness averages respectively calculated over the regions flanking SD, the regions flanking SC, the 5’UTRs and whole genome (WG). The order observed when studying the PSP genes of the32 genomes, SD > SC > 5’UTR > WG (Whole Genome), is conserved for FP genes. On
average, the bias between SD context and 5’UTR amounts to9%. For E. coli PSP genes, this previous
order is conserved, with SD and SC context AT-richnesses quasi similar, and 5’UTR AT-richness only2%
above WG percentage. In Figure 7, the AT-percentage distributions relative to 5’UTRs, SC contexts and SD contexts are compared for FP, PSP (and mRNA) genes. We observe that the histograms relative to SC and SD may be superimposed, whatever the gene set (the shape is rougly a gaussian one). Furthermore, the previous histograms possess a remarkable common characteristic regarding FP and PSP genes: on the left section of the histogram (with respect to the maximum (60%-69%)), FP gene percentages are smaller
than PSP gene percentages; on the right section, the opposite is observed. In contrast, the histogram relative to 5’UTRs has a gaussian shape for FP genes only; moreover, AT-richness values observed for PSP genes range in a large interval (from10% to 90%).
AT-richness SD context SC context 5’UTR WG(4) (1) FP genes 65.11 60.17 56.24
(2) PSP genes 56.31 56.98 50.81 49.21
(3) mRNA genes - 59.24
-Table 4. Comparison of average AT-percentages between three gene sets of E. coli genome. (1) genes harbouring functional σ70 promoters; (2) genes harbouring putative strong σ70 promoters; (3) genes
encoding proteins; (4) Whole Genome.
3.3.4 Interference of secondary structure with translation signals
We remind that the 5’ terminal region considered for folding includes at least the 5’UTR region. FP and PSP distributions of the 5’UTR lengths in E. coli are compared in Figure 8. Regarding interference, we observe comparable trends for FP genes and PSP genes (Figure 9). Focusing on the presumed three most favourable classes (#SD< 3 and #SC< 2), #SD ≤ 1 and #SC = 0, #SD = #SC = 0), we observe
the respective percentages33.71%, 24.30% and 16.47% for PSP genes. They are comparable to the
percentages38.73%, 24.16% and 13.20% relative to FP genes (see Table 5).
interference class #SD ≤2 #SD ≤1 #SD= 0
#SC ≤1 #SC= 0 #SC= 0
(1) PSP genes 31.92 23.76 16.70
(2) E. coli PSP genes 33.71 20.78 16.47
(3) E. coli FP genes 38.73 17.65 13.20
Table 5. Comparison of the average frequencies of the most favourable interference classes between three gene sets. (1) genes harbouring putative strong σ70 promoters (average over 32 genomes), (2)
genes harbouring putative strong σ70 promoters (E. coli), (3) genes harbouring functional σ70 promoters
(E. coli). Interference means that the translation signal considered partially overlaps a stem or is totally contained in a stem. #SD denotes the number of nucleotides in the Shine-Dalgarno sequence which are involved in base-pairing. #SC is defined similarly with respect to start codon.
3.3.5 Possible influence of 5’ terminal secondary structure on mRNA stability
The frequencies were computed for conformation types T1 through T 7. E. coli genome exhibits the order
T3 > T4 > T2 > T5 > T7, already observed for the PSP genes of other genomes. Moreover, this order holds for FP genes. Among the255 PSP genes, 9.80% and 41.96% respectively harbour the presumed
unfavourable T2 and T 3 conformations. Presumed favourable T 4 type is identified in 32.94% of the PSP
genes. The orders of magnitude are comparable between FP and PSP genes: regarding the FP genes, the frequencies observed for T2, T 3 and T 4 conformations are 10.12%, 33.61% and 22.98%, respectively.
Favourable type T1 and unfavourable type T 6 are absent in both gene sets. Favourable type T 5 is not
much more encountered in PSP genes than in FP genes (6.27% versus 3.25%). The same remark holds
for unfavourable type T7 (PSP genes: 1.17%, FP genes: 2.91%).
4
Discussion
The striking conclusion of the previous section is that for any criterion examined, the difference is minor between E. coli PSP genes and E. coli FP genes. The import of this conclusion will be amplified by the next comparison between E.coli FP genes and the PSP genes of the other31 bacterial genomes considered.
4.1
PSP genes are preferentially associated with AUG start codons but without
any favouring bias over FP genes
Taking as a reference the average AUG percentage over all genes coding for mRNAs in E. coli genome, that is82%, we show that E. coli σ70 promoters, however functional or potentially strong, are associated
with higher AUG percentages. Nonetheless, in E. coli genome, PSP genes are less frequently associated with AUG codons than FP genes (86% versus 90%). When considered over 32 genomes, the AUG
per-centages relative to PSP genes are confirmed to be lower than E. coli FP percentage (5 cases excepted).
On the other hand, a statistical study focusing on highly expressed genes of B. subtilis failed to charac-terize them by an AUG bias (Rocha et al., 1999). Thus, without denying the enhancing role of AUG in translation, this latter study points out that a high translation level is not obligatorily associated with the AUG codon. Finally, in light of the preceding remark and since no strong bias is shown with respect to FP genes, we are not able to conclude whether the PSP genes are actually less favoured than FP genes.
4.2
The typical distribution for SD locations is common to PSP genes and genes
encoding proteins
Regarding the location of Shine-Dalgarno sequence upstream of start codon, it is remarkable that the typical distribution (two maxima) exhibited for genes analysed in141 prokaryotic genomes (Chang et
al, 2006) has been uncovered for the PSP genes, in the32 genomes studied. Chang and co-workers
dealt with all genes coding for mRNAs. They showed that SD sequences are mainly observed at9th position upstream of the initiation codon, and specifically at11th position for Bacillales, an order of Gram-positive bacteria, placed within the Firmicutes. Regarding PSP genes, we observe that the most frequent SD locations vary between9 and 10 in Proteobacteria; in contrast, they range from 11 to 13 in
Firmicutes,12 being the most represented value. The slight shift between the two distributions compared
is easily explained: we searched for exact SD sequences in interval [7, 15] upstream of the start codon,
whereas Chang and co-workers considered a set of6 SD sequence variations. Shine-Dalgarno sequence
being located in a narrow region upstream of the start codon, it is likely that FP genes (whether known or not) and PSP genes rely on the same Shine-Dalgarno sequence. Anyway, it was perhaps not expected that32 would be sufficient enough for the two maxima to be outlined.
4.3
A favourable AT-richness bias in the vicinity of SD and SC characterizes both
PSP and FP genes
For an insight into potential protection against secondary structure formation, AT-richness percentages were computed in the vicinity of translation signals. On average, the order SD > SC > 5’UTR > WG (Whole Genome) was constantly observed for the PSP genes of any genome studied, as well as for E. coli FP genes. SD and SC context AT-richnesses differ by4% and 5% respectively for PSP genes (average
over the 32 genomes) and FP genes. The difference between SD context richness and 5’UTR
AT-richness is more acute (8% and 9% for PSP and FP genes, respectively). As a result, on average, SD
AT-richness amounts to65% for E. coli FP genes and reaches up to 75%, for PSP genes in Firmicutes. To
recapitulate, not only is 5’UTR characterized with a favourable AT-bias; inside or in the close vicinity of the 5’UTR, start codon and Shine-Dalgarno sequence could potentially benefit from a higher protection. Moreover, on average, there is evidence that Shine-Dalgarno sequence is likely to be better protected than start codon.
4.4
For PSP and FP genes, interference with secondary structure is either high
or low for both SD and SC signals
A complement to the previous analysis of potential preservation from secondary structure formation, the straight investigation of translation signal interference with predicted 5’ terminal mRNA secondary struc-ture is crucial to our conclusions. Though, it must be reminded that inescapable limits are inherent to our large-scale automated approach: adequacy of the rule used to identify what should be the 5’ terminal sub-region subject to folding, in silico prediction necessarily ignoring in vivo environment, choice between several suboptimal predictions. Notwithstanding these drawbacks, we underline the strong convergence of the observations over the32 prokaryotic genomes: no balanced case with high SD interference and
low SC interference is observed; neither is the symmetric case. Thus, the present work establishes that potentially high transcription is characterized with the same bias as functional promoters, regarding trans-latability: SD and SC contexts AT-enriched over the average, and more strikingly, a typical distribution for the24 interference classes. It was not worth evaluating through simulation what would be SC or SD
interference for an average genome generated at random and having the same nucleotide composition as a given bacterial genome. Indeed, navigating with BACTRANS2’s browser through the 5’ terminal secondary structures of various PSP genes convincingly confirms the following statement: due to high local variability, even if SD and SC are in close proximity, it is unlikely that they might be simultaneously present in the same substructure (a loop or a paired region). Thus, in particular, it was not foreseeable that class (#SD ≤ 2, #SC ≤ 1), describing low interference for both SD and SC, would total at least a
third of the PSP genes in a genome, on average.
Results regarding FP genes are interesting by themselves. First, when all the nucleotides of a trans-lation signal are involved in base-pairing, a transtrans-lation regutrans-lation is likely to exist. Second, if the role of the ribosome was supposed to be strongly hampered when strictly more than50% of the nucleotides in
the translation signal interfer with the secondary structure, then we would observe that only39% of E.
coli FP genes would distribute into classes hypothesized favourable to high ORF expression (#SD ≤2,
#SC ≤1). However, in the remaining 61%, some FP genes might be known to be highly expressed. In
this case, the following explanations would be put forward: the actual SD sequence used might not be the one predicted, but a suboptimal sequence in its close vicinity, instead; otherwise, the actual mRNA 5’ terminal secondary structure might be determined by post-transcriptional mechanisms. Besides, the hybridization strength is known to vary along stems, in relation with the nature of pairing nucleotides. Then, owing to the possible high local AT-richness of the stem interferring with a given translation signal, it is likely that in vivo, some regions predicted paired are actually not. If they were nevertheless paired
This is not novel knowledge regarding FP genes; more interestingly, our study backs up the necessity of regulations for the PSP genes that might be highly expressed through their strong promoters, in spite of predicted high interference.
4.5
5’ terminal secondary structures presumed unfavourable to mRNA
stabiliza-tion are slightly pre-eminent in PSP and FP genes
Again, we observe similar trends for PSP genes and FP genes, whatever the favourable or unfavourable influences considered (respectively T1, T 4, T 5 and T 2, T 3, T 6, T 7). First, it was not expected that
simple stem-loops, instead of embedded secondary structures, would be so frequent at 5’ extremity. Sec-ondly, it was neither foreseeable that favourable type T5 nor unfavourable type T 7 would be encountered
at so low frequencies. So we show that though the consensus for RNase E cleavage site is rather a flexible motif, its presence in a hairpin is a rare event (type T5); it was neither expected that a helix of minimal
length20 nucleotides would be proven to be a rare conformation (T 7). At least, the absence of the most
constrained structures, such as T1 hairpins or the two hairpins flanking an RNase E cleavage site in type T6, is explainable. The categorization of local secondary structures into favourable and unfavourable
types is drawn from various sources accounting for in vitro observations performed under heterogeneous experimental conditions, in E. coli genome. Besides, the list considered is assuredly not exhaustive. Nev-ertheless, to our knowledge, the present study offers the first large-scale insight into the distribution of potentially stabilizing secondary structures associated with genes harbouring promoters. We retain that
T2, T 3 and T 4 types considered together respectively total 91%, 85% and 67% on average for PSP genes
over the32 genomes studied, E. coli PSP genes and E. coli FP genes. Finally, in light of observations
relative to this restricted list of conformations, we show that unfavourable types are nearly once and a half as frequent as favourable types:54% versus 33%, 53% versus 39%, 47% versus 26% respectively for the
three gene sets aforementioned. Nonetheless, in vivo, the role of these various conformations might be minor with respect to the role of RNA binding proteins (translation enhancement through hampering the formation of some secondary structures, mRNA stabilization through masking of RNase E cleavage sites, for example).
5
Conclusion
Together with BACTRANS2, the software suite dedicated to translatability analysis allowed the first large-scale insight into translational potentialities coupled with potentially high transcription. Not only does the cross-genome analysis show similary trends for the 5’ UTR features studied in32 prokaryotic genomes;
the system implemented brings valuable insight into translatability associated with genes harbouring strong σ70 promoters and E. coli genes harbouring functional σ70 promoters. Both criteria related to
protection against secondary structure formation and translation signal accessibility show typical biases. Besides, regarding potential mRNA stabilization, PSP genes do not seem to be favoured over FP genes. Since no advantage can be shown for PSP genes over FP genes with respect to all criteria examined, we conclude that high translation potentiality is not obligatorily associated with high transcription po-tentiality. A more thorough analysis failed to identify a class of PSP genes for which all five translation criteria would be simultaneously optimal; moreover, a correlation analysis focusing on genes with a pu-tative strong promoter harbouring an UP element failed to exhibit evidence of potentially high translation (unpublished). In future work, it may be worth extending investigation to PSP genes associated with suboptimal SD sequences like AGGA, GGAG, or GAGG.
Acknowledgement
This work was supported by the CPER framework programme of the Region Pays de la Loire - Technolog-ical Innovations and Post-Genomics - and by the Genomics Network In Western France (Ouest-Genopole consortium, grant RNG-2004-054). Thanks are also due to V. Sakanyan for fruitful discussion.
References
Aiyar, S.E., Gaal T. and Gourse, R.L. (2002) rRNA promoter activity in the fast-growing bacterium Vibrio natriegens. J. Bacteriol.,
184(5), 1349–58.
Arnold, T.E., Yu, J. and Belasco, J.G. (1998) mRNA stabilization by the ompA 5’ untranslated region: two protective elements hinder distinct pathways for mRNA degradation. RNA, 4, 319–330.
Bechhofer, D.H. (1993). 5’ mRNA stabilizers. In Control of Messenger RNA Stability, Belasco, J.G. and Brawerman, G., Eds, San
Diego:Academic Press, 31–52.
Bechhofer, D.H. (1990) Triple post-transcriptional control. Mol. Microbiol., 4, 1419–23.
Belasco, J.G. and Brawerman, G., Eds. (1993) Control of messenger RNA stability. Academic Press, New York.
Bricker, A.L. and Belasco, J.G. (1999) Importance of a 5’ stem-loop for longevity of papA mRNA in Escherichia coli. J. Bacteriol., Jun, 181(11), 3587–3590.
Browning, D.F. and Busby, S.J. (2004) The regulation of bacterial transcription initiation. Nat. Rev. Microbiol., 2, 57–65.
Bulyk, M.L., McGuire, A.M., Masuda, N. and Church, G.M. (2004) A motif co-occurrence approach for genome-wide prediction of transcription-factor-binding sites in Escherichia coli. Genome Res., 14, 2, 201–208.
Carrier, T.A. and Keasling, J.D. (1999) Library of synthetic 5’ secondary structures to manipulate mRNA stability in Escherichia
coli. Biotechnol. Prog., Jan-Feb, 15(1), 58–64.
Carrier, T.A. and Keasling, J.D. (1997) Controlling messenger RNA stability in bacteria: strategies for engineering gene expression.
Biotechnol. Prog., 13, 699–708.
Cebe, R. and Geiser, M. (2006) Rapid and easy thermodynamic optimization of the 5’-end of mRNA dramatically increases the level of wild type protein expression in Escherichia coli. Protein Expr. Purif., Feb, 45(2), 374–380.
Chang, B., Halgamuge, S. and Tang, S.-L. (2006) Analysis of SD sequences in completed microbial genomes: non-SD-led genes are as common as SD-led genes. Gene, 373, 90–99.
Chelladurai, B.S., Li, H. and Nicholson, A.W. (1991) A conserved sequence element in ribonuclease III processing signals is not required for accurate in vitro enzymatic cleavage. Nucleic Acids Res., 19(8),1759–1766.
Cohen, S.N. and McDowall, K. (1997) RNase E: still a wonderfully mysterious enzyme. Mol. Microbiol., 23, 1099–1106.
Collado-Vides, J., Magasanik, B. and Gralla, J.D. (1991) Control site location and transcriptional regulation in Escherichia coli.
Microbiol. Rev., 55, 371–394.
Emory, S.A., Bouvet, P. and Belasco, J.G. (1992) A 5’-terminal stem-loop structure can stabilize mRNA in Escherichia coli. Genes
Dev., Jan, 6(1), 135–148.
Ehretsmann, C.P., Carpousis, A.J. and Krisch, H.M. (1992) Escherichia coli RNase E has a role in decay of bacteriophage T4 mRNA.
Genes and Dev., 6, 149–159.
Eskin, E., Gelfand, M. and Pevzner, P. (2003) Genome-wide analysis of bacterial promoter regions. Pacific symposium on
Biocom-puting, 8, 29–40.
Estrem, S.T, Gaal, T., Ross, W. and Gourse, R.L. (1998) Identification of an UP element consensus sequence for bacterial promoters.
Proc. Natl. Acad. Sci. USA, 95, 9761–9766, august.
Estrem, S.T., Ross, W., Gaal, T., Chen, Z.W., Niu, W., Ebright, R.H. and Gourse, R.L. (1999) Bacterial promoter architecture: subsite structure of UP elements and interactions with the carboxy-terminal domain of the RNA polymerase alpha subunit. Genes Dev., 13, 2134–2147.
Faubladier, M., Cam, K. and Bouch´e, J.-P. (1990) E. coli cell division inhibitor DicF RNA of the dicB operon. Evidence for its generation in vivo by transcription termination and by RNase III and RNase E dependent processing. J. Mol. Biol., 212, 461–471. Fenton, M.S., Lee, S.J. and Gralla, J.D. (2000) Escherichia coli promoter opening and -10 recognition: Mutational analysis of
sigma70. EMBO J., 19, 1130–1137.
Fredrick, K., Caramori T., Chen, Y.F., Galizzi, A. and Helmann, J.D. (1995) Promoter architecture in the flagellar regulon of Bacillus
subtilis: high-level expression of flagellin by the sigma δ RNA polymerase requires an upstream promoter element. Proc. Natl. Aca. Sci. USA, 92, 2582–86.
Ghora, B.K. and Apirion, D. (1978) Structural analysis and in vitro processing to p5rRNA of a 9S RNA molecule isolated from an
rne mutant of E. coli. Cell, 15, 1055–1066.
Gralla, J. and Collado-Vides, J. (1996) Organization and function of transcription regulatory elements. Escherichia coli and Salmonella,
Cellular and Molecular Biology (Neidhart,F.C., Curtiss,R., Ingraham,J., Lin,E.C.C., Low,K.B., Magasanik, B., et al., eds), Ameri-can Society for Microbiology, Washington, D.C., 57, 1232–1246.
Gross, C.A., Chan, C., Dombroski, A., Gruber, T., Sharp, M., Tupy, J., Young, B. (1998) The functional and regulatory roles of sigma factors in transcription. Cold Spring Harb. Symp. Quant. Biol., 63, 141–155.
Gross, C., Lonetto, M., Losick, R. (1992) Bacterial sigma factors. In McKnight, S.L. and Yamamoto, K.R. (Eds.), Transcriptional
Regulation, New York Cold Spring Harbor Laboratory Press, 129-–176.
Gross, G. (1991) RNase E cleavage in the atpE leader region of atpE/interferon-beta hybrid transcripts in Escherichia coli causes enhanced rates of mRNA decay. J. Biol. Chem., 266, 17880–177884.
Gruber, T.M. and Gross, C.A. (2003) Multiple sigma subunits and the partitioning of bacterial transcription space. Annu. Rev.
Microbiol., 57, 441–466.
Harley, C.B. and Reynolds, R.P. (1987) Analysis of E. coli promoter sequences. Nucleic Acids Res., 15, 2343–2361.
Hawley, D.K. and McClure, W.R. (1983) Compilation and analysis of Escherichia coli promoter DNA sequences. Nucleic Acids Res.,
25; 11(8), 2237–2255.
Herring, C.D., Raffaelle, M., Allen, T.E., Kanin, E.I., Landick, R., Ansari, A.Z. and Palsson, B.O. (2005) Immobilization of
Es-cherichia coli RNA polymerase and location of binding sites by use of chromatin immunoprecipitation and microarrays. J. Bacte-riol, 187, 6166–6174.
Hershberg, R., Bejerano, G., Santos-Zavaleta, A. and Margalit, H. (2001) PromEC: An updated database of Escherichia coli mRNA promoters with experimentally identified transcriptional start sites. Nucleic Acids Res., 29(1), 277.
Hofacker, I.L., Fontana, W., Stadler, P.F., Bonhoeffer, L.S., Tacker, M., and Schuster, P. (1994) Fast Folding and Comparison of RNA Secondary Structures. Monatsh. Chem., 125, 167–188.
Huerta, A.M. and Collado-Vides, J. (2003) Sigma70 promoters in Escherichia coli: specific transcription in dense regions of overlap-ping promoter-like signals. J. Mol. Biol., 17, 333(2), 261–278.
Huerta, A.M., Francino, M.P., Morett, E. and Collado-Vides, J. (2006) Selection for Unequal Densities of sigma70 Promoter-Like
Signals in Different Regions of Large Bacterial Genomes. PLoS Genet., 10; 2(11).
Krinke, L. and Wulff, D.L. (1990) The cleavage specificity of RNase III. Nucl. Acids Res., 18; 4809–4815.
Li, H., Rhodius, V., Gross, C. and Siggia, E.D. (2002) Identification of the binding sites of regulatory proteins in bacterial genomes.
Proc. Natl. Acad. Sci. USA, 99, 11772–11777.
Lundberg, U., von Gabain, A. and Melefors O. (1990) Cleavages in the 5’ region of the ompA and bla mRNA control stability: studies with an E. coli mutant altering mRNA stability and a novel endoribonuclease. Embo, 9, 2731–2741.
Lisser, S. and Margalit, H. (1993) Compilation of E. coli mRNA promoter sequences. Nucleic Acids Res., 21, 1507–1516.
Mackie, G.A. (1991) Specific endonucleolytic cleavage of the mRNA for ribosomal protein S20 of Escherichia coli requires the product of the ams gene in vivo and in vitro. J. Bacteriol., 173, 1488–1497.
Martinez-Antonio, A. and Collado-Vides, J. (2003) Identifying global regulators in transcriptional regulatory networks in bacteria.
Curr. Opin. Microbiol., 6, 482–489.
Mudd, E.A., Prentki, P., Belin, D. and Krisch, H.M. (1988) Processing of unstable bacteriophage T4 gene 32 mRNAs into a stable species requires E. coli ribonuclease E. EMBO J., 7, 3601–3607.
Nilsson, P. and Uhlin, B.E. (1991) Differential decay of a polycistronic Escherichia coli transcript is initiated by an RNaseE-dependent endonucleolytic processing. Mol. Microbiol., 5, 1791–1799.
Ma, J., Campbell, A. and Karlin, S. (2002) Correlation between Shine-Dalgarno sequence and gene features such as predicted expression levels and operon structure. J. Bacteriol., 184, 5733–5745.
Naureckiene, S. and Uhlin, B.E. (1996) In vitro analysis of mRNA processing by RNase E in the pap operon of Escherichia coli.
Mol. Microbiol., 21, 55–68.
Osada, Y., Saito, R. and Tomita, M. (1999) Analysis of base-pairing potentials between 16S rRNA and 5’ UTR for translation initiation in various prokaryotes. Bioinformatics, 15, 578–581. vspace1mm
Pager, M.S. and Helmann, J.D. (2003) The sigma 70 family of sigma factors. Genome Biol., 4, 203.1–203.6.
Qing, G., Xia, B. and Inouye, M. (2003) Enhancement of translation initiation by A/T-rich sequences downstream of the initiation codon in Escherichia coli. J. Mol. Microbiol. Biotechnol., 6(3-4), 133–144.
R´egnier, P. and Hajnsdorf, E. (1991) Decay of mRNA encoding ribosomal protein S15 of Escherichia coli is initiated by an RNase E-dependent endonucleolytic cleavage that removes the 3’ stabilizing stem and loop structure. J. Mol. Biol. , 217, 283–292. Rocha, E.P.C, Danchin, A. and Viari, A. (1999) Translation in Bacillus subtilis: roles and trends of initiation and termination, insights
Ross, W., Gosink, K.K., Salomon, J., Igarashi, K., Zou, C., Ishihama, A. et al (1993) A third recognition element in bacterial promoters: DNA binding by the alpha subunit of RNA polymerase. Science, 262, 1407–1413.
Roy, A., Glaser, P. and Danchin, A. (1988) Aspects of the regulation of adenylate cyclase synthesis in Escherichia coli K12 J. Gen.
Microbiol., 134(2), 359–367.
Sakanyan, V., Dekhtyar, M., Morin, A., Braun, F. and Modina, L. (2003) Method for the identification and isolation of strong bacterial promoters. European patent application, 3290203.3, january 27th.
Salgado, H., Gama-Castro, S., Peralta-Gil, M., Diaz-Peredo, E., Sanchez-Solano, F., Santos-Zavaleta, A., Martinez-Flores, I., Jimenez-Jacinto, V., Bonavides-Martinez, C., Segura-Salazar, J., Martinez-Antonio, A. and Collado-Vides, J. (2006) RegulonDB (version 5.0): Escherichia coli K-12 transcriptional regulatory network, operon organization, and growth conditions. Nucleic Acids
Res., Jan 1; 34 (Database issue): D394-7.
Sato, T., Terabe, M., Watanabe, H., Gojobori, T., Hori-Takemoto, C. and Miura, K. (2001) Codon and base biases after the initiation codon of the open reading frames in the Escherichia coli genome and their influence on the translation efficiency. Biochem., 129, 6, 851–860.
Savchenko, A., Weigel P., Dimova, D., Lecocq, M. and Sakanyan, V. (1998) The Bacillus stearothermophilus argCJBD operon harbours a strong promoter as evaluated in Escherichia coli cells. Gene, 212(5), 167–177.
Schneider, T.D., Stormo, G.D., Gold, L., Ehrenfeucht, A. (1986) Information content of binding sites on nucleotide sequences. J.
Mol. Biol., 188, 415–431.
Shultzaberger, R.K., Chen, Z., Lewis, K.A. and Schneider, T.D. (2007) Anatomy of Escherichia coli σ70 promoters. Nucleic Acids
Res., 35(3), 771–788.
Sinoquet, C., Demey, S. and Braun, F. (2007) A large-scale analysis for significance assessment of frequencies relative to potentially strong σ70 promoters - comparison of 32 prokaryotic genomes - Research Report, Computer Science Institute of Nantes-Atlantic
(Lina), Nantes-Atlantic Universities, hal-00153303.
Tomcsanyi, T. and Apirion, D. (1985) Processing enzyme ribonuclease E specifically cleaves RNA1 an inhibitor of primer formation in plasmid DNA synthesis. J. Mol. Biol., 185, 713–720.
Unniraman, S., Chatterji, M. and Nagaraja, V. (2002) A hairpin near the 5’ end stabilises the DNA gyrase mRNA in Mycobacterium
smegmatis. Nucleic Acids Res., 30(24), 5376–5381, dec.
Vellanoweth, R.L. and Rabinowitz, J.C. (1992) The influence of mRNA sequence on translation efficiency in Bacillus subtilis and
Escherichia coli. Mol. Microbiol., 6, 1105–1114.
Voges, D., Watzele, M., Nemetz, C., Wizemann, S. and Buchberger, B. (2004) Analysing and enhancing mRNA translation efficiency in an Escherichia coli in vitro expression system. Biochem. Biophys. Res. Commun., May 28, 318(2), 601–614.
Wuchty, S., Fontana, W., Hofacker, I.L. and Schuster, P. (1999) Complete Suboptimal Folding of RNA and the Stability of Secondary Structures. Biopolymers, 49, 145–165.
(a)
(b)
Figure 2: Example of annotations for Bacillus subtilis; (a) features describing the genes harbouring pu-tative strong σ70 promoters; (b) comparative positioning of transcription binding sites and translation
Figure 3: AT-richnesses in the regions flanking translation signals, for the genes harbouring putative strong σ70 promoters, in 32 prokaryotic genomes. SD and SC respectively refer to Shine-Dalgarno
se-quence and start codon. For each genome, the average AT-richness is computed over all genes harbouring putative strong promoters, considering the5 bp-long left and right regions flanking SD and SC. The
av-erage AT-richness in 5’UTRs is also computed over all such genes, for each genome. Whole genome AT-richness (WG) is compared with the three previous averages.
(a)
(b)
Figure 4: Interference between the translation signals and the mRNA 5’ terminal secondary structure for the genes harbouring putative strong σ70 promoters, in 32 prokaryotic genomes. Interference means
that the translation signal considered partially overlaps a stem or is totally contained in a stem. (a) interference with Shine-Dalgarno sequence: each class through SD0 to SD5 corresponds to the number
of nucleotides of the Shine-Dalgarno sequence which are involved in base-pairing. (b) interference with start codon: each class through SC0 to SC3 corresponds to the number of nucleotides of the start codon
Figure 5: Typical secondary structures identified in the mRNA 5’ terminal region, for genes harbouring putative strong σ70 promoters - comparison of average frequencies between 32 prokaryotic genomes.
The various conformations are described in Table 1. See Figure 2 for species nomenclature; E. coli FP genes: genes harbouring known functional promoters in E. coli genome; the top-down order in the legend reflects the frequency decrease through T3 to T 7; + and - symbols indicate the presumed favourable or
unfavourable influence on mRNA stability.
Figure 6: Nature of start codon for specific gene sets of Escherichia coli - Comparison between all3772
genes coding for m-RNAs,583 genes harbouring functional σ70 promoters and 255 genes harbouring
Figure 7: Distribution of AT-percentages relative to the 5’UTRs and the regions flanking translation signals, for specific gene sets of Escherichia coli - Comparison between583 genes harbouring functional σ70 promoters (FP genes) and 255 genes harbouring potentially strong σ70 promoters (PSP genes).
AT-richnesses relative to the regions flanking the start codon are also provided for the3772 genes encoding
Figure 8: Distribution of 5’UTR lengths, for specific gene sets of Escherichia coli - Comparison between
(a) (b)
(c)
Figure 9: Interference between the translation signals and the mRNA 5’ terminal secondary structure, for specific gene sets of Escherichia coli - Comparison between583 genes harbouring σ70 functional
promoters and255 genes harbouring putative strong σ70 promoters. Interference means that the
trans-lation signal considered partially overlaps or is totally contained in a stem. (a) interference with Shine-Dalgarno sequence: each class through SD0 to SD5 corresponds to the number of nucleotides of the
Shine-Dalgarno sequence which are involved in a stem. (b) interference with start codon: each class through SC0 to SC3 corresponds to the number of nucleotides of the start codon involved in a stem. (c)
The classes are labelled ¡#SD #CS¿, where #SD and #SC are the numbers of nucleotides in the Shine-Dalgarno sequence and the start codon respectively involved in a stem.