Article title : The microbiome of the leaf surface of Arabidopsis protects against a fungal pathogen Authors : Unyarat Ritpitakphong, Laurent Falquet, Artit Vimoltust, Antoine Berger, Jean-Pierre Métraux, Floriane L’Haridon
Supporting Information :
Fig. S1 The growth of B. cinerea on leaves of A. thaliana Col-0, bdg and lacs2.3 in sterile and non-sterile conditions determined by trypan blue staining. Representative pictures were taken 3 days after infection of Col-0, bdg and lacs2.3 in sterile and non-sterile conditions.
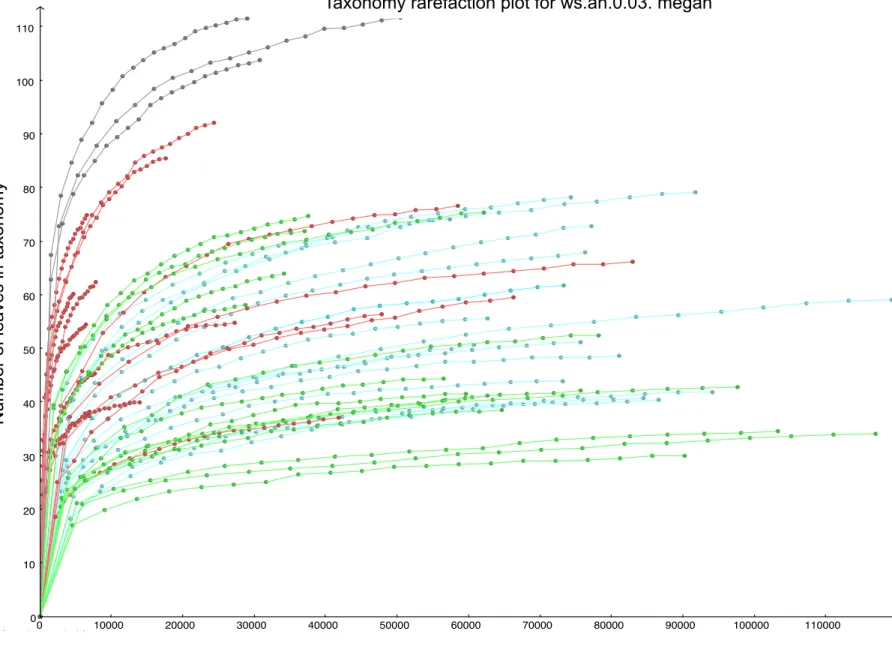
Fig. S2 Rarefaction curves. This figure shows that 41out of 48 samples reached the saturation with at least 30’000 contigs. Thus, at least 90% of the bacterial diversity was sampled.
Fig. S3 Top 20 most abundant genera in bdg and the relative abundance in A. thaliana Col-0 plants, lacs2-3 and soil samples compared to bdg.
Asterisks denote significant differences compared to bdg (n=15; error bars indicate variance within each respective group).
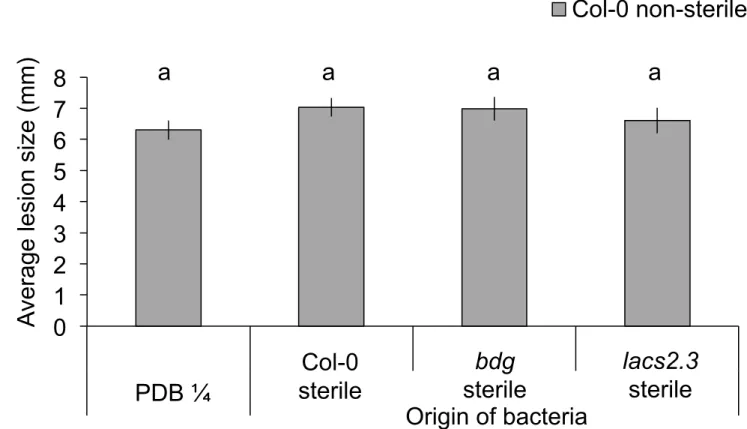
Fig. S4 Effect of surface washes of leaves from sterile A. thaliana Col-0 plants and cuticle mutants on the resistance of non-sterile Col-0 plants to B. cinerea.
The leaf surface from sterile Col-0, bdg and lacs2.3 were washed, mixed to B. cinerea and inoculated on WT Col-0 plants (n=48; ± SE). The average lesion size was determined 3 days after inoculation with B. cinerea. Different letters above each bar represent statistically significant differences (Tukey’s test; P<0,05). The experiment was repeated twice with similar results.
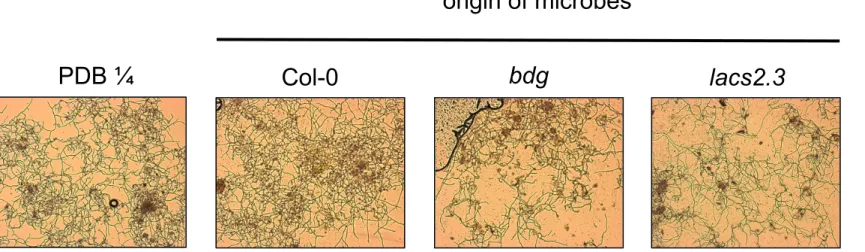
Fig. S5 The activity of phyllosphere microbes from A. thaliana Col-0, bdg and lacs2.3 on the spore germination of B. cinerea in vitro.
One representative picture of phyllosphere microbes from Col-0, bdg or lacs2.3 incubated with spores from B. cinerea is shown.
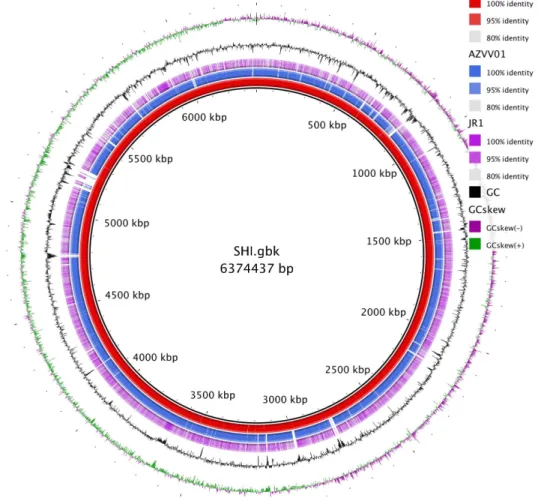
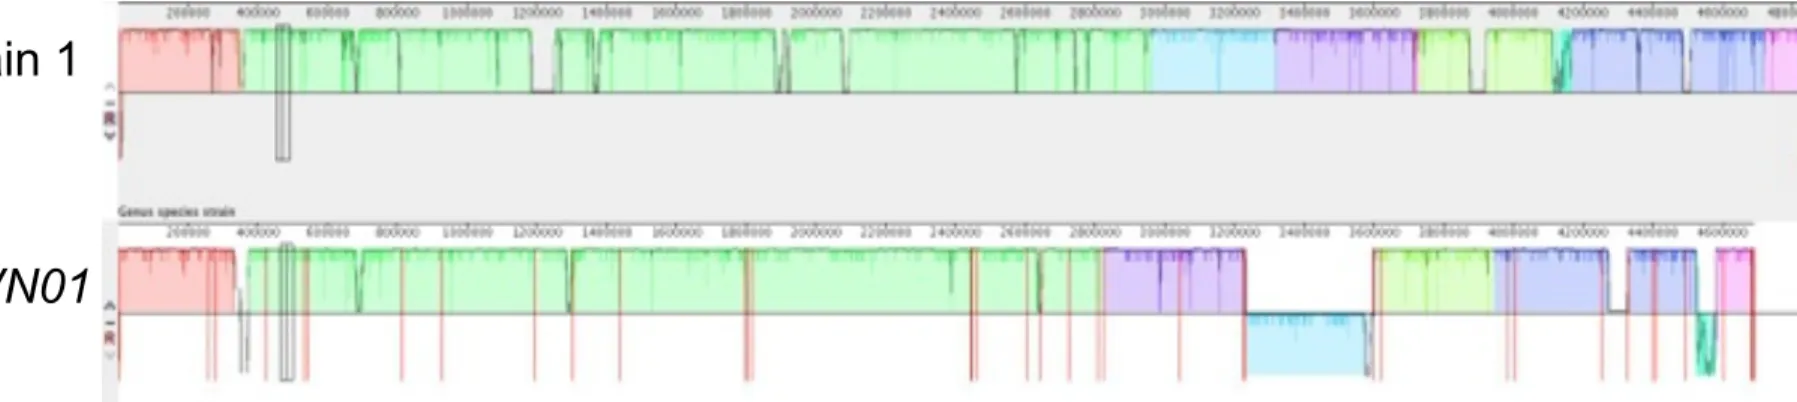
Fig. S6 Genome of strain 3 and strain 1 (a) Comparison of the genome of strain 3 with P. mandelii (JR-1) and P. sp. UMRO177WK12:I12 (AZVV01). (b) MAUVE comparison of the strain 3 vs AZVV01 the closest publicly available sequence (ANI=99.56%). The contigs of AZVV01 were ordered according to strain 3. The colors represent LCB (Locally collinear blocks) or segments apparently free of
rearrangements (Darling et al., 2010). (c) MAUVE comparison of the strain 1 vs P. sp.
UMRO177WK12:I11 (AZVN01) the closest publicly available sequence (ANI=99.59%). The contigs of AZVN01 were ordered according to strain 1. The colors represent LCB (Locally collinear blocks) or segments apparently free of rearrangements (Darling et al., 2010).
Fig. S7 Dose-dependent effect of strain 3 (P. sp. friburgensis) on the resistance of A. thaliana Col-0 plants to B. cinerea. Strain 3 was diluted in PDB ¼ at different concentrations (in CFU µl-1) then
mixed to B. cinerea and inoculated on WT Col-0 plants (n=48; ± SE). The average lesion size was determined 3 days after inoculation with B. cinerea. The concentrations are indicated below each histogram. Different letters above each bar represent statistically significant differences (Tukey’s test; P<0,05). The experiment was repeated twice with similar results.
Fig. S8 Effect of strain 3 (P. sp. friburgensis) on the resistance of sterile A. thaliana Col-0 plants and cuticle mutants to B. cinerea.
Strain 3 was diluted in PDB ¼ at different concentrations (in CFU µl-1) then mixed with B. cinerea and inoculated on sterile Col-0, bdg and lacs2.3 plants (n=54; ± SE). The average lesion size was
determined 3 days after inoculation with B. cinerea. The concentrations used are indicated below each histogram. Different letters above each bar represent statistically significant differences (Tukey’s test; P<0,05). The experiment was repeated twice with similar results.
Fig. S9 Effect of boiled strain 3 (P. sp. friburgensis) on the resistance of A. thaliana Col-0 plants to B. cinerea.
Strain 3 was diluted in PDB ¼ at different concentrations (in CFU µl-1) then boiled 25 min at 100°C and finally mixed with B. cinerea spores and inoculated on WT Col-0 plants. The results were compared with the non-boiled strain 3 (n=48; ± SE). The average lesion size was determined 3 days after
inoculation with B. cinerea. The concentrations are indicated below each histogram. Different letters above each bar represent statistically significant differences (Tukey’s test; P<0,05). The experiment was repeated twice with similar results.
Fig. S10 Effect of strain 3 (P. sp. friburgensis) on the resistance of A. thaliana Col-0 plants and SA-, JA- and ET- signalling mutants to B. cinerea.
Strain 3 was diluted in PDB ¼ at different concentrations (in CFU µl-1) then mixed to B. cinerea and inoculated on Col-0 plants, SA mutant (sid2), JA mutants (jar1, dde2.2) and ET mutants (ein2, etr1) (n=48; ± SE). The average lesion size was determined 3 days after inoculation with B. cinerea. The concentrations used are indicated below each histogram. Col-0 and each mutant treated with strain 3 were compared with their corresponding control (Ctrl) inoculated with B. cinerea. Asterisks above each bar represent statistically significant differences (Tukey’s test; P<0,05). The experiment was carried out two times with similar results.
Fig. S11 Effect of strain 3 (P. sp. friburgensis) on the resistance of A. thaliana Col-0 plants and PAMP receptor mutants to B. cinerea.
Strain 3 was diluted in PDB ¼ at different concentrations (in CFU µl-1) then mixed to B. cinerea and inoculated on Col-0 plants, efr and fls2 mutants (n=48; ± SE). The average lesion size was determined 3 days after inoculation with B. cinerea. The concentrations used are indicated below each histogram. Col-0 and each mutant treated with strain 3 were compared with its own control (Ctrl) inoculated with B. cinerea and asterisks above each bar represent statistically significant differences (Tukey’s test; P<0,05). The experiment was carried out two times with similar results.
Fig. S12 Average of colony forming units (CFU) cm-2 extracted from the phyllosphere of A.
thaliana Col-0 plants and cuticle mutants.
Extracts of washed leaf surfaces from Col-0, bdg and lacs2.3 were spread on LB agar plate during 24h at 28°C. The colonies were counted and the average was determined on 10 independent
experiments (n=10; ± SD). Different letters above each bar represent statistically significant differences (Tukey’s test; P<0,05).
Fig. S13 Effect of strain 3 (P. sp. friburgensis) on the resistance of apple fruit to B. cinerea. The disinfected apple fruits were wounded and inoculated with strain 3 diluted in PDB ¼ at 95 CFU µl-1 mixed to B. cinerea and compared to apple fruits inoculated with B. cinerea at 5 x 10⁴ sp ml-1 in PDB ¼ (n=48; ± SE). The average lesion size was determined 3 days after inoculation with B. cinerea. The asterisk represents a statistically significant difference (t-test; P<0,05). The experiment was carried out two times with similar results.
Col-0 bdg lacs2.3
Non-sterile
Sterile
Col-0 bdg lacs2.3
Fig. S1 The growth of B. cinerea on leaves of A. thaliana Col-0, bdg and lacs2.3 in sterile and non-sterile conditions determined by trypan blue staining
Taxonomy rarefaction plot for ws.an.0.03.megan
0 10000 20000 30000 40000 50000 60000 70000 80000 90000 100000 110000 Number of reads sampled from leaves
0 10 20 30 40 50 60 70 80 90 100 110
Number of leaves in taxonomy
Fig. S2 Rarefaction curves
Number of reads sampled from leaves
N umb er of le ave s in ta xo no my
Taxonomy rarefaction plot for ws.an.0.03. megan
0% 5% 10% 15% 20% 25% 30% 35% 40% bdg lacs2 col0 soil bdg lacs2.3 Col-0 Soil R el . a bu nd an ce (% ) *
*
**
* * ** ** * * * * * * * ** * * ** ** * *Fig. S3 Top 20 most abundant genera in bdg and the relative abundance in A. thaliana Col-0 plants, lacs2-3 and soil samples compared to bdg
0 1 2 3 4 5 6 7 8 Col0 bdg lacs2.3 PDB Sterile PDB ¼ Col-0 sterile bdg sterile lacs2.3 sterile A ve ra ge le si on si ze (mm) Col-0 non-sterile Origin of bacteria a a a a
Fig. S4 Effect of surface washes of leaves from sterile A. thaliana Col-0 plants and cuticle mutants on the resistance of non-sterile Col-0 plants to B. cinerea
PDB ¼ Col-0 bdg lacs2.3
origin of microbes
Fig. S5 The activity of phyllosphere microbes from A. thaliana Col-0, bdg and lacs2.3 on the spore germination of B. cinerea in vitro
Strain 3 P. mandelii JR-1 Strain 3 AZVV01 AZVV01 Strain 3
Fig. S6 Genome of strain 3 and strain 1
a
Fig. S6 Genome of strain 3 and strain 1
c
Strain 1
0 1 2 3 4 5 6 7 PDB S70 S40 S15 S5 S1 A ve ra ge le si on si ze (mm) 70 40 15 5 1 PDB¼
Concentration of strain 3 (CFU µl-1)
Col-0 non-sterile a b c cd de e
Fig. S7 Dose-dependent effect of strain 3 (P. sp. friburgensis) on the resistance of A. thaliana Col-0 plants to B. cinerea
0 1 2 3 4 5 6 7 8
col-0 bdg lacs col-0 bdg lacs col-0 bdg lacs
PDB s1000 s500
Col-0 bdg lacs Col-0 bdg lacs Col-0 bdg lacs
PDB ¼ 0 Strain 3 45 20 CFU µl-1 A ve ra ge le si on si ze (mm)
Sterile Sterile Sterile
b a c c cd d e e e
Fig. S8 Effect of strain 3 (P. sp. friburgensis) on the resistance of sterile A. thaliana Col-0 plants and cuticle mutants to B. cinerea
0 1 2 3 4 5 6 7 8 PDB 1/4 S40 S20 S10 PDB 1/4 S10 S20 S40 PDB ¼ PDB ¼ Boiled
Strain 3 Strain 3 Boiled
A ve ra ge le si on si ze (mm) 0 40 20 10 0 0 Col-0 non-sterile a a a a a b b c CFU µl-1
Fig. S9 Effect of boiled strain 3 (P. sp. friburgensis) on the resistance of A. thaliana Col-0 plants to B. cinerea
0 2 4 6 8 10 12 14 16 Ctrl 40 20 10 Ctrl 40 20 10 Ctrl 40 20 10 Ctrl 40 20 10 Ctrl 40 20 10 Ctrl 40 20 10
Col0 sid2 jar1 dde2.2 ein2 etr1
A ve ra ge le si on si ze (mm)
Col-0 sid2 jar1 dde2.2 ein2 etr1
Strain 3 CFU µl-1 Strain 3 CFU µl-1 Strain 3 CFU µl-1 Strain 3 CFU µl-1 Strain 3 CFU µl-1 Strain 3 CFU µl-1
*
*
*
*
*
*
*
*
*
*
* *
*
*
*
*
* *
Fig. S10 Effect of strain 3 (P. sp. friburgensis) on the resistance of A. thaliana Col-0 plants and SA-, JA- and ET- signalling mutants to B. cinerea
0 2 4 6 8 10 12 Crtl 47 23 10 Crtl 47 23 10 Crtl 47 23 10
Col0 Strain 3 efr fls2
CFU µl-1 CFU µlStrain 3 -1
Strain 3 CFU µl-1 Col-0 efr fls2 A ve ra ge le si on si ze (mm)
*
*
*
*
*
*
*
*
*
Ctrl Ctrl CtrlFig. S11 Effect of strain 3 (P. sp. friburgensis) on the resistance of A. thaliana Col-0 plants and PAMP receptor mutants to B. cinerea
0 500 1000 1500 2000 2500 3000 3500 4000 Col0 bdg lacs2.3 A ve ra ge o f C F U cm -2 of leaf Col-0 bdg lacs2.3 a ab b
Fig. S12 Average of colony forming units (CFU) cm-2 extracted from the phyllosphere of A.
0 1 2 3 4 5 6 7 8 9 PDB 95 PDB¼ Strain 3 A ve ra ge le si on si ze (mm)