25 January 2019
AperTO - Archivio Istituzionale Open Access dell'Università di Torino
Pollution parameters and identification of performance indicators for wastewater treatment plant of medea (Algeria) /
Karef, Salah; Kettab, Ahmed; Loudyi, Dalila; Bruzzoniti, Maria C.; Del Bubba, Massimo; Nouh, Fatima Ait; Boujelben,
Nesrine; Mandi, Laila. - In: DESALINATION AND WATER TREATMENT. - ISSN 1944-3994. - 65(2017), pp. 192-198.
Original Citation:
Pollution parameters and identification of performance indicators for wastewater treatment plant of medea (Algeria)
Published version:
DOI:10.5004/dwt.2017.20290
Terms of use:
Open Access
(Article begins on next page)
Anyone can freely access the full text of works made available as "Open Access". Works made available under a
Creative Commons license can be used according to the terms and conditions of said license. Use of all other works
requires consent of the right holder (author or publisher) if not exempted from copyright protection by the applicable law.
Availability:
This is the author's manuscript
This full text was downloaded from iris - AperTO: https://iris.unito.it/
iris - AperTO
University of Turin’s Institutional Research Information System and Open Access Institutional Repository
This is the author's final version of the contribution published as:
Karef, Salah; Kettab, Ahmed; Loudyi, Dalila; Bruzzoniti, Maria C.; Del
Bubba, Massimo; Nouh, Fatima Ait; Boujelben, Nesrine; Mandi, Laila.
Pollution parameters and identification of performance indicators for
wastewater treatment plant of medea (Algeria). DESALINATION AND
WATER TREATMENT. 65 pp: 192-198.
DOI: 10.5004/dwt.2017.20290
The publisher's version is available at:
http://www.deswater.com/home.php
When citing, please refer to the published version.
Link to this full text:
Pollution parameters and identification of performance indicators
for wastewater treatment plant of Medea (Algeria)
Salah Karef
a,*, Ahmed Kettab
a, Dalila Loudyi
b, Maria C. Bruzzoniti
c, Massimo Del Bubba
d,
Fatima Ait Nouh
e, Nesrine Boujelben
f, Laila Mandi
eaLaboratoire de Recherche des Sciences de l’Eau, Ecole Nationale Polytechnique d’Alger, 10, Av Hacene Badi, PB 182, El-Harrach, Algiers, Algeria, Tel. +213 560 351 508; emails: [email protected] (S. Karef), [email protected] (A. Kettab) bWater and Environmental Engineering, University Hassan II of Casablanca, B.P. 146, Mohammedia, 20650, Morocco, email: [email protected]
cDepartment of Analytical Chemistry, University of Torino, Via P. Giuria 5, 10125 Torino, Italy, email: [email protected] dDepartment of Chemistry, University of Florence, Via della Lastruccia, 3, 50019 Sesto Fiorentino, Florence, Italy,
email: [email protected]
eNational Centre for Studies and Research on Water and Energy (CNEREE), University Cadi Ayyad, Avenue Moulay Abdellah, BP 511, 40000 Marrakech, Morocco, email: [email protected]
fWater Energy Environment Laboratory, Department of Engineering Geology, National Engineering School of Sfax, BP W 3038 Sfax, Tunisia, email: [email protected]
* Corresponding author. ABSTRACT
The sanitation system in Algeria requires a mastery of the functioning of the collection network and treatment using performance indicators that identify gaps and to develop solutions for better waste- water management. This work aims to identify the performance indicators that are chosen on the basis of the problems often encountered. The referred performances concern the problems related to clear parasites waters and some that highlight the phenomena of sedimentation-erosion in the net- work of Medea city. For the WWTP, we are interested in the plant hydraulic and treatment capacity, the bacterial metabolism, the treatment yield, the correlations between pollution parameters and the energy consumption. The results showed that the dilution rate of wastewater, which is caused by the clear parasites waters, requires significant care at the sewerage network. The imbalance into nutrients relating to bacterial metabolism can be an obstacle at the level of biological treatment. For high ratios
TSS/COD and TSS/BOD5 that translate a pollution at particulate character, a quantitative study would be required in
particular to evaluate the influence of collection networks on the quality of domestic sewage. The high values of the electrical energy necessary for the elimination of recorded pollution require to perform a diagnostic analysis on the installation.
Keywords: Sanitation network; Treatment plant; Performance indicators; Ratios; Optimization; Medea
Introduction
Despite the magnitude of the spin-offs, which are gen- erated by wastewater on the degradation of the environ- mental medium, on water scarcity and consequently on
public health, according to [1], in Algeria, little importance is given to sanitation services compared with drinking water ones. The sanitation problems remain a major concern that requires significant care by taking appropriate measures to protect the environment [2]. According to [3], the manage- ment of sanitation systems has to face several facts such as
physical degradation of infrastructure due to its aging, lack of maintenance and pollution of natural environments by increasingly disturbing direct and indirect discharges from urban sanitation.
The nature of our networks, their designs and urban extensions have increased the flood risk making our sanita- tion networks insufficient and unable to follow urbanization. Moreover, the overall volume of treated water according to
[4] represents only 19% of the collected volume of wastewater. This situation inquires more research to improve perfor- mances by locating the failures in sanitation system through research of performance indicators that can be used to ana- lyze the sustainability of sanitation service. The establish- ment of these performance indicators therefore constitutes an assistance tool at the enhanced management of treatment plants and sewage collection systems.
In this context of sanitation system control, we sought to obtain and valorize the maximum available data concerning hydraulics and monitoring of the main physico-chemical pollution parameters. The results should detect gaps and propose technical solutions for better management and improvement of the evacuation and treatment yield of sew- age facilities of Medea city.
Materials and methods
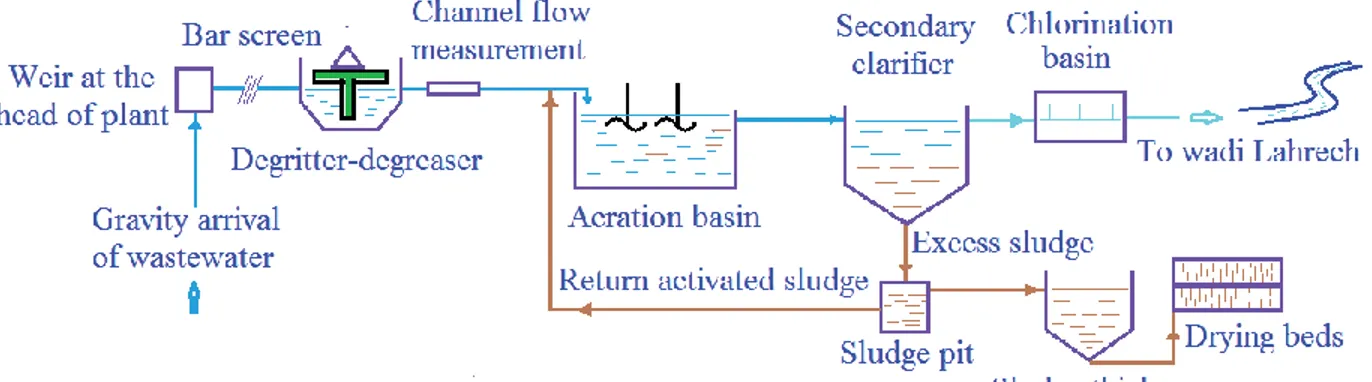
Implemented and commissioned in April 2007, the wastewater treatment plant (WWTP) is located in the south of the Medea city; it is designed to treat wastewater of this city and its surroundings. This wastewater flows by gravity to the station (Fig. 1) by a single collector as the sewerage
system is unitary. It operates with low mass load according to an extended aeration process [5].
This plant treats the resulting pollution of an equiv- alent population of 162,500. The sanitation network is of a total linear of 243.19 Km, with a connection rate of 99%. The city sewage system is divided into two parts northern and southern, and only the southern part is connected to the WWTP. The daily wastewater volume arriving to the WWTP
is 10,723 m3/d that represents 41% of the nominal capacity of
the WWTP that is 26,000 m3/d.
The treatment system comprises successively the follow- ing operations: pre-treatment, biological treatment, a chlo- rine station, thickening, then sludge drying [5].
In the framework of this work, we have proceeded to the control and monitoring of various measured and ana- lyzed parameters of the raw and treated water of Medea city WWTP, during the period January 2013-November 2015.
The water analyses were made at the laboratory of WWTP. The different measured parameters, the used meth- ods and equipment are given in Table 1.
Experimental results and interpretations
Evolution of the hydraulic load and share of clear parasitic waters
The treatment plant of Medea was designed for a nomi-
nal flow of 26,000 m3/d. The overruns of recorded flows are
given in the Table 2.
The excess in flow represents the share of clear parasites waters (CPW) that have increased significantly during the
Fig. 1. Schematic representation of the WWTP of Medea. Table 1
Material and analytical methods
Parameter Analysis method Material used
Total suspended solids (TSS) Filtration-centrifugation Centrifuge Hermle Z300 - oven at 105°C
COD Oxidation by K2Cr2O7 Heating block Brand Behr Labor Technik
BOD5 Respirometric Flasks OxiTop IS12, WTW-Enclosure 20°C
TKN Kjeldahl Digester-distiller/Buchi
NH4+ Spectrometric ISO 7150-1 Spectrophotometer HACH DR/4000 V
NO3– Spectrometric ISO 7890-3 Spectrophotometer HACH DR/4000 V
rainy season (September, October and December). According to [6], the CPW (drainage water, fountains, cooling, etc.) also overload unnecessarily the network collectors. They dilute the wastewater before treatment. They can cause the increase of upstream rejection into the network, involving an increase in operating costs of WWTP and preventing the achievement of required performance.
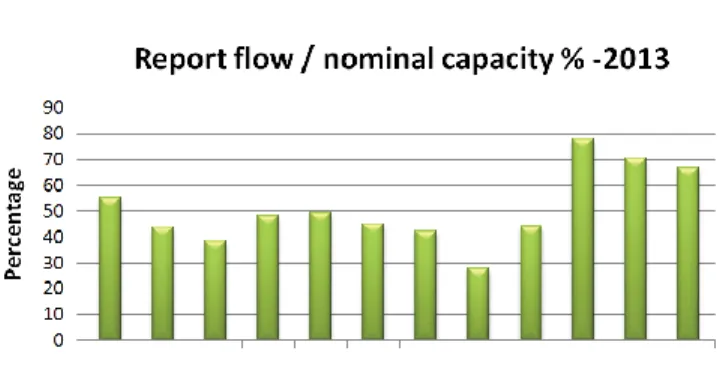
The average flow is 51% of the nominal capacity (Fig. 2), but we met a flow excess for some days in September, October and December 2013. As long as the nominal capacity is not Table 2
Maximum flows recorded
Period Flow max Overruns/nominal
(m3/d) flow, % (26,000 m3/d)
September 2013 26,280 1.1
October 2013 33,540 29
December 2013 27,000 3.84
Fig. 2. Report of the flow relative to the nominal capacity - 2013.
reached, such peak loads should be absorbed by the WWTP without any problem.
The share of CPW is calculated by evaluating the effect
of dilution of wastewater by clear waters on the BOD5
parameter compared with theoretical undiluted wastewater [6] with an inhabitant equivalent (IE) corresponding to
a daily pollution load of 60 g of BOD5 and 150 l/d of con-
sumed water [7].
We proceed as follows (see Table 3):
Raw water is designated by (1); incoming load in kg
BOD5/d, designated by (2); incoming load in IE, designated
by (3); theoretical undiluted wastewater volume, designated by (4); CPW volume designated by (5); and dilution rate designated by (6). We will have: (3) = (2) X 1,000/60 (4) = (3) X 150/1,000 = (2) X (1,000/60) X (150/1,000) = (2) X 150/60 = (2) X 2.5 (5) = (1) - (4) = (1) - 2.5 (2)
Hence, we shall have an equation of the form as follows:
Y = a – bX
where Y is the daily volume of CPW; a is the daily volume of wastewater; b = 150/60 = 2.5; and X is the incoming load in
kg BOD5/d.
We note a generally higher rate of dilution during the rainy events.
The CPW volume is estimated from BOD5
concentra-tions at the inlet of WWTP. The CPW (BOD5) is given by the
Table 3
Calculation and evolution of the dilution rate
Date Raw water, Incoming load, Incoming load Theoretical undiluted Clear parasite Dilution rate,
m3/d Kg BOD
5/d (IE) 1IE = 60 g BOD5/d wastewater, m
3/d With water, m3/d % (1) (2) (3) 150l/IE/d (4) (5) (6) Jan. 6, 2015 13,380 4,282 71,360 10,704 2,676 25 Feb. 10, 2015 17,250 3,795 63,250 9,488 7,763 82 Feb. 18, 2015 16,400 3,280 54,667 8,200 8,200 100 Mar. 8, 2015 10,240 2,355 39,253 5,888 4,352 74 Apr. 1, 2015 5,360 1,179 19,653 2,948 2,412 82 May 25, 2015 10,540 2,108 35,133 5,270 5,270 100 June 21, 2015 8,750 1,838 30,625 4,594 4,156 90 July 19, 2015 4,350 348 5,800 870 3,480 400 July 21, 2015 5,240 603 10,043 1,507 3,734 248 July 28, 2015 7,380 886 14,760 2,214 5,166 233 Sep. 8, 2015 6,810 953 15,890 2,384 4,427 186 Sep. 14, 2015 6,090 1,035 17,255 2,588 3,502 135 Sep. 16, 2015 6,800 476 7,933 1,190 5,610 471 Sep. 21, 2015 7,520 1,429 23,813 3,572 3,948 111 Oct. 13, 2015 11,520 2,189 36,480 5,472 6,048 111 Nov. 2, 2015 11,480 2,640 44,007 6,601 4,879 74
5
equation of the form Y = a – bX, which confirms that less lower measured concentrations are, the more important the share of CPW is.
The estimate of the average share of CWP for the study period from January 2013 to November 2015, with a daily
average volume of 10,723 m3/d and an BOD average con-
centration of 352.33 mg/l, leading to an average daily load
BOD5 of 3,778 kg/d, is estimated from the equation Y = a – bX.
Therefore, we will have Y = 10,723 - 2.5 X 3,778 = 1,278 m3/d,
representing 14% of the volume of the theoretical undiluted
wastewater found of 9,445 m3/d.
Treatment performance obtained
Monitoring of nitrogen treatment (see Table 4)
Total Kjeldahl nitrogen (TKN) is the most representative parameter of the wastewater collection [8]. The average con- centrations of Kjeldahl nitrogen at the inlet and outlet WWTP are, respectively, 55.5 and 5.20 mg/l; therefore, the abatement is 91%.
The average concentrations of ammonia NH4-N var- ies
from 29.36 to 3.46 mg/l from the inlet to the outlet.
However, the nitrate concentrations NO3-N at the inlet
vary between 0.01 and 2.25 mg/l with an average of 0.59 mg/l. Their contents at the outlet vary between 0.02 and 27.11 mg/l with an average of 10.61 mg/l. Therefore, an increase of 1,698%, from the inlet to the outlet, which is due to nitrification.
We can consider that the nitrification only works well if the concentration of ammonia nitrogen in the treated
water is less than 1 mg NH4-N/l, conversely, if the con-
centration of nitrate nitrogen in the treated water exceeds,
in dry weather, 3-5 mg NO3-N/l [9]. The increase in the
daily duration of aeration helps to speed up the resto- ration of good nitrogen processing performance, but it is not imperative for the viability of nitrification [10]. For the Medea WWTP, it is necessary to reduce the daily duration of aeration.
Table 4
Results of the nitrogen from inlet to the outlet of the WWTP (Jan. 2013-Nov. 2015)
Parameters Average Max. Min.
Monitoring of phosphorus treatment
At the intake to the WWTP, phosphates oscillate between 0.73 and 7.85 mg/l with an average of 2.29 mg/l. At the outlet, the average residual content of orthophosphate is 0.63 mg/l.
These values are very high compared with the tolerable limit of 0.1 mg/l total phosphorus for the discharge of efflu- ent into a sensitive medium at eutrophication [11]. However, they are lower than 10 mg/l; in ortho-phosphates, this limit being acceptable for a direct discharge into the receiving environment [12]. The level of phosphorus elimination is unstable and weak with an elimination average yield of 72%.
Nutritional balance
The bacterial metabolism is accompanied by nitrogen needs in the form of ammoniacal nitrogen, and phosphorus needs in the form of orthophosphates, in the following pro-
portions BOD5/NH4-N/PO4-P: 100/5/1 [13].
For an average BOD5 of 352.33 mg/l (see Table 5) and
for respecting that theoretical ratio, the concentrations of
NH4-N and PO4-P must be, respectively, 17.61 and 3.52 mg/l.
However, the average values recorded (29.36 mg/l NH4-N
and 2.29 mg/l PO4-P) indicate a deficit of 35% for PO4–P and
an increase of 67% for NH4-N relative to the respective the-
oretical ratios. This imbalance in nutrients can constitute a handicap at the level of biological treatment.
Monitoring of organic loads treatment ( Table 5)
The TSS represents 109% of the nominal value (Fig. 3), with a frequency of excess of 63% and an abatement yield of 95.35%.
The BOD5 is equal to 104% of the nominal value (Fig. 3)
and records an exceedance frequency of 62% and a 96.31% removal efficiency.
NO3-N mg/l 0.59 10.61 2.25 27.11 0.01 0.02
Fig. 3. Variations of flow and % exceeding of BOD5
relative to the nominal capacity.
and TSS
Table 5
Results of global parameters of raw and treated wastewater (Jan. 2013-Nov. 2015)
Parameters Average Max. Min. Nominal value
Inlet Outlet Inlet Outlet Inlet Outlet
TSS mg/l 479.44 22.31 733.71 175.11 211 6.57 438
COD mg/l 624.97 55.10 846.16 290 351.09 31.20 675
BOD5 mg/l 352.33 13 548.67 150 206.25 2.67 338
Inlet Outlet Inlet Outlet Inlet Outlet
TKN mg/l 55.5 5.20 75 11 37 3.70
The COD yield removal is 91%. This is a sharp reduc- tion of the COD, which according to [14] is related to a bet- ter oxygenation that enables aerobic bacteria to proliferate and to assure accordingly, better mineralization or oxidation of the organic matter. The maximum value (846.16 mg/l) is increasing by 35% compared with the average concentration (624.97 mg/l).
In 2015, the annual average load of BOD5 at the inlet of
WWTP is 971 tons and represents 71% of the annual average load recorded in 2014 (1,371 tons). But at the outlet, the load flow discharged into the watercourse during 2015 is 32 tons
of BOD5, representing 50% of the load dismissed in 2014,
which was 64 tons. The BOD5 load decrease from 71% to 50%
from the inlet to the outlet of the year 2015 compared with 2014, because of the removal efficiency of 96.18% in 2015, which increased by 1.65% relative to 94.38% recorded in 2014.
Ratios
The use of these characterization parameters is a good means to give a picture of the raw effluent pollution degree and also to optimize the physico-chemical parameters of the wastewater in order to propose a suitable mode of treatment. The values of different ratios are given in Table 6.
COD/BOD5 (raw water): The biodegradability coefficient
by [16]. Therefore, here again this effluent is biodegradable and confirms that these waters are loaded with organic mat- ter (56%) and inorganic matter (44%). According to [17], this organic load makes this wastewater rather unstable, i.e., it quickly evolves toward "digested" forms with the risk of odors release.
COD/TKN: Equal to 11.26 and according to [18], for a strict urban effluent, this ratio is between 8.8 and 12, and indicates the mixity of the effluent and has an influence on the denitrification. In the case of a wastewater with a low COD/TKN ratio, organic carbon content of the digested effluent may be insufficient to achieve complete denitrifica- tion [19]. But too high COD/TKN ratios risk also to disturb the nitrification because COD/TKN has a direct effect on the autotrophic biomass concentration of sludge and thus on the maximum speed of nitrification [10].
NH4/TKN: This ratio will indicate the degree of ammoni-
fication realized during the transfer of the effluent in the net- work [18]. The nitrogen is found in sewage network under its two reduced forms (organic and ammoniacal). The transit through the network modifies their proportions in favor of the ammoniacal form. According the dwell time and tem- perature, the proportion of ammoniacal nitrogen at the inlet of the treatment plant varies between 50% (short networks) and 75% (very long networks) [9]. Therefore, a ratio value NH /NTK found of 0.53 translates a flow of the raw water
is calculated by the ratio COD/BOD5 and depends on the
nature and origin of the wastewater, which may be domes- tic or industrial, and requires different treatments according
to [15]. The ratio COD/BOD5 for raw wastewater is generally
between 1.25 and 2.5. When the ratio COD/BOD5 is between
3 and 7, wastewater can be hardly biodegradable. This ratio was found of 1.77, which is characteristic of a domestic efflu- ent. A value less than 2 confirms the biodegradability of the wastewater. Therefore, the biological treatment is adequate for these effluents.
COD/BOD5 (treated water), found 4.24, shows a decrease
in the share of oxidizable organic matter during the treat- ment process.
BOD5/COD: This ratio gives very interesting indication
about the origin of pollution and its treatment possibilities
[16]. The report BOD5/COD of 0.56 is higher than 0.40 found
Table 6
Relation between the pollution parameters
4
through a network relatively short.
NH4/COD: This ratio is of 0.05 and is lower than the value
of 0.1 found by [20] that can be considered as characteristic of domestic wastewater.
TSS/COD: The average value recommended by the authors is 0.5 [7,21]. The found value of this ratio, 0.77, is high. Reference [20] showed that the increased TSS/COD ratio is an index that allows us to suspect a phenomenon of resuspension of deposits (phenomena of sedimentation- erosion during transport into network).
TSS/BOD5: According to [22], the classical value for
domestic wastewater of this ratio is between 0.8 and 1.2 and informs on the production of sludge, "natural" frac- tion brought by the TSS already present in the raw water. It indicates the apportionment of particulate pollution and dis-solved pollution. The average value of 1.36 indicates that the pollution is more granular than dissolved that characterizes an essentially unitary network. This value is comparable with
the ratio TSS/BOD5 found of 1.84 by [16]. The recorded
tions between 0.8 and 2.22 can be attributed to the
phenome-5 5 4 5 RATIO TSS/BOD5 Average 1.36 Max. 2.22 Min. 0.8
non of sedimentation-erosion within the network.
BOD5/TKN: For a strict urban effluent, this ratio varies
COD/TSS 1.3 2.07 0.87 between 4 and 5. It indicates the relative mixity of the
efflu-TSS/COD 0.77 1.15 0.48 ent and has an impact on the dimensioning of the biological
COD/BOD (raw water) 1.77 2.25 1.52 reactor in case of treatment of nitrogen (nitrification) [18].A value found of 6.34 is slightly higher than those usually
COD/BOD5 (treated water) 4.24 14.4 1.63 encountered (4-5).
BOD5/COD 0.56 0.66 0.44 BOD /TSS: This ratio found 0.73, comparable with 0.75
BOD5/TKN 6.34 9.89 3.72 found by [20]. The extreme values of this ratio vary between
BOD5/TSS 0.73 1.24 0.45 0.45 and 1.24, and are attributable to the
sedimentation-NH /TKN 0.53 0.85 0.12 erosion phenomenon in the network. It is therefore important
TKN/BOD5 0.16 0.27 0.10 to retain that, at some sludge age, the applicable maximum
COD/TKN 11.26 15.25 6.33 mass load depends on the BOD /TSS ratio of the input forwhich an average value of 1.0 is generally retained for urban
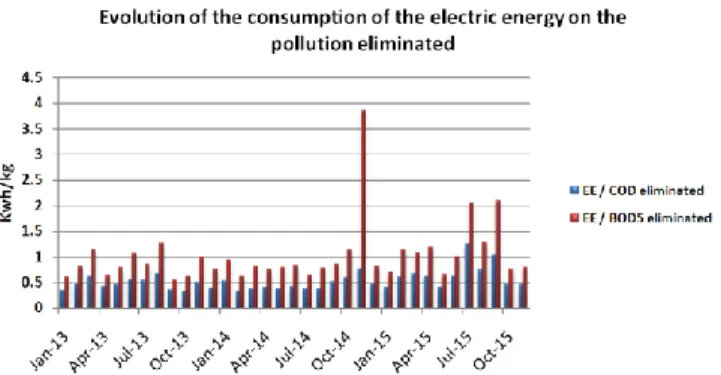
Fig. 4. Variations of reports: EE/BOD5
eliminated.
eliminated and EE/COD
WWTP without any problem. The dilution rate of wastewa- ter found of 14% caused by the CPW that may bring about malfunction of structures requires significant care and a permanent diagnosis of sewerage network of the Medea city. The reinjection of this CPW to the natural environment should be privileged wherever it is possible, upstream of the WWTP and at the level of storm overflows to improve the sewerage system performance and reduce the cost of exploitation. Good management of WWTP must go in the future through better knowledge and control of the water evacuation network.
For the treatment monitoring of pollution parameters, the
removal yields of TSS, COD and BOD5, respectively, 95.35%,
96.31% and 91% reflect the efficiency of treatment applied to the WWTP although we recorded exceedances average con-
centration of COD and BOD5, which are, respectively, 109%
COD/TSS: This ratio varies from 0.87 to 2.07 with an aver- age of 1.3, less than 1.62 found by [20]. It represents the con- tent of COD in the particles.
TKN/BOD5: Evolves between 0.10 and 0.27 with an aver-
age value of 0.16. The kinetics of denitrification depends on this ratio [18].
Electrical energy consumed
The average value of the electrical energy consumed is 3,210 kWh/d. The mass of pollution eliminated in terms of
the BOD5 and COD is, respectively, 3,638.67 and 6,562 kg/d.
The amount of energy required to eliminate the pollution
rises to 0.88 kWh/kg of BOD5, yet it is 0.49 kWh/kg of COD.
The maximum value of EE/BOD5-eliminated ratio (electric
energy/BOD5 eliminated) of 3.85 recorded during the month
of November 2014 and the values of 2.07 and 2.10, respec- tively, recorded during the months of July and September 2015 (Fig. 4) are excessive and exceed the usual values for
the spinneret of activated sludge that are of 2 kWh/kg BOD5
eliminated [23]. Because of the high specific consumption, it is recommended to perform an energy diagnosis of the WWTP.
Conclusion
The main objective of our study was to adopt a com- prehensive approach to control the sanitation system, the evacuation and treatment processes. For this, we have used reliable hydraulic values and monitoring of the main physico- chemical pollution parameters. Starting from a series of con- sequent data during 3 years: 2013, 2014 and 2015, this study was allowed to determine the average values, minimum and maximum values, ratio and concentration ranges characteriz- ing domestic wastewater of the Medea city.
The study also helped to determine the variation range of the pollution parameters and the various relationships that exist between them. The analyses results have identified gaps and helped to improve evacuation yields and wastewater treatment installations of Medea.
At hydraulic level, the wastewater average flow incom- ing to the WWTP is 51% of the nominal capacity, but we met an excess flow for some days in September, October and December 2013. As long as the nominal capacity is not reached, such peak loads should be absorbed by the
and 104% of nominal values.
The nitrogen treatment reveals that the average concen-
trations of ammonia NH4-N vary from 29.36 to 3.46 mg/l from
the inlet to the outlet. However, nitrates NO3-N increase from
0.59 to 10.61 from the inlet to the outlet of the WWTP, due to nitrification. To better control and mitigate, the nitrates at the outlet of the city WWTP, it is necessary to reduce the daily aeration duration, increasing the denitrification duration in anoxic.
For a BOD5 of 352.33 mg/l, the average values recorded of
29.36 mg/l NH4-N and 2.29 mg/l PO4-P indicate a deficit of
35% for PO4-P and an increase of 67% for NH4-N, relative to
the respective theoretical ratios BOD5/NH4-N/PO4-P: 100/5/1
relating to bacterial metabolism. This imbalance into nutri- ents can be an obstacle at the level of biological treatment.
With regard to the ratios, it is observed similar average values and sometimes comparable with those of the litera- ture. The particularity comes from the high values of the
ratios TSS/COD and TSS/BOD5 found, respectively, 0.77 and
1.36, thus translating pollution of a particulate character. A quantitative study would be carried out to complete these results, in particular to evaluate the influence of collection networks on the quality of raw domestic sewage.
The high values of the required electrical energy for the elimination of pollution recorded during the months of November 2014, and July and September 2015, causing exceedances in specific energy consumption require to per- form a diagnostic analysis of the facility.
References
[1] L. Tamrabet, Contribution to the study of the Valorisation of
Wastewater in Maraichage, Doctoral Thesis, University Hadj Lakhdar Batna, Algeria, 2011.
[2] A. Kettab, R. Metiche, N. Bennacar, Water for a sustainable
development: challenges and strategies, Water Sci., 21 (2008) 247-256.
[3] M. Cherrared, T. Zekiouk, B. Chocat, Algerian Urban Sewer
Systems Durability - Study of the Functional Aspect of Jijel Town's System, 7th International Conference on Sustainable Techniques and Strategies for Urban Water Management in Rainy Weather, NOVATECH, Lyon, France, 2010.
[4] M. Nakib, Study of the Possibilities of Use of Treated Wastewater
and Sewage Sludge in Agriculture, Doctoral Thesis, National Polytechnic School, Algiers, 2015.
[5] S. Karef, A. Kettab, M. Nakib, Characterization of byproducts
from wastewater treatment of Medea (Algeria) with a view to agricultural reuse, Desal. Wat. Treat., 52 (2014) 2201-2207.
[6] M. Bernard, P. Mange, D. Obrist, R. Bagnoud, M. Mathier, Balance Sheet of WWTP Functioning of Valais, Department of Transportation, Equipment and the Environment, Water Protection Section, Kanton Wallis, 2012.
[7] L. Mercoiret, Quality of Domestic Wastewater Produced by
Small Communities, Final Report, Partnership ONEMA- Cemagref, 2010.
[8] N. Bettahar, A. Benamara, A. Kettab, A. Douaoui, Potential risk
of nitrate pollution of the semi-arid zones: Case of the western Mid-Cheliff valley (northern Algeria), Water Sci., 22 (2009) 69-78.
[9] G. Deronzier, S. Schétrite, Y. Racault, J.P. Canler, A. Liénard,
A. Héduit, P. Duchène, Treatment of Nitrogen in the Biological Treatment Plants of Small Communities, FNDAE No 25, Technical Paper,Cemagref, 2001.
[10] J.M. Choubert, Analysis and Optimization of Nitrogen Treatment by Activated Sludge Low Temperature, Doctoral Thesis, University Louis Pasteur - Strasbourg I, France, 2002. [11] R.S. Ayers, D.W. Westcot, Water Quality for Agriculture, FAO
Irrigation and Drainage Paper, No. 29 Rev. 1, Rome, 1989. [12] Joradp, Discharge Standards in the Receiving Environment,
Official Gazette of the Republic of Algeria, Vol. 46, 1996, pp. 7-12. [13] J.P. Canler, J.M. Perret, Clari-flocculators especially used in
tertiary treatment, FNDAE No. 35, Technical Paper, Cemagref, 2007.
[14] M. Achak, N. Ouazzani, L. Mandi, Organic pollutants removal from olive mill wastewater by a combined system of a sand filter and an aquatic plant system, Water Sci., 24 (2011) 35-51. [15] G. Tchobanoglous, F.L. Burton, H.D. Stensel, Wastewater
Engineering: Treatment and Reuse, 4th ed., Metcalf & Eddy Inc, 2003.
[16] C. Hajji, A. Bendou, M. Hassou, Characterization of liquid releases from a ship repair unit at Agadir, Int. J. Solar Technol., 45 (2013) 29-36.
[17] D. Belghyti, Y. El guamri, G. Ztit, M.L. Ouahidi, M.B. Joti, A. Harchrass, H. Amghar, O. Bouchouata, K. El kharrim, H. Bounouira, Physico-chemical characterization of wastewater slaughterhouse with a view to the implementation of adequate treatment: case of Kenitra in Morocco, Afrique SCIENCE., 5 (2009) 199–216.
[18] A.G. Sadowski, Calculation Method of a Treatment Spinneret, Laboratory SHU ENGEES "Urban Hydraulic Systems", National School of Water Engineering and Environment of Strasbourg, France, 2002.
[19] N. Bernet, N. Delgenès, J.P. Delgenès, R. Moletta, SBR as a rel- evant technology to combine anaerobic digestion and denitri- fication in a single reactor, Water Sci. Technol., 43 (2001) 209-214.
[20] M.C. Gromaire, Pollution urban Stormwater in the Combined Sewer Network, Characteristics and Origins, Doctoral Thesis, National School of Bridges and Roadway, France, 1998. [21] M.N. Pons, H. Spanjers, D. Baetens, O. Nowak, S. Gillot, J.
Nouwen, N. Schuttinga, Wastewater Characteristics in Europe - A Survey, European Water Management Online, Official Publication of the European Water Association (EWA), 4 (2004) 1–10.
[22] J.P. Canler, Biological Dysfunction of Treatment Plants - Origins and Solutions, FNDAE No. 33, Technical Paper, Cemagref, 2005. [23] OIE, Extensive Process of Wastewater Treatment Suitable for
Small and Medium Communities, International Office for Water, 2001.