DNA methylation dynamics of the human preimplantation embryo
The MIT Faculty has made this article openly available.
Please share
how this access benefits you. Your story matters.
Citation
Smith, Zachary D., Michelle M. Chan, Kathryn C. Humm,
Rahul Karnik, Shila Mekhoubad, Aviv Regev, Kevin Eggan, and
Alexander Meissner. “DNA Methylation Dynamics of the Human
Preimplantation Embryo.” Nature 511, no. 7511 (July 23, 2014): 611–
615.
As Published
http://dx.doi.org/10.1038/nature13581
Publisher
Nature Publishing Group
Version
Author's final manuscript
Citable link
http://hdl.handle.net/1721.1/96731
Terms of Use
Creative Commons Attribution-Noncommercial-Share Alike
DNA methylation dynamics of the human preimplantation
embryo
Zachary D. Smith1,2,3,4,*, Michelle M. Chan1,5,*, Kathryn C. Humm3,6,7,8,9,*, Rahul Karnik1,2,3,
Shila Mekhoubad3,4, Aviv Regev1,9,10, Kevin Eggan1,2,3,4,9, and Alexander Meissner1,2,3 1Broad Institute of MIT and Harvard, Cambridge, Massachusetts, USA
2Harvard Stem Cell Institute, Cambridge, Massachusetts, USA
3Department of Stem Cell and Regenerative Biology, Harvard University, Cambridge, Massachusetts, USA
4Department of Molecular and Cellular Biology, Harvard University, Cambridge, Massachusetts, USA
5Computational and Systems Biology Program, Massachusetts Institute of Technology, Cambridge, Massachusetts, USA
6Division of Reproductive Endocrinology & Infertility, Department of Obstetrics & Gynecology, Beth Israel Deaconess Medical Center, Boston, Massachusetts, USA
7Obstetrics, Gynecology, and Reproductive Biology, Harvard Medical School; Boston, Massachusetts USA
8Boston IVF, Waltham, Massachusetts USA
9Howard Hughes Medical Institute, Cambridge, Massachusetts, USA 10Massachusetts Institute of Technology, Cambridge, Massachusetts, USA
Abstract
In mammals, cytosine methylation is predominantly restricted to CpG dinucleotides and stably distributed across the genome, with local, cell type-specific regulation directed by DNA binding factors1-3. This comparatively static landscape dramatically contrasts the events of fertilization, where the paternal genome is globally reprogrammed. Paternal genome demethylation includes the majority of CpGs, though methylation is maintained at several notable features4-7. While these
Correspondence and requests for materials should be addressed to A.M. ([email protected]) or K.E. ([email protected]).
*These authors contributed equally to this work.
Reprints and permissions information is available at www.nature.com/reprints.
Author Contributions: Z.D.S., K.E. and A.M. conceived the study and Z.D.S., M.M.C., K.C.H., A.R., K.E. and A.M. facilitated its
design. Z.D.S., K.C.H. and S.M. collected samples and Z.D.S. performed methylation profiling, M.M.C. and R.K. performed all analysis with assistance from Z.D.S. Z.D.S., M.M.C. and A.M. interpreted the data and wrote the paper with the assistance of the other authors.
RRBS data is deposited at the Gene Expression Omnibus under accession number GSE51239.
NIH Public Access
Author Manuscript
Nature. Author manuscript; available in PMC 2015 January 31. Published in final edited form as:
Nature. 2014 July 31; 511(7511): 611–615. doi:10.1038/nature13581.
NIH-PA Author Manuscript
NIH-PA Author Manuscript
dynamics have been extensively characterized in the mouse, only limited observations are available in other mammals, and direct measurements are required to understand the extent to which early embryonic landscapes are conserved8-10. We present genome-scale DNA methylation maps of human preimplantation development and embryonic stem cell (ESC) derivation,
confirming a transient state of global hypomethylation that includes most CpGs, while sites of persistent maintenance are primarily restricted to gene bodies. While most features share similar dynamics to mouse, maternally contributed methylation is divergently targeted to species-specific sets of CpG island (CGI) promoters that extend beyond known Imprint Control Regions (ICRs). Retrotransposon regulation is also highly diverse and transitions from maternally to embryonically expressed, species-specific elements. Together, our data confirm that paternal genome
demethylation is a general attribute of early mammalian development that is characterized by distinct modes of epigenetic regulation.
We generated genome-scale methylation maps of human preimplantation using reduced representation bisulfite sequencing (RRBS) to accommodate minimal DNA inputs7. We thawed and screened morphologically normal cleavage stage embryos and blastocysts to represent early and late preimplantation, two replicates of pooled, matched Inner Cell Mass (ICM) and Trophectoderm (TE), motile sperm from four unrelated, healthy donors, and fetal tissues (Extended Data Fig. 1). To estimate the time, extent, and targets of global
remethylation, we generated derivation time series of three human ESC lines, collecting the primary outgrowth, first, and fifth passage per line. On average, replicates showed high reproducibility and captured 1,753,958 CpGs of methylation data at 10× coverage (Extended Data Fig. 2).
We noted two distinguishable architectures for DNA methylation across this time series: somatic-like CpG density-dependent bimodality in sperm, ESCs, and fetal tissues, and extensive CpG density-independent hypomethylation in preimplantation embryos (Fig. 1a). The substantial intermediate methylation in sperm reflects disparate repetitive element regulation, though non-repetitive sequences still fit the somatic paradigm11 (Fig. 1b). Almost no hypermethylated CpGs persist into cleavage, with residual methylation diminishing further into the blastocyst indicating that the embryonic landscape is rapidly established, prior to the 3rd embryonic division (Fig. 1b, Extended Data Fig. 2f). Without access to human epiblasts, in vivo characterization of global remethylation is unavailable, but cross-species comparison between mouse epiblast and human ESCs suggest that human ESCs are a reasonably proxy for postimplantation pluripotency (Extended Data Fig. 3). Notably, within primary ESC outgrowths, global remethylation is nearly complete, including for intermediately methylated repetitive elements apparent in sperm (Fig. 1b).
Despite predominant hypomethylation, erasure is not the de facto fate of all loci. Ten dynamic patterns emerged by k-means clustering of non-repetitive, 100 bp genomic tiles. 45% of sperm hypermethylated tiles retain some methylation over preimplantation, and 23% display high enough levels in cleavage embryos to be biparentally inherited and maintained (Fig. 1c). Local maintenance is significantly weighted to gene bodies: only 31% of 40,486 sperm hypermethylated intergenic tiles are ≥0.2 methylated in cleavage, compared to 57% or 59% of exons or introns, respectively (Fig. 1d, e). Frequently, gene body methylation
NIH-PA Author Manuscript
NIH-PA Author Manuscript
extends for tens to hundreds of kilobases within a single gene (Fig. 1f). Sites of retained embryonic methylation suggest residual DNA methyltransferase activity within a phase where maintenance appears otherwise impeded12.
We incorporated recently published RNA-seq data to interpret the relationship between DNA methylation and expression13 (Extended Data Table 1). Despite global
hypomethylation, the canonical negative correlation between promoter methylation and gene expression extends to preimplantation, though the overall range in promoter methylation is contracted (Extended Data Fig. 4a). Few demethylated promoters are transcribed, suggesting that promoter demethylation largely reflects the global trend (Extended Data Fig. 4b). However, demethylated promoters are more frequently upregulated than repressed and include POU5F1, whose embryonic induction is essential for development14 (Extended Data Fig. 4c, d). Thus, our preimplantation data support models where distinct mechanisms may regulate global versus targeted reprogramming15.
The global DNA methylation dynamics of the human embryo closely mirror those of mouse, with sharp transitions both into and out of preimplantation7,16 (Fig. 2a). We investigated the
behavior of orthologous exons within our full mouse timeline, predicated on their human dynamics. Surprisingly, simply sorting mouse exons according to the dynamics of their human orthologues recapitulated similar trends in sperm and over preimplantation (Fig. 2b). In mouse, demethylated exons are erased early, with moderate passive depletion over cleavage (Fig. 2c, d). Alternatively, exons that maintain methylation behave similarly in mouse and are hypermethylated in both gametes (Fig. 2c, d). Intron dynamics recapitulated these trends, but only after repetitive elements were removed from methylation estimates (Extended Data Fig. 5). Thus, both species pass through an equivalent global
reprogramming with highly similar kinetics, while many orthologous regions maintain methylation that decays passively.
Transient, maternally-inherited monoallelic methylation has been previously observed in mouse5-7. To identify candidate loci in human without access to oocytes, we searched for
regions that are significantly more methylated in preimplantation embryos than in sperm, since this methylation would likely be of maternal origin (Extended Data Fig. 6a, Methods). Using these criteria, we identify 5,265 candidate maternal DMRs, including most canonical ICRs. We clustered these regions by their resolution in ESCs and found that most are preimplantation-specific and either hyper or hypomethylated in somatic tissue (Fig. 3a). The location and CpG density of DMR tiles depends on their resolution, with somatically hypomethylated DMRs substantially enriched for CGI-containing promoters, while somatically hypermethylated are more likely to be intragenic and distributed further downstream (Fig. 3a, Extended Data Fig. 6b,c). To confirm that these signatures represent true monoallelic, imprint-like maintenance, we generated RRBS libraries of two unrelated, single blastocysts and identified CpGs that could be assigned to each allele, nearly all of which were monoallelically methylated (Fig. 3b, Extended Data Fig. 7).
Given that maternal DMRs in mouse are also enriched for CGIs, we next examined the conservation of targeted loci between species (Fig. 3c). We found that 795 and 293 CGIs behave as transient DMRs in human and mouse, respectively, with substantially more
NIH-PA Author Manuscript
NIH-PA Author Manuscript
resolving to hypermethylation in human (Fig. 3d and Extended Data Table 2). Notably, Human DMRs resolving to hypomethylation are more likely to be annotated as CGIs in mouse than those resolving to hypermethylation (Extended Data Fig. 6d,e). We restricted our comparison to DMRs that share CGI status in both species and found that maternally contributed, preimplantation-specific DMRs are notably divergent, with only 7.5% found in human equivalently regulated in mouse. No obvious trend distinguished shared from species-specific signatures, though several, such as the somatic promoter of DNMT1, indicate conserved regulatory utility17 (Extended Data Fig. 8a). The disparity of maternal
methylation targeting contrasts true ICRs, which are generally conserved18 (Fig. 3e,
Extended Data Fig. 8b). Moreover, hypomethylation-resolving DMRs specific to one species are constitutively hypomethylated in the other, suggesting these signatures are frequently and diversely targeted (Fig. 3f).
We next investigated species-specific repetitive elements, incorporating RNA-seq data to interpret DNA methylation's role in their regulation13. In human sperm, repetitive elements
are frequently incompletely methylated or hypomethylated11. Long Terminal
Repeat-containing elements (LTRs)are unexpectedly bimodal, with only a fraction hypermethylated and most displaying gametic escape that persists over preimplantation (Extended Data Fig. 9a). Long Interspersed Nuclear Elements (LINEs)are generally highly methylated in sperm, demethylated in the early embryo, with some partial remethylation in hESCs and complete hypermethylation in somatic cells (Extended Data Fig. 9b). Finally, Short Interspersed Nuclear Elements (SINEs), which represent the majority of human genome repetitive content, exhibit a uniform global behavior (Extended Data Table 3). Though intermediately methylated in sperm, their dynamics over preimplantation were otherwise similar to intergenic sequences in general (Extended Data Fig. 9c). Alternatively, diverse LTR and LINE subfamilies are dynamic, providing several examples where DNA methylation appears to coordinate specific regulatory transitions (Extended Data Tables 4 and 5). We found that the bimodality of LTR methylation is explained by species-specific ERV1 elements. Alternatively, the ERVK family generally maintained high methylation levels, similar to observations in mouse and suggesting conserved, constitutive targeting4 (Fig. 4a,
Extended Data Fig. 9d-g). After fertilization, expression sharply transitioned from a MalR dominated early cleavage state resembling the oocyte to one composed of ERV1 and ERVK elements in the blastocyst and ESCs (Fig. 4b). We were surprised to find that some ERV1s appear to be induced later, following global remethylation in ESCs, indicating a transition in the specific subfamilies that are expressed. Transcripts present early in preimplantation are generally from gametically hypomethylated ERV1 elements that are downregulated prior to
de novo methylation (Fig. 4c, d). Moreover, for these elements, methylation and expression
are negatively correlated, indicating discriminatory targeting for even extremely related sequences (Extended Data Fig. 9h). In contrast, the LTR7 subfamily is hypermethylated in sperm, rapidly demethylated, and upregulated in the blastocyst and hESCs (Fig. 4c, d). LTRs are rarely dynamic outside of this early versus late preimplantation axis: either they are already expressed in the oocyte and silenced later or are induced following
demethylation and remain expressed in ESCs. Notably, this latter dynamic includes a limited number of recently emergent, unrelated subfamilies19-21.
NIH-PA Author Manuscript
NIH-PA Author Manuscript
Compared to LTRs, LINEs maintain higher methylation levels and only the primate-specific L1PA phylogeny is dynamically expressed (Fig. 5a, Extended Data Fig. 9c). As the only actively transposing lineage in humans, L1PA subfamilies emerged as a linear phylogeny22. We found that the human-specific L1HS and its two closest ancestors, L1PA2 and L1PA3, are demethylated early, while older elements maintain higher embryonic methylation (Fig. 5b). Correspondingly, nearly all embryonic transcription could be attributed to these three youngest subfamilies (Fig. 5c, Extended Data Fig. 10a). Given the homology between subfamilies, we searched for sequence composition changes that may explain the preimplantation-specific escape of younger elements. We aligned 5′ UTRs of full-length L1PA7 to L1HS and compared sequences that demarcated demethylated L1PA3-descended elements from constitutively targeted ancestors. The largest discrete difference corresponds to an ∼130 bp deletion found within the L1PA3 lineage itself that separates older elements from the L1HS progenitor L1PA3a23 (Fig. 5d, Extended Data Fig. 10b,c). Intriguingly, the presence or absence of this region isolates two disparately regulated subpopulations and marks the transition to embryonic expression (Fig. 5e,f, Extended Data Fig. 10d). This adaptation may represent a specific moment in the evolutionary progression of the L1PAs when emerging elements evaded a seemingly sequence-directed, repressive mechanism. Whether older subfamilies retain expression or transposition potential without active silencing, or if this signature reflects a vestigial, host genome adaptation that is no longer required, remains to be investigated.
We present basepair resolution maps of DNA methylation as it is dynamically reconfigured during human early development. These data identify a set of transient, maternally
contributed methylation at CGI promoters, the resolution of which suggest independent modes of acquisition: male germline specific protection against methylation or de novo targeting in the oocyte of otherwise canonically unmethylated CGIs24. Both are common
and show poor conservation compared to classic ICRs, indicating that short-lived, parent-specific signatures are less evolutionarily constrained than those persisting after
implantation. We find that repetitive element regulation is strikingly diverse in human, far more so than in mouse, with gametically hypomethylated LTR subfamilies present in the oocyte and early embryo and others sharply demethylated and induced embryonically. For LINEs, the stepwise phylogeny within the primate-specific L1PA lineage pinpoints a specific, adaptive transition. Because L1HS elements remains transpositionally active, including somatically in numerous cancers, the targeting of epigenetic silencing machinery during preimplantation may be relevant in identifying the root cause of their aberrant induction later25. Understanding the regulatory principles inherent to the early embryo will
improve continuing efforts to evaluate complex traits with unclear modes of epigenetic inheritance. Future work to characterize the mechanisms that impose these diversely targeted embryonic methylation patterns will illuminate their contribution to normal human development and disease.
NIH-PA Author Manuscript
NIH-PA Author Manuscript
Methods
IRB Approval
Harvard University institutional review board (IRB) and Embryonic Stem Cell Research Oversight (ESCRO) Committee approval was obtained for both the collection and experimental use of surplus embryos resulting from infertility treatment and donated for research.
The Harvard University and Beth Israel Deaconess Medical Center institutional review boards both determined that collection, preparation, and experiments using discarded human gametes was not human subjects research and therefore did not require a full IRB review.
Consent Process
All embryos used in this study had previously been donated and stored at Harvard University. Couples donating surplus embryos for the purpose of research signed an extensive consent form at the time of their donation. These consent forms were approved by the Harvard University IRB. The authors did not have access to any identifying personal health information.
Gametes were obtained from patients who signed a consent form authorizing the
experimental use of discarded gametes. These consent forms were scanned and stored in the patient's electronic medical record. The authors did not have access to any identifying personal health information.
Human sperm collection and preparation
Semen samples were collected from five healthy patients between the ages of 30-34 undergoing an evaluation for infertility. Each male was a non-smoker with a body mass index < 30 kg/m2. Semen samples were collected by masturbation after 2 days of abstinence. A semen analysis was performed by an experienced andrologist confirming a normal sperm concentration (> 20 million/ml), normal motility (>50% motile), and normal morphology using the Kruger strict criteria (≥4% normal forms).
A PureCeption gradient solution (PureCeption 100% Isotonic Solution, Quinn's Advantage Medium with HEPES, In-Vitro Fertilization Inc) was prepared to purify each sperm sample and remove somatic cell contaminants. The gradient consisted of two layers of 1ml of PureCeption: 90% and 47% in a 15ml conical tube.
2ml of the semen sample was placed on top of the gradient. The gradient was centrifuged at 1100 rpm for 20 minutes and the supernatant removed. 1ml of sperm washing medium (Quinn's Sperm Washing Medium, In Vitro Fertilization Inc) was used to re-suspend the pellet. The sample was then centrifuged at 750 rpm for 10 minutes. The supernatant was removed. 0.1ml of the remaining pellet of sperm was transferred to a 1.7ml SafeSeal Microcentrifuge Tube (Sorenson Bioscience) and placed immediately at minus 80 degrees Celsius.
NIH-PA Author Manuscript
NIH-PA Author Manuscript
Human embryo thawing
Excess human embryos created via in vitro fertilization for the treatment of infertility were previously donated by patients undergoing assisted reproduction and stored in liquid nitrogen at minus 196 degrees Celsius.
Embryo culture dishes were set up using 60mm culture dishes (BD Falcon) and eight 30 microliter drops of Global embryo culture media (LifeGlobal) plus 15% Plasmanate (Talecris) overlaid with 10ml of oil (SAGE). Rinse dishes were also set up using 2.5ml of embryo culture media plus 15% Plasmanate. These dishes were equilibrated overnight at 37 degrees Celsius, 5% CO2.
Both cleavage stage embryos and blastocysts were thawed using the Quinn's Advantage Embryo Thaw Kit (SAGE). This kit contains three solutions – 0.5M sucrose, 0.2M sucrose, and diluent. The straw or the vial containing the cryopreserved embryos was placed in a water bath at 30 degrees Celsius for 2 minutes. The embryos were then expelled from the straw by removing the heatsealed end or transferred from the vial using a Pasteur pipette to a clean tissue culture dish on a heated stage. The embryos were located and thawed according to the manufacturer's instructions.
Each embryo was rinsed and then placed in a single drop in the embryo culture dishes described above. Embryos were cultured in a humidified atmosphere at 37 degrees Celsius and 5% CO2 in air.
Embryo evaluation
Cleavage stage embryos were evaluated 2-4 hours after the thawing process. Blastocysts were evaluated 18-24 hours after the thawing process. Embryos were evaluated using a Nikon Eclipse 80i microscope and images of each embryo were obtained at 40× using the Hamilton Thorne Clinical Laser Software. These images were then independently evaluated by two senior embryologists. Survival and quality were determined and an embryo was only included in this study if both embryologists agreed upon viability.
Human embryo collection
Single viable embryos were passed through several rounds of additional defined KSOM media (Millipore) under mineral oil prior to an Acidic Tyrode's Solution (Sigma) wash to dissolve the zona pellucida, somatic cellular debris, and additional sperm. Single embryos were then rinsed in clean media drops before pooling of the embryos, assessment for the absence of contaminants and snap freezing in minimal volume.
ICM/TE isolation of human and mouse embryos
Single human and mouse embryos exhibiting a clear ICM were isolated and the zona pellucida carefully removed to preserve the integrity of the blastocoel. They were then oriented using standard micromanipulation equipment (Narishige) and oriented with a clear plane available to separate the ICM from the expanded TE dissected using a Hamilton Thorne XYClone laser with 300 μs pulsing at 100% intensity. Short pulses progressed over the cleavage plane until the ICM and TE compartments were cleanly separated, at which
NIH-PA Author Manuscript
NIH-PA Author Manuscript
point both pools were separated for collection in clean microdrops, serially washed and snap frozen in minimal volume.
Derivation of new hESC lines
Human embryo culture and hESC derivations were carried out as previously described26. Briefly, cleavage stage human embryos were thawed using Quinn's Advantage Thaw Kit (SAGE) and cultured in Global medium (LifeGlobal) supplemented with 15% Plasmanate (Talecris) for 2-3 days until the blastocyst stage. For hESC derivation, the visible ICM was separated from the blastocyst by exposing the trophectoderm cells to 20-30 cell lethal laser pulses from a Xyclone laser (Hamilton Thorne Biosciences). The isolated ICM was then plated on a layer of gamma-irradiated mouse embryonic fibroblasts (MEFs) in derivation media consisting of KO-DMEM (Life Technologies), 15% KO-SR (Life Technologies), 2.5% Fetal Bovine Serum (FBS) (Hyclone), 2mM Glutamax, 1% non-essential amino acids, 50units/ml penicillin and 50μg/ml streptomycin (Life Technologies), 0.055mM
β-mercaptoethanol (Life Technologies), 10ng/ml bFGF (Millipore). Ten to twelve days after ICM plating, the embryonic stem cell outgrowth (passage 0) was mechanically dispersed with half of the outgrowth plated onto a new MEF feeder layer for hESC line establishment (passage 1), and half used for methylation analysis. The human ESC colonies that resulted following plating were continuously mechanically passaged. The pluripotency of the lines was confirmed by staining for pluripotency markers and by in vitro differentiation into the 3 germ layers. The lines were registered with the Harvard University ESCRO Committee as HUES 71, HUES 72 and HUES 73.
Isolation of mouse E6.5 epiblast and extraembryonic ectoderm
Isolation of E6.5 epiblast and extraembryonic ectoderm was adapted from Ref. 27. Hormone-primed C57Bl6/J mice were euthanized 6 days after mating with 129S1/SvIMJ males. Deciduae were removed from the uterine horn and the full embryo extruded and placed under mineral oil in KSOM media using a pulled glass capillary. Residual maternal contaminants were removed by continuous mouth pipetting, after which the epiblast and extraembryonic ectoderm were bisected using an obliquely cut flame drawn glass capillary and the respective tissues segregated in separate KSOM drops. Visceral endoderm was removed from either epiblast or extraembryonic ectoderm by incubation in 0.5% trypsin/ 2.5% pancreatin (Sigma) dissolved in PBS for 20 minutes at 4°C, after which they were returned to KSOM medium drops and incubated for an additional 5 minutes at room temperature. Using a glass capillary pulled to a diameter slightly less than that of the embryo, visceral endoderm was removed by rapid aspiration and expulsion. Cleaned epiblast or extraembryonic ectoderm tissue were then serially washed through several additional drops of KSOM prior to pooling and snap freezing at minimal volume.
Library Preparation and Sequencing
RRBS libraries were generated as described and sequenced on an Illumina Genome Analyzer II before alignment and analysis7. The sequencing reads were aligned to the Human Genome Build 19 (hg19) for human samples and Mouse Genome Build 37 (mm9) for mouse samples using a custom computational pipeline taking into account the strain background for mouse samples. The data set was supplemented with mouse early
NIH-PA Author Manuscript
NIH-PA Author Manuscript
development methylation profiles from Ref. 7 and human fetal somatic methylation profiles from the NIH Epigenomics Roadmap Project. Human ESC lines H1, H9, HUES64, and HUES6 were used for comparison with our newly derived hESC lines. Sample quality was assessed by looking at coverage numbers (i.e. number of loci present and coverage of loci) and similarity between biological replicates using pearson correlation, euclidean distance, and visual inspection of methylation histograms (see Extended Data Figs. 1 and 8)
Estimating methylation levels
The methylation level of each sampled cytosine was estimated as the number of reads reporting a C, divided by the total number of reads reporting a C or T. Single CpG
methylation levels were limited to those CpGs that had at least 10-fold coverage. For 100bp tiles, reads for all the CpGs that were covered more than 5-fold within the tile were pooled and used to estimate the methylation level as described for single CpGs. The CpG density for a given single CpG is the number of CpGs 50bp up- and downstream of that CpG. The CpG density for a 100bp tile is the average of the CpG density for all single CpGs used to estimate methylation level in the tile.
The methylation level reported for a sample is the average methylation level across replicates. A replicate will contribute to the average only if it meets the coverage criteria within the replicate. Technical replicates were averaged before contributing to the sample average.
Genomic features
For mouse, high density CpG promoters (HCP), intermediate density CpG promoters (ICP), low density CpG promoters (LCP), CpG island, and DMR annotations were taken from Ref. 28. LINE, LTR, and SINE annotations were downloaded from the UCSC browser (mm9) RepeatMasker tracks. Gene annotations were downloaded from the UCSC browser (mm9) refseq track. Promoters (TSSs) are defined as 1kb up and downstream of the TSS and are parsed from refseq annotation. Promoters for all isoforms are included. Enhancer
annotations were taken from Table S1 from Ref. 29. Corresponding human annotations were downloaded from the UCSC browser for hg19. Phastcons (Placental, PCE) coordinates were downloaded from the UCSC browser phastcons hg19 track. Human imprinting control regions were taken from Ref. 30.
In each case, the methylation level of an individual feature is estimated by pooling read counts for all CpGs within the feature that are covered greater than 5-fold, and levels are only reported if a feature contains at least 5 CpGs with such coverage (in contrast to 100bp tiles where no minimum number of CpGs is required). A tile is annotated as a genomic feature if any portion of the tile overlaps with the feature and thus, may be annotated by more than one feature (e.g. the same can be annotated as both a promoter and a gene).
Gene Expression Analysis
Raw RNA-seq data was downloaded from the gene expression omnibus from accession GSE36552 for human oocytes, zygotes, 2-cell, 8-cell, morulae, late blastocyst, hESC passage 0 and hESC passage 10, taken from Ref. 13. For all samples but morulae and late
NIH-PA Author Manuscript
NIH-PA Author Manuscript
blastocyst, data for all single cells were pooled before alignment. Morulae and late
blastocyst samples were pooled according to their respective embryos. Duplicate reads were removed before alignment. Alignment was performed using TOPHAT against human genome assembly 19 with default settings. Cufflinks was used for quantification and statistical tests of significant change using default settings.
Retrotransposon expression analysis
Alignment was performed using BWA against human genome assembly 19 with default settings. Repeat subfamily FPKM is the sum of the number of reads that align to each repeat element for the subfamily divided by the genome coverage of the subfamily in kilobases and normalized by the total number of reads in the sample. Repeat subfamily FPM is the same as FPKM without normalizing to the subfamily's genome coverage. Samtools was used to find candidate repeat alignments and the CIGAR string was parsed to determine if the read overlapped with the repeat element. One L1PA6 element (chr2: 49454725- 49460932) contained an unusual tall, short peak of read density and was excluded from analysis. The L1PA consensus plot for expression was produced by using the consensus coordinates for the element from the UCSC genome browser to align the reads from the element's alignment to the consensus sequence. Read count is the read coverage at each position in the consensus sequence divided by the total number of reads in the sample. Note that we did not use a multiple sequence alignment of the repetitive elements so this is not a fully accurate representation of expression over the consensus. For example, if the element has an insertion compared to the consensus sequence, then reads that overlap the insertion will contribute to read density on the consensus. The genomic sequence density plot was generated in a similar manner.
Orthology between human and mouse
The 46 mammals multiple sequence alignment downloaded from the UCSC browser was used to find orthologous regions from hg19 to mm9. For 100 bp tiles, the methylation for the corresponding region in mouse was used for comparison regardless of the length of the corresponding region. For genomic features, the methylation level of the corresponding region in mouse was used unless the mouse coordinates overlapped a mouse annotation of the same type. In the latter case, the methylation level of the corresponding feature was used instead. The 60 mammals multiple sequence alignment downloaded from the UCSC browser for mm10 was used to find orthologous regions from mouse to human by first translating the mm9 genomic feature coordinates to mm10, and then following the same procedure above. RRBS selectively enriches for a consistent fraction of CpG dense genomic fragments within a given species, and as such provides genome-scale information versus genome-wide. In human and mouse, the coverage for CGIs is 87.4% and 89.6%, for Exons, 11.3% and 8.8%, and for Introns, 26.4% and 13.4%, respectively. In general, for both species, most features are captured at similar frequencies, but far more SINEs are captured in human than in mouse. Of the CpG islands that are captured by RRBS in human, 82.7% align to the mouse genome, and 53.9% align and share CGI status in mouse, Out of the loci that aligned to the mouse genome, mouse RRBS captured 93.6% of shared CGIs and 72.9% of aligned regions
NIH-PA Author Manuscript
NIH-PA Author Manuscript
not annotated as CGIs in mouse. 85.2% of RRBS-captured human exons align to mouse exons and, of these, 52.7% are captured by mouse RRBS. For introns, 86.1% of human introns align to mouse introns and, of these, 34.2% are captured in mouse.
Derivation Sliders: Comparison of hESCs to mouse pre and post implantation pluripotent tissues
Regions with a methylation difference >0.1 between mouse ICM and mouse epiblast were used to assess the similarity of a sample to mouse ICM vs mouse epiblast. For each sample, a region scores as mouse ICM if its methylation level is more similar to mouse ICM than mouse epiblast and vice versa. Regions with methylation values that are equidistant from mouse ICM and mouse epiblast are excluded. If the slider is viewed as going from 0 (mouse ICM) to 1 (mouse epiblast), then the position of a sample is simply the proportion of regions that scored mouse ICM over the total number of regions that contribute a score.
100 bp clustering and feature enrichment
100 bp tiles were clustered using k-means clustering. Clusters were designated as
hypermethylated (>= 0.5) or hypomethylated (<0.5) in sperm according to the cluster center. A tile and a feature were designated as overlapping if there was an overlap of 1bp or more between them. Feature enrichment scores are the negative log of the p-value calculated using the hypergeometric distribution.
Identification of gametic differentially methylated regions in human
Regions that have low methylation in sperm and some methylation in the early embryo likely represent instances of maternal methylation if the assumption that there is no de novo methylation over the cleavage divisions is true. A region is considered a maternally methylated differentially methylated region if: 1) it is significant after a two sample t-test between sperm and blastocyst with equal variance after correction for multiple hypothesis testing (q value < 0.05 using the Storey method, Ref. 31) it has a methylation difference >=0.2 higher in blastocyst than in sperm using sample means, and 3) it has a mean methylation level >=0.2 for 8 cell. These criteria were applied to both 100 bp tiles and to CGIs.
Identification of human SNPs
SNPs in human were downloaded from the 1000 genomes project (
ftp://ftp-trace.ncbi.nih.gov/1000genomes/ftp/release/20110521/). SNPs that are not trackable by RRBS (C/T or A/G) and positions that are not covered in an in silico digest of hg19, i.e. covered by RRBS, were removed. The ratio [reference count/(reference count + alternative count)] was calculated for each SNP in the single human blastocyst samples and SNPs with ratios <0.2 or ratios >0.8 were removed since they likely represent homozygous alleles in the sample. We used the resulting genotypes to facilitate parent-of-origin methylation tracking.
NIH-PA Author Manuscript
NIH-PA Author Manuscript
Parent-of-origin methylation tracking
Reads were segregated into either the reference or alternative allele, and CpG methylation levels were called in the same manner described above. SNP normalized methylation values (Extended Data Fig. 8) are the average of the methylation values derived from each
haplotype.
L1PA Sequence Alignment
All LINE L1HS and L1PA2-7 elements >=5,500 bp were taken from the human genome and aligned using Muscle with the following parameters: muscle –maxiters 2 –diags.
Methylation levels are from full-length elements that are captured by RRBS. The 132 bp insert sequences common to elements L1PA3b and older were similarly aligned for Extended Data Fig. 11c.
Extended Data
Extended Data Figure 1. Isolation of human preimplantation embryos for DNA methylation mapping
NIH-PA Author Manuscript
NIH-PA Author Manuscript
a. Three replicates of D6 embryos, ranging in inputs from 3 to 5 embryos, were thawed,
screened for proper morphology, independently isolated from the zona pellucida and pooled prior to RRBS profiling. Embryos are displayed prior to purification.
b. Two replicates of 18 and 19 human D3 cleavage stage embryos were thawed, screened for
proper morphology, assessed for embryonic stage/cell number, and purified from the zona pellucida prior to RRBS profiling. Embryos are displayed prior to purification.
c. Cell numbers from thawed cleavage stage embryos ranged from 4-11 cells per embryo
with a median of 8 (+/- 1.6 standard deviation) cells. Within each replicate, only 3 embryos demonstrated onset of compaction at the time of collection. Red line signifies the median, boxes and whiskers the 25th/75th and 2.5th/97.5th percentiles, respectively.
Extended Data Figure 2. Assembly of a genome wide DNA methylation time series through human early development and over ESC derivation
a. Summary of RRBS libraries generated, with number of biological replicates (n), number
CpGs captured at 1×, 5×, and 10×, mean/median methylation values for 100 bp tiles estimated from CpGs covered at ≥5×, and mean Euclidean distance and Pearson correlation across biological replicates for these tiles.
b. Pearson correlation matrix for sperm, early embryonic, and fetal tissue samples.
NIH-PA Author Manuscript
NIH-PA Author Manuscript
c. Clustering of gametic, somatic, and preimplantation methylation profiles segregate
according to their global DNA methylation landscape, with Sperm/Somatic tissue forming an adult methylation cluster that contrasts the unique epigenetic landscape present in preimplantation embryos.
d. Summary of RRBS libraries generated for ESC derivation, with number of biological
replicates (n), number CpGs captured at 1×, 5×, and 10×, mean/median methylation values for 100 bp tiles estimated from CpGs covered at ≥5×, and mean Euclidean distance and Pearson correlation across biological replicates for these tiles. hESC ref refers to a reference collection of previously assayed ESC lines as part of the NIH Roadmap Epigenomics Project (Methods). Human ICM/TE were isolated through laser-assisted microdissection.
e. Pearson correlation matrix for human samples used to model ESC derivation. A consistent
signature is rapidly acquired by the outgrowth stage (p0) and stably maintained over additional passages.
f. Methylation histograms for 100 bp tiles for human blastocysts and dissected ICM/TE
tissue show minimal global difference, which is also observed when comparing previously assayed, immunosurgically purified mouse ICM to mechanically dissected ICM and TE.
g. Boxplots of the change in methylation (Δ methylation) for 100 bp tiles from cleavage to
the blastocyst stage show passive demethylation of DNA methylation, particularly for regions that exhibit the highest methylation levels at this stage. Red line signifies the median, boxes and whiskers the 25th/75th and 2.5th/97.5th percentiles, respectively.
Extended Data Figure 3. Characterization of ESC derivation to in vivo pluripotent tissues in mouse
a. Global methylation histograms of 100 bp tiles for human ICM and p5 ESCs (rows)
compared against mouse preimplantation and postimplantation embryos (ICM, E6.5 Epi), as well as with extraembryonic ectoderm (ExE) (columns), demonstrate the rapid acquisition of an epiblast-like, somatic methylation pattern upon ESC derivation in human.
b. Regions that discriminate mouse ICM from E6.5 epiblast were used to assign human ICM
and ESCs to an equivalent in vivo pluripotent state for orthologous features. The position
NIH-PA Author Manuscript
NIH-PA Author Manuscript
along the axis from preimplantation (ICM) to postimplantation (Epi) pluripotency represents the proportion of regions in a set that resemble one state versus the other. For all feature sets, human ESCs rapidly establish an epiblast identity, maintaining this signature from the outgrowth stage over ensuing passages. hESC Ref refers to a reference collection of
previously assayed ESC lines as part of the NIH Roadmap Epigenomics Project (Methods).
Extended Data Figure 4. Inverse correlation between expression and promoter methylation is retained during human preimplantation
a. Scatterplots of oocyte, preimplantation embryo and ESC derivation gene expression
compared to promoter methylation display a canonical negative correlation, even during preimplantation where the range of promoter methylation values is contracted by global hypomethylation.
b. Box plots of gene expression values for genes significantly upregulated by ≥ 2 fold from
oocyte to 8 cell compared to non-dynamic genes and categorized by promoter methylation dynamics. Genes that are both demethylated and upregulated are associated with induction from a silenced state, while those that are demethylated but not upregulated display only basal level transcription that is significantly lower than observed in promoters that are not demethylated. Bold line signifies the median, boxes and whiskers the 25th/75th and 2.5th/ 97.5th percentiles, respectively.
NIH-PA Author Manuscript
NIH-PA Author Manuscript
c. Gene expression dynamics following fertilization for hypermethylated sperm promoters
demethylated ≥0.5 by the cleavage stage compared to the rest of promoters (Other). 123 of 541 (22%) demethylated promoters demonstrate significant upregulation (≥2-fold) compared to only 13.6% of other promoters. Moreover, the ratio of upregulated to downregulated genes in the demethylated set substantially favors zygotic activation, while other promoters include more downregulated maternal transcripts (Odds Ratio = 1.877, p = 1.344 × 10⁻⁸, hypergeometric test).
d. RNA-seq track of the pluripotency promoting, zygotically induced gene POU5F1, whose
promoter is demethylated from 0.59 in sperm to 0.02 in cleavage, concurrent with its transcriptional induction.
Extended Data Figure 5. Local retention of DNA methylation is similar for introns over human and mouse preimplantation
a. Introns are clustered according to their dynamics in human and the methylation of
orthologous regions are tracked in mouse. Divergence is predominantly restricted to intermediately methylated features in human sperm that are generally hypermethylated in mouse. Δ methylation heatmap displays the difference in methylation values between equivalent preimplantation timepoints, with ESCs in human serving as a proxy for comparison to the E6.5 epiblast in mouse. Deviation is most apparent for intermediately
NIH-PA Author Manuscript
NIH-PA Author Manuscript
methylated human sperm introns, where they are less methylated than in mouse. RMSK included: repeat masker annotated regions included.
b. When repetitive elements are removed from the calculation of intron methylation, the
apparent divergence between mouse and human values is lost. Methylation and Δ methylation heatmaps are as in a. Gray denotes missing values (m.v.) where estimates for intronic methylation were exclusively derived from repetitive elements. RMSK-free: repeat masker annotated regions excluded.
c. Violin plots of the two main dynamics (maintained vs demethylated) for sperm
hypermethylated introns over human and mouse preimplantation after repetitive elements are removed. As observed for orthologous exons, regions that retain high methylation throughout human preimplantation are conserved, hypermethylated in both mouse gametes, and display maintained regulation as early as the zygote stage.
Extended Data Figure 6. Genomic characterization of transient maternally contributed imprint-like regions
a. Heatmap of 100 bp tiles in mouse preimplantation identified using the same criteria as
applied to human (Methods). This criteria, which assumes limited de novo methylation, identifies 2,044 tiles in mouse where methylation is ≥ 0.2 in both 8 cell and the ICM, there is ≥0.2 methylation difference between the ICM and sperm, and this difference is significant via t test, (q-value < 0.05). 89% of those tiles that are captured in the mouse oocyte are
NIH-PA Author Manuscript
NIH-PA Author Manuscript
monoallelically inherited and show significant differences between the gametes by t-test, providing an empirical upper bound on the False Discovery Rate for this strategy when applied to human of ≤ 0.11, assuming the underlying principles of imprint regulation are the same as in mouse.
b. The proportion of 100 bp tiles, classified according to their resolution in ESCs, for each
genomic feature presented in Figure 3a.
c. Cumulative density function (CDF) plot of the distance to the nearest annotated TSS for
CGI DMRs that resolve to hypomethylation, intermediate/variable methylation, or
hypermethylation. There is a discrepancy in genomic location between those that resolve to hypomethylation, of which a sizable fraction are in the TSS, and those that do not, which are generally enriched further downstream.
d. Boxplots of CpG density for CGI DMRs that resolve to hypomethylation, intermediate/
variable methylation, or hypermethylation paired with comparable non-DMR CGIs (Somatic). Those resolving to hypomethylation have higher CpG densities than those that resolve to intermediate/variable or hypermethylation, but have slightly lower CpG density than non-DMR, constitutively hypomethylated CGIs. Alternatively, while CGIs that resolve to hypermethylation show a lower CpG density than other DMRs, they show higher density than non-DMR hypermethylated islands, suggesting some level of protection against deamination as an attribute of their uniquely hypomethylated status in the male germline.
e. Pie charts of cross species alignment and CGI status of human CGI DMRs into mouse.
Those that resolve to hypomethylation are more often conserved in mouse and more frequently retain their CGI status, whereas those resolving to hypermethylation are less conserved. Moreover, intermediate/variable and hypermethylation-resolving regions that do align are less frequently retained as CGIs suggesting that hypomethylation specific to the male germline is insufficient to protect these regions from progressive deamination over time. 368, 166, and 260 CGIs comprise the hypo, intermediate/variable, and hyper methylation sets, respectively,
NIH-PA Author Manuscript
NIH-PA Author Manuscript
Extended Data Figure 7. Generation of single blastocyst libraries confirm the monoallelic behavior of putative maternal DMRs
a. Summary of two single blastocyst RRBS libraries. Number of CpGs captured at 1×, 5×,
and 10×, mean/median methylation values for 100 bp tiles estimated from CpGs covered at ≥5×, and mean Euclidean distance and Pearson correlation when single blastocyst replicates are compared to the pooled blastocyst timepoint.
b. Histograms of DNA methylation for 100 bp regions captured for each single blastocyst
replicate.
c. The ratio of reference allele to alternative allele for single nucleotide polymorphisms
(SNPs) called as heterozygous in each blastocyst replicate.
d. For the 4,492 and 5,118 SNPs that were considered as heterozygous within each single
blastocyst, 10,068 and 11,415 single CpGs could be assigned to alleles. Scatterplots depict untracked methylation values for these CpGs against their normalized methylation values, which are the average of their monoallelic methylation states.
NIH-PA Author Manuscript
NIH-PA Author Manuscript
Extended Data Figure 8. The somatic promoter of DNMT1 is maternally methylated in human and mouse
a. Plots of single CpG methylation for DNMT1, including a CGI over the somatic promoter
that behaves as a transient, preimplantation-specific DMR in both human and mouse. In mouse, hypermethylation of this island corresponds to its transcriptional readthrough and exclusion as part of an oocyte-specific isoform (Dnmt1-o) that is not annotated in human. Annotated CGIs and species conservation tracks are included for reference below.
b. Heatmap of orthologous ICR dynamics over human and mouse preimplantation. Of those
that map between species and are captured by RRBS, all but one (PEG10) behave identically.
NIH-PA Author Manuscript
NIH-PA Author Manuscript
Extended Data Figure 9. Repetitive element regulation during human and mouse preimplantation
a. Violin plots for LTRs over human and mouse development. In human, LTRs demonstrate
a bimodal distribution in sperm. Hypermethylated LTRs display a range of demethylation in the early embryo that reflects the dynamics of subfamilies. Upon ESC derivation, and within fetal tissues, LTRs become stably hypermethylated. Alternatively, during mouse
preimplantation, LTRs are consistently hypermethylated in sperm and generally retain methylation over preimplantation. E6.5 Epi and E6.5 ExE refer to dissected epiblast and extraembryonic tissue from E6.5 embryos.
b. Violin plots for LINEs over human and mouse development. In human sperm, LINEs are
unstably hypermethylated, with discrete populations methylated with a mean of ∼0.75, ≥0.9, and a small subpopulation showing gametic escape from high methylation. Alternatively, LINEs are indiscriminately hypermethylated in mouse sperm. In both species, several populations of elements demonstrate different extents of demethylation during preimplantation, including many that retain higher levels in cleavage and only minor, passive depletion into blastocyst. Upon human ESC derivation or during mouse
implantation, elements are generally remethylated, though only partially for those elements that are demethylated after fertilization. Hypermethylation is complete in fetal tissue. In human, these discrete dynamics can be attributed to to the unstable methylation for
L1HS-NIH-PA Author Manuscript
NIH-PA Author Manuscript
L1PA3a subfamilies while, in mouse, the currently active L1Md_Tf and L1Md_Gf subfamilies are similarly demethylated and elements of the independently emerging L1Md_A lineage remain methylated.
c. Violin plots for SINEs highlight intermediate methylation in sperm in both species,
though more so for humans. After fertilization, SINE methylation rapidly diminishes to near complete hypomethylation over preimplantation, similar to what is observed for intergenic sequence, before complete hypermethylation during ESC derivation in human or in postimplantation mouse E6.5 embryos. Taken globally, SINEs appear to be uniformly regulated regardless of subfamily, though differences in regulatory status for specific SINE elements may be reflected by their surrounding genomic context. Unfortunately, such inferences require higher genomic resolution than is currently available to distinguish the dynamics of specific integrations.
d-g. Violin plots of the four major LTR families present in mouse over the complete
preimplantation timeline. ERV1 elements (d) are hypermethylated in sperm and display a range of demethylation following fertilization and prompt remethylation upon implantation. In mouse, ERVK elements (e) are emergent and largely consist of the dominating,
constitutively hypermethylated IAP subfamilies. ERVL and MalR (ERVL-MalR) elements (f and g), the evolutionarily oldest mammalian LTRs, are hypermethylated in sperm and rapidly demethylated after fertilization frequently in association with their rapid zygotic induction.
h. Distribution (as boxplots) of per element expression and CpG density at different
methylation levels for LTR12c demonstrates negative correlation between methylation and expression. On average, LTR12C is hypomethylated in sperm and the early embryo, but demonstrates a consistent range of values at the level of single elements, with least methylated elments contributing the most to LTR12c expression. The CpG density of these elements corresponds to their degree of hypomethylation, suggesting that escape from de
novo methylation during spermatogenesis and preimplantation is maintained for specific
elements over generations. Once targeted, element expression is apparently restricted and its CpG density decays correspondingly. During ESC derivation, the kinetics of LTR12c methylation is more rapid for those of lower CpG density, as evident from p0 to p5 in the ESC lines. DNA methylation in the early embryo is therefore not exclusive to the regulation of different ERV1 subfamilies, but also affects the contribution of single elements to the broader transcriptional pattern. Bold line signifies the median, boxes and whiskers the 25th/75th and 2.5th/97.5th percentiles, respectively. Expression is calculated as the number of fragments per million that align to a given element divided by its length in kb (FPKM).
NIH-PA Author Manuscript
NIH-PA Author Manuscript
Extended Data Figure 10. L1PA subfamily dynamics during human early development
a. Expression composite averaged by genomic representation for L1HS through L1PA7
from oocyte through preimplantation and ESC derivation. Dynamic expression within the L1PA phylogeny is restricted to the same subfamilies that are demethylated by cleavage. The position of each respective 5′ UTR, the functional promoter for LINEs, is highlighted in the legend. Beneath these composites is the genomic representation to the full length consensus for each annotated L1PA subfamily, which demonstrates relative equivalence of 5′ UTR representation across different subfamilies, but an increasing proportion of truncated 3′ fragments with subfamily age (Methods).
b. The frequency of CpGs within aligned L1PA subfamilies, including 5′ UTR, Orf1/2, and
3′ UTR. CpGs are primarily enriched within the 5′UTR/promoter and become progressively CpG depleted with element age.
c. Complete composite plot of cleavage stage methylation values across aligned 5′ UTRs
from L1HS through L1PA7 as in Figure 6d. The multiple sequence alignment for each subfamily to the assembled consensus is visualized below each composite, with blue corresponding to conservation, black to divergence, and white to gaps or deletions. The x-axis represents position along the 5′ UTR and a portion of ORF1 for the L1HS consensus. CpG Frequency describes the level of conservation for individual CpGs found within single elements to the consensus. The ∼130 bp sequence present from L1PA7 to L1PA3b and absent from L1PA3a to L1HS is highlighted in pink, while two older sequences specific to L1PA7 are highlighted in gray.
NIH-PA Author Manuscript
NIH-PA Author Manuscript
d. Percent identity to the consensus for the extracted ∼130 bp insert sequence in elements
from L1PA7 through L1PA3b. Mean nucleotide identity to the consensus is 85%, with a median of 89%.
Supplementary Material
Refer to Web version on PubMed Central for supplementary material.
Acknowledgments
We would like to thank all members of the Meissner, Regev and Eggan laboratories, in particular M. Ziller for critical reading of the text and K. Koszka for supervising human embryo thawing. We also thank D. Sakkus and R. Holmes of Boston IVF for clinical assessment of embryo morphology and viability as well as S. Levine, M. Gravina and K. Thai from the MIT BioMicro Center. A.R. is an investigator of the Merkin Foundation for Stem Cell Research at the Broad Institute. This work was supported by the Harvard Stem Cell Institute (K.E.), and NIH Pioneer Award (5DP1OD003958), the Burroughs Wellcome Career Award at the Scientific Interface and HHMI (to A.R. and K.E.), P01GM099117 (to A.M. and K. E.) and the New York Stem Cell Foundation (to A.M.) and a Center for Excellence in Genome Science from the NHGRI (1P50HG006193-01, to A.R. and A.M.). A.M. is a Robertson Investigator of the New York Stem Cell Foundation.
References
1. Suzuki MM, Bird A. DNA methylation landscapes: provocative insights from epigenomics. Nat Rev Genet. 2008; 9:465–476.10.1038/nrg2341 [PubMed: 18463664]
2. Stadler MB, et al. DNA-binding factors shape the mouse methylome at distal regulatory regions. Nature. 2011; 480:490–495.10.1038/nature10716 [PubMed: 22170606]
3. Ziller MJ, et al. Charting a dynamic DNA methylation landscape of the human genome. Nature. 2013:477–481.10.1038/nature12433 [PubMed: 23925113]
4. Lane N, et al. Resistance of IAPs to methylation reprogramming may provide a mechanism for epigenetic inheritance in the mouse. Genesis. 2003; 35:88–93.10.1002/gene.10168 [PubMed: 12533790]
5. Smallwood SA, et al. Dynamic CpG island methylation landscape in oocytes and preimplantation embryos. Nat Genet. 2011; 43:811–814.10.1038/ng.864 [PubMed: 21706000]
6. Kobayashi H, et al. Contribution of intragenic DNA methylation in mouse gametic DNA
methylomes to establish oocyte-specific heritable marks. PLoS Genet. 2012; 8:e1002440.10.1371/ journal.pgen.1002440 [PubMed: 22242016]
7. Smith ZD, et al. A unique regulatory phase of DNA methylation in the early mammalian embryo. Nature. 2012; 484:339–344.10.1038/nature10960 [PubMed: 22456710]
8. Fulka H, Mrazek M, Tepla O, Fulka J Jr. DNA methylation pattern in human zygotes and
developing embryos. Reproduction. 2004; 128:703–708.10.1530/rep.1.00217 [PubMed: 15579587] 9. Santos F, et al. Evaluation of epigenetic marks in human embryos derived from IVF and ICSI. Hum
Reprod. 2010; 25:2387–2395.10.1093/humrep/deq151 [PubMed: 20634187]
10. Lepikhov K, et al. Evidence for conserved DNA and histone H3 methylation reprogramming in mouse, bovine and rabbit zygotes. Epigenetics Chromatin. 2008; 1:8.10.1186/1756-8935-1-8 [PubMed: 19014417]
11. Molaro A, et al. Sperm methylation profiles reveal features of epigenetic inheritance and evolution in primates. Cell. 2011; 146:1029–1041.10.1016/j.cell.2011.08.016 [PubMed: 21925323] 12. Hirasawa R, et al. Maternal and zygotic Dnmt1 are necessary and sufficient for the maintenance of
DNA methylation imprints during preimplantation development. Genes Dev. 2008; 22:1607– 1616.10.1101/gad.1667008 [PubMed: 18559477]
13. Yan L, et al. Single-cell RNA-Seq profiling of human preimplantation embryos and embryonic stem cells. Nat Struct Mol Biol. 2013; 20:1131–1139.10.1038/nsmb.2660 [PubMed: 23934149] 14. Wu G, et al. Establishment of totipotency does not depend on Oct4A. Nat Cell Biol. 2013;
15:1089–1097.10.1038/ncb2816 [PubMed: 23934214]
NIH-PA Author Manuscript
NIH-PA Author Manuscript
15. Hackett JA, Surani MA. DNA methylation dynamics during the mammalian life cycle. Philos Trans R Soc Lond B Biol Sci. 2013; 368:20110328.10.1098/rstb.2011.0328 [PubMed: 23166392] 16. Borgel J, et al. Targets and dynamics of promoter DNA methylation during early mouse
development. Nat Genet. 2010; 42:1093–1100.10.1038/ng.708 [PubMed: 21057502]
17. Mertineit C, et al. Sex-specific exons control DNA methyltransferase in mammalian germ cells. Development. 1998; 125:889–897. [PubMed: 9449671]
18. Smits G, et al. Conservation of the H19 noncoding RNA and H19-IGF2 imprinting mechanism in therians. Nat Genet. 2008; 40:971–976.10.1038/ng.168 [PubMed: 18587395]
19. Kelley D, Rinn J. Transposable elements reveal a stem cell-specific class of long noncoding RNAs. Genome Biol. 2012; 13:R107.10.1186/gb-2012-13-11-r107 [PubMed: 23181609]
20. Fuchs NV, et al. Human endogenous retrovirus K (HML-2) RNA and protein expression is a marker for human embryonic and induced pluripotent stem cells. Retrovirology. 2013; 10:115.10.1186/1742-4690-10-115 [PubMed: 24156636]
21. Lu X, et al. The retrovirus HERVH is a long noncoding RNA required for human embryonic stem cell identity. Nat Struct Mol Biol. 2014; 21:423–425.10.1038/nsmb.2799 [PubMed: 24681886] 22. Khan H, Smit A, Boissinot S. Molecular evolution and tempo of amplification of human LINE-1
retrotransposons since the origin of primates. Genome Res. 2006; 16:78–87.10.1101/gr.4001406 [PubMed: 16344559]
23. Boissinot S, Entezam A, Furano AV. Selection against deleterious LINE-1-containing loci in the human lineage. Mol Biol Evol. 2001; 18:926–935. [PubMed: 11371580]
24. Kelsey G, Feil R. New insights into establishment and maintenance of DNA methylation imprints in mammals. Philos Trans R Soc Lond B Biol Sci. 2013; 368:20110336.10.1098/rstb.2011.0336 [PubMed: 23166397]
25. Hancks DC, Kazazian HH Jr. Active human retrotransposons: variation and disease. Curr Opin Genet Dev. 2012; 22:191–203.10.1016/j.gde.2012.02.006 [PubMed: 22406018]
26. Chen AE, et al. Optimal timing of inner cell mass isolation increases the efficiency of human embryonic stem cell derivation and allows generation of sibling cell lines. Cell Stem Cell. 2009; 4:103–106.10.1016/j.stem.2008.12.001 [PubMed: 19200798]
27. Chenoweth JG, Tesar PJ. Isolation and maintenance of mouse epiblast stem cells. Methods Mol Biol. 2010; 636:25–44.10.1007/978-1-60761-691-7_2 [PubMed: 20336514]
28. Meissner A, et al. Genome-scale DNA methylation maps of pluripotent and differentiated cells. Nature. 2008; 454:766–770.10.1038/nature07107 [PubMed: 18600261]
29. Creyghton MP, et al. Histone H3K27ac separates active from poised enhancers and predicts developmental state. Proc Natl Acad Sci U S A. 2010; 107:21931–21936.10.1073/pnas. 1016071107 [PubMed: 21106759]
30. Woodfine K, Huddleston JE, Murrell A. Quantitative analysis of DNA methylation at all human imprinted regions reveals preservation of epigenetic stability in adult somatic tissue. Epigenetics Chromatin. 2011; 4:1.10.1186/1756-8935-4-1 [PubMed: 21281512]
31. Storey JD, Tibshirani R. Statistical significance for genomewide studies. Proc Natl Acad Sci U S A. 2003; 100:9440–9445.10.1073/pnas.1530509100 [PubMed: 12883005]
NIH-PA Author Manuscript
NIH-PA Author Manuscript
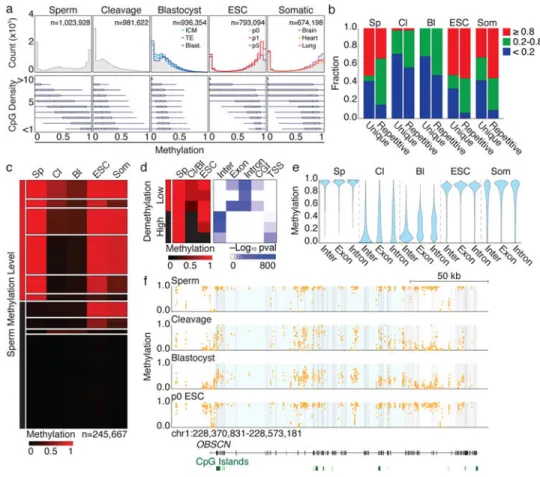
Figure 1. Human preimplantation embryos are globally hypomethylated
a. Top. DNA methylation across 100 bp tiles for human sperm, preimplantation embryos,
including the ICM and TE, ESC derivation from outgrowth to 5th passage, and somatic fetal tissues representing all germ layers. Gray highlights the average. Bottom. Boxplots of methylationat different local CpG densities. Bulls-eye signifies the median, boxes and lines the 25th/75th and 2.5th/97.5th percentiles, respectively.
b. Bar plots of 100 bp tiles segregated by non-repetitive (unique) or repetitive designation
and binned by methylation status. Sp, sperm; Cl, cleavage; Bl, blastocyst;Som, somatic. “ESC” and “Som” refer to the average of these timepoints.
c. Non-repetitive 100 bp tiles are clustered via k-means into 10 dynamics. Sperm
hypermethylated sequences follow three general trajectories: persistent maintenance, incomplete or complete demethylation. Other dynamics include sperm specific
hypermethylation and sperm/early embryonic hypomethylation that is de novo methylated in ESCs. Finally, 3,586 tiles are hypomethylated in sperm and ESCs but methylated in
embryos, representing transient imprint-like signatures.
d. Dynamics for sperm hypermethylated, non-repetitive tiles as clustered in (c). Left
heatmap, per cluster average of tiles. Right heatmap, –log10 p value of hypergeometric
enrichment for each cluster for intergenic, exonic, intronic, CGI, or TSS annotations using sperm hypermethylated regions as the background.
e. Violin plot forsperm hypermethylated intergenic (inter), exonic, and intronic features.
NIH-PA Author Manuscript
NIH-PA Author Manuscript
f. The OBSCN gene exhibits high inter- and intra-genic methylation and an unmethylated
promoter in sperm and ESCs. In cleavage embryos, a 130 kb region, highlighted in blue, remains specifically methylated while the periphery is demethylated.
NIH-PA Author Manuscript
NIH-PA Author Manuscript
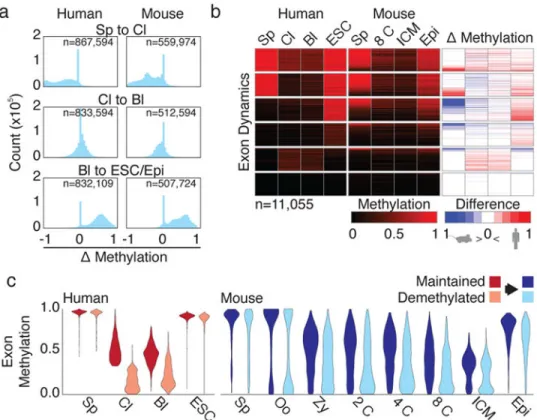
Figure 2. Human preimplantation dynamics are globally similar to mouse
a. Histograms of methylation changes (Δ methylation) for 100 bp tiles across human and
mouse preimplantation from fertilization (Sp to Cl) through preimplantation (Cl to Bl) to global remethylation at implantation, as measured from blastocyst to ESC in human and ICM to E6.5 epiblast in mouse (Bl to ESC/Epi).
b. Exons clustered by dynamics in human with equivalent methylation values for
orthologous sequences in mouse. Δ methylation heatmap displays the difference in methylation for matched timepoints.
c. Violin plots of orthologous human sperm hypermethylated exons classified as maintained
vs demethylated and measured over human and mouse preimplantation.
NIH-PA Author Manuscript
NIH-PA Author Manuscript
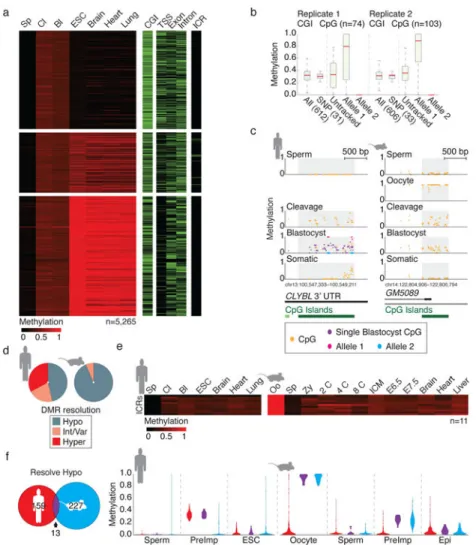
Figure 3. Transient maternal DMRs target a divergent set of CpG island promoters
a. Heatmap of 5,265 100 bp tiles consistent with maternally contributed monoallelic
methylation (Methods). Tiles are partitioned according to their hypo (≤0.2), intermediate/ variable (0.2<x<0.8) or hypermethylated (≥0.8) resolution in ESCs. Feature annotations are included as separate heatmaps.
b. Boxplots of CGI DMR methylation for two independent single blastocysts, with
heterozygous SNP-linked CpGs highlighted. Within each replicate, 31 and 33 CGI DMRs contain CpGs that could be assigned to parental loci. In each case, DNA methylation is restricted to only one of the two alleles. Untracked refers to the inferred methylation status prior to haplotype segregation. Red line signifies the median, boxes and whiskers the 25th/ 75th and 2.5th/97.5th percentiles.
c. Single CpG track of a conserved preimplantation-specific DMR in human and mouse.
Human blastocyst data includes information from the pooled sample as well as for a single blastocyst replicate (purple) with allele-tracked methylation for 10 CpGs highlighted in pink and blue. Annotated CGIs are included below.
d. Resolution of CGIs that behave as maternal DMRs in human and mouse.
e. Heatmap of orthologous ICRs over human and mouse preimplantation development.
NIH-PA Author Manuscript
NIH-PA Author Manuscript
f. Orthologous hypomethylation-resolving CGID MRs in human and mouse share only 13
equivalently regulated regions. When methylation values of mouse or human specific DMRs are tracked in the alternate species, they are constitutively hypomethylated, indicating that oogenesis targets equivalent genomic features but at species-specific sequences. PreImp refers to the average value for cleavage and blastocyst in human or 8 cell and ICM in mouse.
NIH-PA Author Manuscript
NIH-PA Author Manuscript
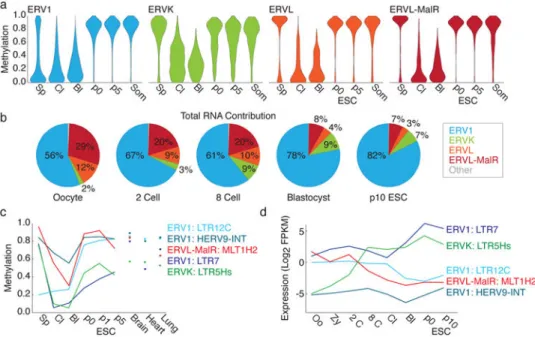
Figure 4. LTR subfamily dynamics are divided into early and late preimplantation phases
a. Violin plots forthe four LTR families present in human over early development and ESC
derivation.
b. Pie charts of LTR family expression calculated as the number of fragments per million
(FPM) that align to elements with in the family.
c. Mean methylation of notable ERV1, ERVK, and MalR subfamilies. Three ERV1
subfamilies are included to represent discrete dynamics: gamete/early embryonic hypomethylation (LTR12c), constitutive methylation (HERV9-INT) and rapid demethylation (LTR7). The ERVK subfamily LTR5Hs is also demethylated.
d. Expression dynamics for the same subfamilies in (c). LTR12c is expressed early and
downregulated in the blastocyst. Alternatively, LTR7 is expressed throughout, but
upregulated in the blastocyst and maintained in hESCs, where it accounts for the majority of ERV1 transcripts. Like LTR7, LTR5Hs is only intermediately methylated during ESC derivation and is embryonically induced. Alternatively, the ERV1 HERV9-INT remains repressed. MLT1H2 is the prevailing MalR transcribed in the oocyte and is lost after fertilization. Expression is the fragments per million that align to subfamily elements, divided by the kb annotated as the subfamily in the genome (FPKM).
NIH-PA Author Manuscript
NIH-PA Author Manuscript
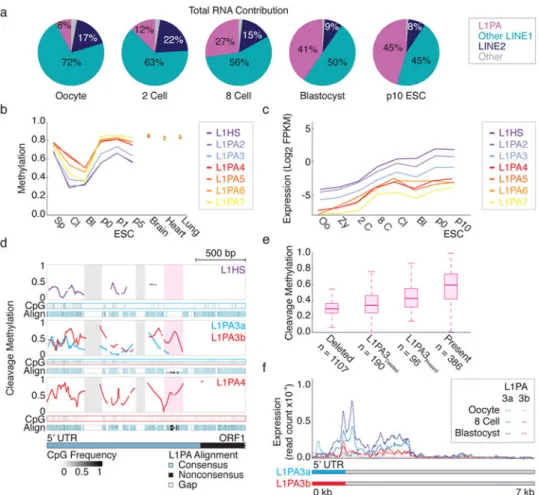
Figure 5. Emergent L1PA subfamilies escape DNA methylation-based repression during preimplantation
a. Pie charts of the LINE expression divided into the L1PA subfamily, other LINE1 and
LINE2 subfamilies. Total expression is calculated as the number of fragments per million (FPM) that align to family elements.
b. Mean methylation values for the most recent L1PA subfamilies. In cleavage embryos,
L1HS through L1PA3 are demethylated and maintain these levels through the blastocyst.
c. Expression dynamics for the same subfamilies in (c) over preimplantation and in ESCs.
The three youngest L1PA subfamilies are induced by the 8cell stage. Expression is the number of fragments per million that align to subfamily elements, divided the kb annotated as the subfamily in the genome (FPKM).
d. Composite plot of cleavage stage methylation values across aligned 5′ UTRs in L1PA
subfamilies. The composite for L1PA3 is split by the presence (red) or absence (blue) of a
∼130 bp sequence that distinguishes L1PA3b from L1PA3a and demarcates methylation
values between older and newer subfamilies (highlighted in pink). Multiple sequence alignment for each subfamily to the assembled consensus is below each composite, with blue corresponding to conservation, black to divergence, and white to gaps or deletions. The x-axis represents position along the L1HS 5′ UTR and a portion of ORF1. CpG Frequency describes per CpG conservation within single elements to the consensus. Two older sequences specific to L1PA7 are highlighted in gray.
NIH-PA Author Manuscript
NIH-PA Author Manuscript
e. Boxplot of L1PAmethylation in cleavage embryos, sorted by the presence of the ∼130 bp
sequence for all elements and L1PA3 specifically. Preimplantation methylation is higher for elements that contain this insert. Bold line signifies the median, boxes and whiskers the 25th/75th and 2.5th/97.5th percentiles.
f. Expression composite of full-length insert deleted L1PA3a and insert containing L1PA3b
subfamilies in oocyte, 8 cell and blastocyst stage embryos. Transcriptional induction is not apparent until after fertilization and is specific to L1PA3a. Read count is the read coverage normalized by total reads (Methods).