850
CONCISE COMMUNICATIONS
Cell-Associated HIV-1 RNA in Blood as Indicator of Virus Load in Lymph
Nodes
S. Yerly,1O. T. Rutschmann,2M. Opravil,4F. Marchal,3 B. Hirschel,2L. Perrin,1and the Swiss HIV Cohort Studya
1Laboratory of Virology,2AIDS Center, Division of Infectious Diseases, and3Clinic ENT, Geneva University Hospital, Geneva; 4Division of Infectious Diseases, Zurich University Hospital, Zurich, Switzerland We have developed sensitive assays for viremia and cell-associated human immunodeficiency
virus type 1 (HIV-1) RNA and DNA to assess the predictive value of virological parameters determined in blood for virus load in lymph nodes (LNs). Eighteen patients were included; 13 received stavudine/didanosine/hydroxyurea and 5 stavudine/didanosine, and all had viremia !500 copies/mL for13 months. At the time of LN biopsy (median, 10 months), the median viremia was 2.09 log copies/mL (range,!0.70–3.34). Cell-associated HIV-1 RNA and DNA were detectable in blood and LNs of all patients. The median cell-associated RNA and DNA were 2.16 log copies/106
cells and 2.60 log copies/106
cells in blood versus 4.31 log RNA copies/ 106
cells and 3.26 log DNA copies/106
cells in LNs. Regression analysis shows that, in treated patients with sustained low viremia, cell-associated RNA and DNA in blood are better pre-dictors of virus load in LNs than viremia.
The virological response in human immunodeficiency virus type 1 (HIV-1)–infected patients on antiretroviral therapy is routinely assessed by the measurement of plasma HIV-1 RNA. Because lymphoid tissue is the main site of production and storage of the virus [1], lymph node biopsies have been used to evaluate residual virus load in patients with low or unde-tectable viremia [2–4]. In several studies, viremia below the limit of detection (LOD), that is,!500 or!50 copies/mL, was
as-sociated with a marked decrease of viral deposits in follicular denditric cells (FDCs) and in cells producing HIV-1 RNA in lymph nodes [2–7]. However, in most instances, HIV-1 RNA was still detectable in lymph nodes of patients with viremia below detection limits, indicating that complete clearance of HIV-1–producing cells was not achieved [3, 5, 7].
Lymph node biopsy is a surgical procedure that cannot be often repeated, whereas alternative procedures (i.e., needle as-piration of lymph node cells) provide an insufficient number of cells for in-depth virological evaluation, in particular in patients
Received 30 November 1998; revised 9 April 1999; electronically published 4 August 1999.
Presented in part: 12th World AIDS Conference, Geneva, Switzerland, June 1998.
All patients included in this study have signed the informed consent form approved by the local ethical committee.
Grant support: Swiss National AIDS Research Program (3100.052403.97) and the Swiss HIV Cohort Study.
a Members listed after the text.
Reprints or correspondence: Professor Luc Perrin, Laboratory of Virol-ogy, Geneva University Hospital, 1211 Geneva 14, Switzerland (luc.perrin@ hcuge.ch).
The Journal of Infectious Diseases 1999; 180:850–3
q 1999 by the Infectious Diseases Society of America. All rights reserved. 0022-1899/1999/18003-0038$02.00
with low viremia [8]. In contrast, peripheral blood mononuclear cells (PBMC) are easily accessible. We have thus developed highly sensitive assays for viremia and cell-associated HIV-1 RNA and DNA to assess the predictive value of virological parameters determined in blood for virus load in lymph nodes. In the present investigation, this approach was evaluated in a cross-sectional study including treated patients with viremia
!500 RNA copies/mL.
Methods
Patients. Patients were participants in a randomized, con-trolled clinical trial examining the effect of the adjunction of hy-droxyurea, 500 mg every 12 h, to didanosine, 200 mg every 12 h, plus stavudine, 40 mg every 12 h [9]. Patients included in this virological substudy were selected according to the following cri-teria: at least 6 months of therapy and plasma HIV-1 RNA!500
copies/mL for at least 3 months. Lymph node biopsy was proposed to the 24 patients fulfilling these criteria; 18 signed the informed consent form approved by the local ethical committee.
Lymph node biopsies. Inguinal biopsy was performed under local anesthesia. Only 40% of the patients had palpable lymph nodes; the inguinal area was selected because local exploration there is easier than in other locations. Lymph node tissue was minced with a scalpel in tissue culture medium, and the cells were teased out by use of small tweezers. The lymph node mononuclear cells (LNMC) were isolated by gradient centrifugation (Ficoll Hy-paque; Pharmacia, Dubendorf, Switzerland), and aliquots of
cells were stored in liquid nitrogen.
6
23 10
Viremia quantitation. Plasma HIV-1 RNA was quantified first by use of the standard Amplicor HIV Monitor, version 1.5 (Roche Diagnostics, Basel, Switzerland). The samples with RNA!500
JID 1999;180 (September) Virus Load in Blood and Lymph Nodes 851
Table 1. Virological and immunological parameters in lymph node and peripheral blood.
Parameter Peripheral blood Lymph node Pa
Viremia (log RNA copies/mL) 2.09 (0.70–3.34) — —
Cell-associated RNA (log copies/106
cells) 2.16 (0.70–3.14) 4.31 (1.23–5.27) !.001
Cell-associated DNA (log copies/106
cells) 2.60 (0.78–3.45) 3.26 (2.06–3.79) !.001
CD4 cells (%) 26 (15–38) 48 (25–59) !.001
CD8 cells (%) 50 (31–64) 26 (14–46) !.001
Ratio CD4/CD8 0.55 (0.26–1.23) 1.98 (0.78–3.36) !.001
NOTE. Values are median (range). a
Paired Wilcoxon test.
Monitor assay [10]. Briefly, 1 mL of plasma was centrifuged at 50,000 g for 80 min at 47C. After removal of plasma, the next steps were performed according to the manufacturer’s instructions, with the exception of a reduction (7.33) in the input of internal quan-titative standard (IQS) and in the volume of specimen diluent (55 vs. 400 mL) and a prolongation to 15 min of the substrate incu-bation step. The LOD is 5 RNA copies/mL, and the mean coef-ficient of variation is 40% (range, 23%–52%). A value of 5 HIV-1 RNA copies/mL (0.70 log) was attributed to patients with HIV-1 RNA below the LOD.
Cell-associated HIV-1 RNA and DNA quantitation. PBMC were isolated from 7 mL of EDTA blood by gradient centrifugation (Ficoll Hypaque; Pharmacia). Cell-associated HIV-1 RNA and DNA were measured on the same cell aliquot by use of the reagents of the Amplicor HIV-1 Monitor assay (Roche Diagnostics). Pellets
of 6 PBMC or LNMC were lysed in 600 mL of lysis
con-23 10
taining RNA IQS at 50% of the concentration recommended. After adding 600 mL of 100% isopropanol, half of the lysate was trans-ferred into a new tube for RNA quantitation, and the 2 tubes were centrifuged at 16,000 g for 15 min. After ethanol washing, nucleic acids were resuspended in 20 mL of buffer containing 10 mM Tris-HCl at pH 7.4, 5 mM MgCl2, 50 mM KCl, and 0.5 mM CaCl2.
For cell-associated HIV-1 RNA quantitation, the nucleic acid preparation was incubated for 1 h at 377C with 20 units of DNase I RNase-free (Boehringer, Mannheim, Germany), then for 5 min at 957C, and diluted in 80 mL of specimen diluent. Then 50 mL of
RNA preparation, corresponding to 5cells, was amplified
6.253 10
according to manufacturer’s instructions by use of primers located in the gag gene.
For cell-associated HIV-1 DNA quantitation, the nucleic acid preparation was incubated 1 h at 377C with 10 mg of RNase A DNase-free (Sigma, Buchs, Switzerland) and diluted in 80 mL of specimen diluent. Then 50 mL of DNA preparation was added to mastermix buffer containing 25 copies of DNA IQS (Roche Di-agnostics) and directly amplified, bypassing the reverse transcrip-tase incubation step. Negative controls included PBMC from nor-mal blood donors. Results are expressed in log10HIV-1 RNA or
DNA copies/106
PBMC or LNMC.
The mean coefficient of variation, evaluated by use of dilutions of the 8E5 LAV cell line, was 12% (range, 3%–26%) for cell-as-sociated RNA and 18% (range, 2%–29%) for cell-ascell-as-sociated DNA. The LOD of cell-associated RNA was approximately 3 RNA cop-ies/106
cells (9/9 replicates containing 10 and 3.3 RNA copies/106
PBMC and 4/6 replicates containing 1.1 RNA copies/106PBMC
were found to be positive). The LOD of cell-associated DNA was approximately 5 DNA copies/106
cells (10/10, 8/8, and 4/8 replicates
containing 10, 5, and 2.5 DNA copies/106
PBMC, respectively, were found to be positive).
Immunological parameters. CD3, CD4, and CD8 lymphocyte cell counts were determined by flow cytometry (EPICS IV; Coulter, Nyon, Switzerland) by use of fluoresceinated T3,
DAKO-T8, and R-Phycoerythrin DAKO-CD4 (Dako, Glostrup,
Denmark).
Statistical analysis. Associations between parameters were as-sessed by use of the Spearman rank correlation analysis. Com-parisons between parameters were done by use of the paired
Wil-coxon-test. Assessment of parameters associated with
cell-associated RNA in lymph node was performed by use of uni-variate and multiuni-variate linear regression models. To allow for comparisons between variables, we computed the relative predictive ability (RPA) of each predictor, that is, the relative percentage of variance explained, compared with the best predictor. The RPA is the F-statistic of a predictor divided by the F-statistic of the best predictor [11].
Results
Patients. Eighteen patients were included; 13 patients ceived didanosine/stavudine/hydroxyurea, and 5 patients re-ceived didanosine/stavudine/placebo. The median baseline CD4 cell count was 347/mm3 (range, 220–482), and the median plasma HIV-1 RNA was 4.50 log copies/mL (range, 3.20–5.08). Lymph node biopsies were performed 6–12 months after treat-ment initiation (median, 10 months). At the time of lymph node biopsy, the median CD4 cell count was 512/mm3 (range, 261–648) in blood. The median CD4 cell count change from before therapy was1121/mm3(range,254 to 1360). The per-centage of CD4 cells was approximately 2-fold higher in lymph nodes than in blood (table 1).
Quantitation of cell-associated HIV-1 RNA and DNA. The
median decrease of viremia from before therapy to the time of lymph node biopsy was 22.08 log RNA copies/mL (range, 23.60 to –1.16). The median time to first viremia!500 RNA
copies/mL was 1 month (range, 1–3), and the median duration with viremia!500 RNA copies/mL was 5 months (range, 3–11).
Virological parameters measured in blood and lymph nodes at the time of lymph node biopsy are reported in table 1. The median plasma RNA was 2.09 log copies/mL. Eight patients had plasma RNA!50 copies/mL, and 3 of them had!5 copies/
852 Yerly et al. JID 1999;180 (September)
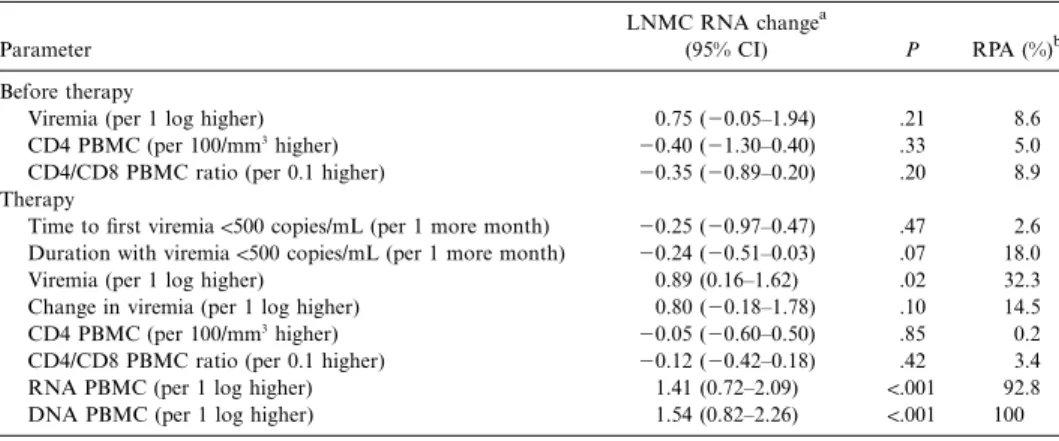
Table 2. Predictors of cell-associated RNA in lymph node (regression analysis).
Parameter
LNMC RNA changea
(95% CI) P RPA (%)b
Before therapy
Viremia (per 1 log higher) 0.75 (20.05–1.94) .21 8.6
CD4 PBMC (per 100/mm3
higher) 20.40 (21.30–0.40) .33 5.0
CD4/CD8 PBMC ratio (per 0.1 higher) 20.35 (20.89–0.20) .20 8.9
Therapy
Time to first viremia!500 copies/mL (per 1 more month) 20.25 (20.97–0.47) .47 2.6
Duration with viremia!500 copies/mL (per 1 more month) 20.24 (20.51–0.03) .07 18.0
Viremia (per 1 log higher) 0.89 (0.16–1.62) .02 32.3
Change in viremia (per 1 log higher) 0.80 (20.18–1.78) .10 14.5
CD4 PBMC (per 100/mm3
higher) 20.05 (20.60–0.50) .85 0.2
CD4/CD8 PBMC ratio (per 0.1 higher) 20.12 (20.42–0.18) .42 3.4
RNA PBMC (per 1 log higher) 1.41 (0.72–2.09) !.001 92.8
DNA PBMC (per 1 log higher) 1.54 (0.82–2.26) !.001 100
NOTE. LNMC, lymph node mononuclear cell; CI, confidence interval; PBMC, peripheral blood mononuclear cells.
a
Log RNA copies/106
LNMC. b
RPA, relative predictive ability. The RPA is the F-statistic of a predictor divided by the F-statistic of the best predictor. The best predictor was DNA PBMC (RPA value of 100%).
mL; all were on hydroxyurea. Cell-associated RNA and DNA were detectable in all patients in both blood and lymph nodes. Plasma RNA/mL was, on average, 44-fold lower (95% confi-dence interval [CI], 11- to 174-fold) than LNMC-associated RNA/106cells, and PBMC-associated RNA was, on average, 34-fold lower (95% CI, 11- to 107-fold) than LNMC-associated RNA.
A strong correlation was observed between cell-associated RNA and DNA in both PBMC (r5 .80 P, !.001) and LNMC (r5 .82 P, !.001).There was only a weak correlation between plasma RNA and PBMC-associated RNA (r5 .42 P 5 .08, ) or PBMC-associated DNA (r5 .40 P 5 .10, ). Similarly, a weak correlation was observed between plasma RNA and both LNMC-associated RNA (r5 .46 P 5 .05, ) and LNMC-asso-ciated DNA (r5 .58 P 5 .02, ). In contrast, a strong correlation was found between PBMC-associated RNA and LNMC-as-sociated RNA (r5 .67 P 5 .002, ) or LNMC-associated DNA (r5 .78 P, !.001).
Parameters predictive of virus load in lymph nodes. In uni-variate linear regression analysis, plasma RNA, PBMC-asso-ciated RNA, and DNA determined at the time of lymph node biopsy significantly predict LNMC-associated RNA (table 2). Pretherapy plasma RNA, CD4 cell counts, and the CD4/CD8 ratio did not predict LNMC-associated RNA, but the duration of viremia!500 copies/mL did. To compare predictors, we
cal-culated the relative predictive ability (RPA) for each parameter; the RPA values of PBMC-associated RNA and DNA were in the same range and were 3 times higher than that of plasma RNA.
Discussion
In this investigation, we show that in treated HIV-1 patients with sustained low viremia, cell-associated RNA and DNA in
blood are better predictors of virus load in lymph nodes than viremia.
Patients selected for this substudy were included in a clinical trial assessing the effect of the addition of hydroxyurea to com-bined therapy with didanosine and stavudine [9]. As reported previously, the adjunction of hydroxyurea to a didanosine-con-taining regimen is associated with an additional decrease of viremia [9, 12]. As the main inclusion criterion for this study was a viremia level!500 copies/mL for at least 3 months, we
included more patients receiving didanosine/stavudine plus hy-droxyurea than receiving didanosine/stavudine plus placebo, precluding comparative analysis.
The 3 parameters evaluated in blood (plasma RNA, cell-associated RNA, and DNA) had similar levels of absolute sen-sitivity per unit volume, since approximately1–33 106PBMC are contained in 1 mL of blood. Comparison of plasma RNA with PBMC-associated RNA indicates a higher sensitivity of cell-associated RNA, since the 3 patients with plasma RNA!5
copies/mL had detectable PBMC-associated RNA. This sug-gests that, even in patients with plasma RNA!5 copies/mL,
circulating cells containing HIV-1 RNA persist. These data are in agreement with previous data showing the persistence of replication-competent, infected CD4 cells in the blood of pa-tients on highly active antiretroviral therapy with viremia!50
copies/mL [13].
We found, as previously reported, higher concentrations of cell-associated RNA in lymph nodes than in blood [2–5]. Sev-eral factors might explain this observation, including a release into blood restricted to cells with low levels of replication, rapid killing in the blood of cells engaged in active viral replication, impaired T cell functions in lymphoid tissues [14], or impaired penetration of antiretroviral drugs into lymph nodes. Interest-ingly, in treated patients with low viremia, only a weak cor-relation was observed between plasma RNA and LNMC-as-sociated RNA, whereas a stronger correlation was observed
JID 1999;180 (September) Virus Load in Blood and Lymph Nodes 853
between PBMC- and LNMC-associated RNA. Our preliminary data indicate that in treated patients, PBMC-associated RNA levels are better indicators of virus load in lymph nodes than plasma RNA, as confirmed by linear regression analysis. One likely explanation is that free viruses are rapidly removed from the blood through trapping in the FDC network and/or mac-rophages, whereas both acutely and latently infected cells in blood have a longer half-life [5, 15].
In conclusion, the main finding of this preliminary study is that the quantitation of cell-associated RNA and DNA in PBMC provides an excellent estimate of HIV-1 virus load in lymphoid tissues. These assays may represent in the future new standards for the assessment of treatment efficacy in patients with undetectable or low viremia.
Acknowledgments
We thank E. Ramirez and K. Zollinger for excellent technical help, Dr. C. Junet and Dr. D. Leduc for including patients in this study, Dr. V. Soravia-Dunand for helpful discussion, and Dr. S. Kwok (Roche Molecular Systems, Alameda, CA) for providing internal quantitative standard for cell-associated DNA assay.
Members of the Swiss HIV Cohort Study: M. Battegay (Scientific Board Cochairman), E. Bernasconi, Ph. Bu¨rgisser, M. Egger, P. Erb, W. Fierz, M. Flepp (Clinical Group Chairman), P. Francioli (President of the SHCS, Centre Hospitalier Universitaire Vaudois, Lausanne), H. J. Furrer, P. Grob, B. Hirschel (Scientific Board Cochairman), B. Led-ergerber, R. Malinverni, L. Matter (Laboratory Group Chairman), A. Meynard, M. Opravil, F. Paccaud, G. Pantaleo, L. Perrin, W. Pichler, J.-C. Piffaretti, M. Rickenbach (Data Center Manager), P. Sudre, J. Schupbach, A. Telenti, P. Vernazza, and R. Weber.
References
1. Pantaleo G, Graziosi C, Butini L, et al. Lymphoid organs function as major reservoirs for human immunodeficiency virus. Proc Natl Acad Sci USA 1991; 88:9838–42.
2. Perrin L, Yerly S, Marchal F, et al. Viral burden in lymph nodes and blood
of subjects with primary human immunodeficiency virus type 1 infection on bitherapy. J Infect Dis 1998; 177:1497–501.
3. Wong JK, Gunthard HF, Havlir DV, et al. Reduction of HIV-1 in blood and lymph nodes following potent antiretroviral therapy and the virologic correlates of treatment failure. Proc Natl Acad Sci USA 1997; 94:12574–9. 4. Lafeuillade A, Chollet L, Hittinger G, Profizi N, Costes O, Poggi C. Residual human immunodeficiency virus type 1 RNA in lymphoid tissue of patients with sustained plasma RNA of!200 copies/mL. J Infect Dis 1998; 177:
235–8.
5. Haase AT, Henry K, Zupancic M, et al. Quantitative image analysis of HIV-1 infection in lymphoid tissue. Science HIV-1996; 274:985–9.
6. Cavert W, Notermans DW, Staskus K, et al. Kinetics of response in lymphoid tissues to antiretroviral therapy of HIV-1 infection. Science 1997; 276: 960–4.
7. Notermans DW, Jurriaans S, de Wolf F, et al. Decrease of HIV-1 RNA levels in lymphoid tissue and peripheral blood during treatment with ritonavir, lamivudine and zidovudine. AIDS 1998; 12:167–73.
8. Meylan PR, Burgisser P, Weyrich-Suter C, Spertini F. viral load and im-munophenotype of cells obtained from lymph nodes by fine needle as-piration as compared with peripheral blood cells in HIV-infected patients. J Acquir Immune Defic Syndr Hum Retrovirol 1996; 13:39–47. 9. Rutschmann O, Opravil M, Iten A, et al. A placebo-controlled trial of
di-danosine plus stavudine, with and without hydroxyurea, for HIV infec-tion. AIDS 1998; 12:F71–7.
10. Schockmel G, Yerly S, Perrin L. Detection of low HIV-1 RNA levels in plasma. J Acquir Immune Defic Syndr Hum Retrovirol 1997; 14:179–83. 11. McHomey CA, Ware JE, Raczek AE. The MOS 36-Item Short-Form Health Survey (SF-36): II. Psychometric and clinical tests of validity in measuring physical and mental health construct. Med Care 1993; 31:247–63. 12. Montaner JSG, Zala C, Conway B, et al. A pilot study of hydroxyurea among
patients with advanced human immunodeficiency virus (HIV) disease re-ceiving chronic didanosine therapy: Canadian HIV Trials Network Pro-tocol 088. J Infect Dis 1997; 175:801–6.
13. Wong JK, Hezareh M, Gu¨nthard HF, et al. Recovery of replication-com-petent HIV despite prolonged suppression of plasma viremia. Science 1997; 278:1291–5.
14. Andersson J, Racz P, Tenner-Racz, et al. Defect in cytolytic effector molecules in lymphoid tissue during primary HIV-1 infection is a very early mech-anism of immune dysfunction [abstract LB3b]. In: Program and abstracts of the 6th Conference on Retroviruses and Opportunistic Infections (Chi-cago). Alexandria, Virginia: Foundation for Retrovirology and Human Health, 1999:205.
15. Perelson AS, Neumann AU, Markowitz M, Leonard JM, Ho DD. HIV-1 dynamics in vivo: virion clearance rate, infected cell life-span, and viral generation time. Science 1996; 271:1582–6.