HAL Id: hal-00463315
https://hal.archives-ouvertes.fr/hal-00463315
Submitted on 11 Mar 2010
HAL is a multi-disciplinary open access
archive for the deposit and dissemination of
sci-entific research documents, whether they are
pub-lished or not. The documents may come from
teaching and research institutions in France or
abroad, or from public or private research centers.
L’archive ouverte pluridisciplinaire HAL, est
destinée au dépôt et à la diffusion de documents
scientifiques de niveau recherche, publiés ou non,
émanant des établissements d’enseignement et de
recherche français ou étrangers, des laboratoires
publics ou privés.
performance
Mathieu Barthet, Richard Kronland-Martinet, Solvi Ystad
To cite this version:
Mathieu Barthet, Richard Kronland-Martinet, Solvi Ystad. Consistency of timbre patterns in
expres-sive music performance. 9th International Conference on Digital Audio Effects, Sep 2006, Montréal,
Canada. pp.19-25. �hal-00463315�
CONSISTENCY OF TIMBRE PATTERNS IN EXPRESSIVE MUSIC PERFORMANCE
Mathieu Barthet, Richard Kronland-Martinet, Sølvi Ystad
CNRS - Laboratoire de Mecanique et d’Acoustique
31, chemin Joseph Aiguier 13402
Marseille Cedex 20, France
ABSTRACT
Musical interpretation is an intricate process due to the inter-action of the musician’s gesture and the physical possibilities of the instrument. From a perceptual point of view, these elements induce variations in rhythm, acoustical energy and timbre. This study aims at showing the importance of timbre variations as an important attribute of musical interpretation. For this purpose, a general protocol aiming at emphasizing specific timbre patterns from the analysis of recorded musical sequences is proposed. An example of the results obtained by analyzing clarinet sequences is presented, showing stable timbre variations and their correlations with both rhythm and energy deviations.
1. INTRODUCTION
This article is part of a larger project aiming at analyzing and modelling expressive music performance. To follow the classifi-cation made by Widmer and Goebl in [1], we use an ”Analysis-by-measurement” approach which first step is to define the per-former’s expressive patterns during the interpretation. Various ap-proaches to identify performance rules have been proposed. Amon-gst these, the ”Analysis-by-synthesis” approach developed at the KTH [2] [3] which relies on musical theory knowledge has led to the establishment of context-based performance rules. They mainly take into account the tempo and the intensity of musical notes or phrases, either to emphasize their similarity (grouping rules), or to stress their remarkableness (differentiation rules). An-other approach has been proposed by Tobudic and al. [4], leading to a quantative model of expressive performance based on artificial intelligence to reproduce the tempo and dynamic curves obtained from performances played by musicians. All these studies have mainly focused on rhythm and intensity variations.
In the present study, an investigation on the consistency of timbre expressive variations in music performance is proposed. A comparison between timbre, rhythmic and intensity expressive variations is also made, since the correlations between these pa-rameters are probably strong. For this purpose, a professional clarinettist was asked to play a short piece of music (the begin-ning of a Bach’s Cello Suite) twenty times. The choice of the instrument was mainly related to the fact that it is self-sustained and that the performer easily controls the sound event after note onset. In addition, earlier studies by Wanderley [5], report that the movements of a clarinettist are highly consistent for various mu-sic performances of the same piece. Since these movements seem to be closely linked to the interpretation, we also expect the ex-pressive parameters to be highly consistent. In a previous study [6], the investigation of the performance parameters of a
physi-cally modelled clarinet indicates that timbre is involved in musical expressivity and seems to be governed by performance rules. In this study, we aim at checking if timbre also follows systematic variations on natural clarinet sounds.
We shall first describe a general methodology developed to analyze and compare recorded musical performances in order to point out consistency of timbre, rhythmic and intensity patterns in expressive music performance. An application of this methodol-ogy to twenty recorded musical sequences of the same clarinettist is then given. Eventually, we show that timbre, as rhythm and in-tensity, follows systematic variations, and that correlations exist between these parameters of the expressivity.
2. METHODOLOGY
In this section, we describe a general methodology to analyze and compare musical performances from recorded monophonic se-quences.
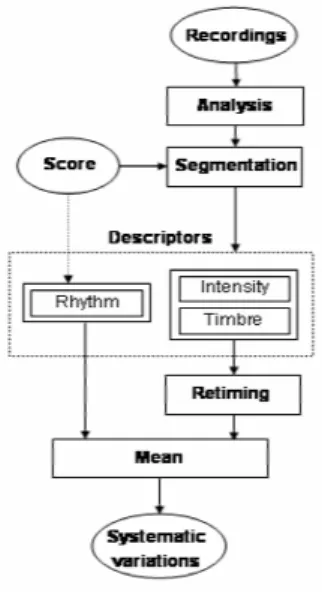
Figure 1: Methodology
The hypothesis we want to verify is that when a performer plays several times a piece with the same musical intention, pat-terns of rhythm, intensity, and timbre over the course of the piece, show a high consistency. For that purpose, we derive from the
recorded sequences some performance descriptors characterizing the musical expressivity of an interpret at a note-level. We then calculate the mean of the performance descriptors to determine if their variations are systematic. Figure 1 sums up the different steps of the methodology.
2.1. Sound corpus
If the expressive variations introduced by the musician resist an averaging over a large amount of performances played with the same musical intention, they can be considered as systematic. We thus need a large amount of recordings of the same musical piece performed as similarly as possible to identify the consistency of musical expressivity patterns.
To avoid influence from room acoustics, the recordings of these performances has to take place in a non-reverberant acoustical en-vironment.
In the following, we will note N , the number of notes of the musical melody, and n will refer to the nthnote played. We will note P the number of recorded performances, and p will refer to the pthone.
2.2. Note segmentation
Note segmentation is an intricate task and is slowed down by difficulties such as the detection of two successive notes having the same pitch, or silences between musical phrases. In [7], the author describes a way to determine the timing of the note onsets from musical audio signals. Here the task can be facilitated by the a pri-ori knowledge of the score giving an estimation of the fundamental frequencies. The note segmentation process is composed of two parts, the pitch tracking, consisting in estimating the fundamental frequencies of the recorded sequences, and the segmentation.
2.2.1. Pitch tracking
A lot of studies have been carried out on this subject. A review can be found, for instance, in [8].
In our case, we use the software LEA from the Genesis com-pany to generate filtered sequences from the original recordings which only contain the fundamental frequencies of the notes played during the performances. Since these new sequences only contain a single frequency-varying sinusoidal component, it is pertinent to calculate their analytic signals Zp(t). Finally, we obtain the in-stantaneous fundamental frequencies F 0(t) thanks to the follow-ing relation:
F 0p(t) = 1 2.π
dφp(t)
dt (1)
where φp(t) is the phase of Zp(t).
2.2.2. Segmentation
As we have a large amount of recordings, we built an auto-matic note segmentation method. It is also important that the pro-cess remains identical for each sequence in order to segment each note in the same way before the averaging of the performance de-scriptors.
Our method is based on the analysis of the fundamental fre-quency variations F 0(t). As a matter of fact, it presents instabili-ties at the transitions between notes. A detection of these instabil-ities gives the timing of the transitions between notes. By making the assumption that the end of a note is also the beginning of the next one, we get the note timings Tnpfor each note n and for each
performance p.
2.3. Performance descriptors
Rhythm descriptors are obtained from the rhythm indications of the score and from data obtained after the note segmentation part. Intensity and timbre performance descriptors are high-level descriptors derived from a time/frequency representation of the recorded sequences.
2.3.1. Rhythm descriptors
We obtain the note durations Dnpof each performance p from
the note timings Tnp. The rhythm deviation descriptor ∆Dpn is
defined as the difference between the note durations given by the score Dscoren (called nominal durations) and the durations of the
notes played during the performances Dnp (called effective
dura-tions):
∆Dp
n= Dnp− Dnscore (2)
It is a discrete time function calculated for each note.
2.3.2. Intensity and timbre descriptors
We derive these descriptors from a time/frequency analysis of the recorded sequences. They are also discrete functions of the time, but depending on the time bins defined by the analysis. In the following, dp(t) will refer to the descriptors calculated over
the entire course of the performance p, and dpn(t) will refer to the
values of dp(t) restricted to the duration of the note n.
2.4. Retiming of the performance descriptors
To verify our hypothesis, we have to calculate the average of the performance descriptors dp(t) over all recorded sequences. As
the performances are played by a human musician, the durations
Dp
nof the notes are slightly different. In order to synchronize all
these performance descriptors, a retiming process is thus neces-sary. This retiming consists in temporal contractions or dilations. We will denote by Γ these transformations. In our case, we do not need to realize an audio time-stretching keeping the frequency content of the signal as it is described for instance in [9], since the descriptors we derive from the signals are not going to be heard.
The dilation coefficient αpnwill be chosen so as to adjust the
duration Dpnof the descriptors dpn(t) to the mean duration Dnof
the notes over all the recorded performances. Thus, we will alter the performance descriptors as little as possible. If αpn> 1, Γ is a
dilation, and if αpn< 1, Γ is a contraction.
The mean note duration Dnis given by:
Dn= 1 P P X p=1 Dnp (3)
αpn=
Dn
Dnp (4)
Finally, the retiming transformations Γ applied on the note performance descriptors dpn(t) can be written as:
Γ : dp
n(t) 7−→ Γ[dpn(t)] = dpn(αpn(t)) (5)
2.5. Systematic and random variations of the descriptors
Once the synchronization of the note performance descriptors realized, we calculate their mean to point out systematic behavior, and their standard deviation to characterize random fluctuations. The mean note descriptors dn(t) over all the recorded
perfor-mances are given by:
dn(t) = 1 P P X p=1 dpn(αpn(t)) (6)
Random fluctuations of the descriptors are characterized by their standard deviation σdn(t).
Hence, if the behavior of the performance descriptors dpn(t)
is systematic over all the performances, they will be strongly cor-related with their mean value, and the standard deviation will be rather low. Furthermore, the mean will be a smoothed version of the descriptors, loosing the random fluctuations. On the contrary, if the behavior of the descriptors is not systematic, then their mean will differ from the descriptors, and the standard deviation will be high.
We also evaluate the consistency of the performance de-scriptors by calculating the correlation coefficients r2(Γ[d]) of the
retimed observation p of the descriptor d and the P − 1 others. The mean of these correlation coefficients r2(Γ[d]) measures the strength of the correlations.
3. AN APPLICATION TO THE CLARINET 3.1. Sound corpus
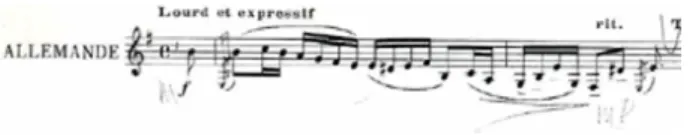
We asked the professional clarinettist C. Crousier to play the same excerpt of an Allemande of Bach (see Figure 2) twenty times with the same musical intention. This excerpt is destined to be played rather slowly and expressively (its score indication is ”Lourd et expressif”). A 48 bpm reference pulsation was given to the mu-sician by a metronome before the recordings. It was then stopped during the performance to give the player the freedom to accelerate or slow down. The reference pulsation let us calculate the notes’ nominal durations given by the score Dscoren and thus evaluate the
performer’s rhythmic deviations.
Figure 2: Excerpt of Bach’s Suite II B.W.V. 1007 (Allemande)
The recordings of the clarinet were made in an anechoic cham-ber with a 44100 Hz sample frequency. We used SD System clar-inet microphones fixed on the body and the bell of the instrument, avoiding recording problems due to the movements of the instru-mentalist while playing.
3.2. Performance descriptors extraction
We applied the Short Time Fourier Transform (STFT) on each recorded musical sequences. Hanning windows of 1024 samples and 75 % of overlap have been used for this purpose. Timbre de-scriptors were calculated considering Nharm= 15 harmonics.
3.2.1. Rhythm descriptor
We normalized the rhythm descriptors ∆Dpngiven by the
equa-tion (2) according to the notes nominal duraequa-tions and expresses it in percent. Its mean expressed as a deviation percentage is hence given by: ∆Dn(%) = 100. ∆Dn Dscore n (7) 3.3. Intensity variations
We characterize intensity variations by the Root Mean Square envelopes of the recorded sequences.
3.4. Timbre variations
Three timbre descriptors adapted to clarinet sounds have been chosen to describe the timbre variation during musical performance: the spectral centroid, which can be regarded as the mean frequency of the spectrum, the spectral irregularity correlated to the differ-ences between odd and even harmonics, and the odd and the even descriptors, correlated to the energy of odd and even harmonics in the spectrum. We will present a particular case showing that these timbre descriptors contain complementary information.
The Spectral Centroid
The definition we use for the spectral centroid SCB is the one given by Beauchamp in [10]. It differs from the classical def-inition by the presence of a term b0that forces the centroid to de-crease when the energy in the signal is low, avoiding an inde-crease of the spectral centroid at the end of the notes. It has been shown that the spectral centroid is correlated to the brightness of a sound and correlates with the main control parameters of the clarinettist, i.e. the mouth pressure and the reed aperture [11] [12]). It is defined by: SCBpn(t) = PNsup k=1 k.Ak(t) b0+ PNsup k=1 Ak(t) (8) where the Ak(t) are the modulus of the STFT considered up
to the frequency bin Nsup. The term b0is given by:
b0= M ax[Ak(t)], k = 1, .., Nsup (9)
The Spectral Irregularity
Krimphoff has pointed out the importance of the spectral ir-regularity [13]. We here derived a new definition from the one
Jensen gave in [14], including a term b1in the denominator for the same reason as for the spectral centroid. The spectral irregularity
IRRB can then be defined by: IRRBnp(t) = PNharm h=1 (Ah+1(t) − Ah(t))2 b1+ PN harm h=1 Ah(t)2 (10) where: b1= (M ax[Ah(t)])2, h = 1, .., Nharm (11)
The Odd and Even descriptors
The lack of even harmonics compared to odd ones is character-istic of the clarinet timbre (see for instance [15]), but their energy increases as the breath pressure increases (see [12]). A measure of odd and even harmonics energy compared to the overall energy is given by the Odd and Even descriptors defined below. We will show a particular case where they explain subtle timbre variations of the clarinet. Oddpn(t) = PNodd h=1 A2h+1(t) PNharm h=1 Ah(t) (12) Evenpn(t) = PN even h=1 A2h(t) PNharm h=1 Ah(t) (13) where Noddis the number of odd harmonics, and Neventhe
number of even harmonics.
4. CONSISTENCY OF THE PERFORMANCE DESCRIPTORS
4.1. Strong correlations between the performances
The mean correlation coefficients of the retimed performance descriptors are given in table 1. The high values of r2(Γ[d]) point out a strong consistency of the rhythm descriptor ∆D, the intensity descriptor RM S, and the timbre descriptors SCB, IRRB, Odd and Even, over the various performances.
d ∆D RMS SCB IRRB Odd Even
r2(Γ[d]) 0.76 0.89 0.84 0.71 0.74 0.74
Table 1: Mean correlations of the performance descriptors
4.2. Rhythmic patterns
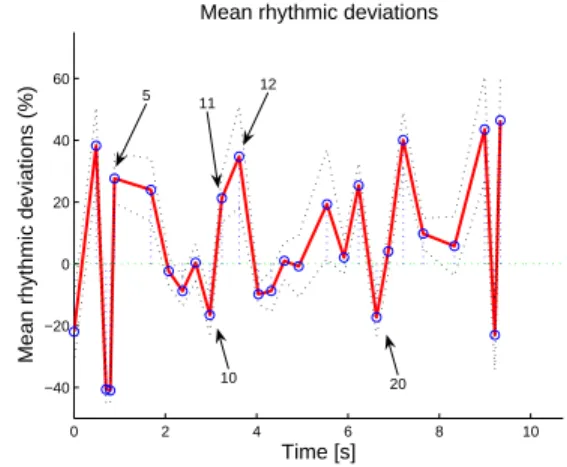
As the effective and nominal ”scores” show on figure 3, the du-ration of the mean effective performance is longer than the nom-inal one (almost a 2s difference). In order to play expressively, the performer effects rhythmic deviations compared to the rhythm indicated on the score. These rhythmic deviations lead to local accelerandi or descelerandi. In general, certain short notes tend to be shortened by the performer (∆Dn < 0, see for example
notes 10 and 20), whereas certain long notes tend to be lengthened (∆Dn > 0, see for example notes 5, 11 and 12). From 7s to the
end, almost all the notes are played longer, up to twice their nomi-nal durations for some of them. This reveals a slowing down of the
0 2 4 6 8 10 50 100 150 200 250 300 350 400 450 500
Nominal score and Mean effective score
Time [s]
Frequency [Hz]
Nominal score
Mean effective score (minus 50 Hz)
Figure 3: Nominal score (dotted) and mean effective score (solid)
shifted down by 50 Hz 0 2 4 6 8 10 −40 −20 0 20 40 60
Mean rhythmic deviations
Time [s]
Mean rhythmic deviations (%)
5
10 11
12
20
Figure 4: Rhythmic deviations (mean: bold, +/- standard
devia-tion: dotted); notes transitions: circles
tempo by the performer which is very common in endings of mu-sical phrases. These results are in agreement with the ”Duration Contrast” and ”Final Retard” rules defined by the Friberg and col-leagues, which model the two rhythmic principles indicated above [2].
4.3. Intensity patterns
As can be seen on figure 5, the phrase begins forte and then there is a progressive decrescendo until the end of the phrase. The energy peak at time bin 1600 may be due to the fact that the note played has a very low frequency (147 Hz) and is more radiated by the clarinet.
4.4. Timbre patterns
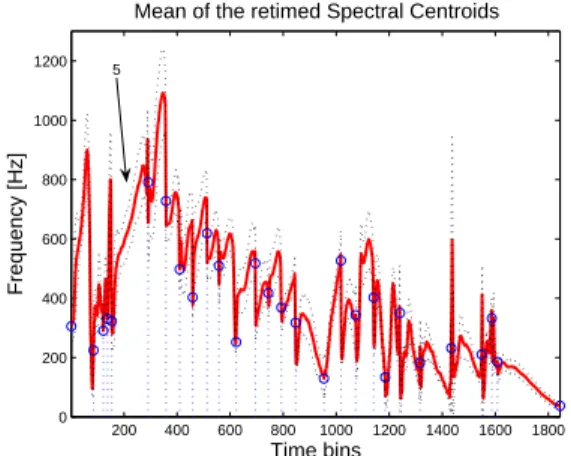
Figure 6 represents the mean spectral centroid and its standard deviation. There is a strong, monotonously increasing correlation with the intensity variations (see figure 5). Indeed, we showed in the case of synthetic clarinet sounds that an increase of the breath
200 400 600 800 1000 1200 1400 1600 1800 0 0.2 0.4 0.6 0.8 1 1.2
Mean of the retimed RMS envelopes
Time bins
Amplitude
5
Figure 5: RMS envelope (mean: bold, +/- standard deviation: dotted); notes transitions: circles
200 400 600 800 1000 1200 1400 1600 1800 0 200 400 600 800 1000 1200
Mean of the retimed Spectral Centroids
Time bins
Frequency [Hz]
5
Figure 6: Spectral Centroid (mean: bold, +/- standard deviation:
dotted); notes transitions: circles
pressure induces an increase of the energy of high-order harmon-ics and more particularly for even harmonharmon-ics around the reed res-onance frequency [12]. This is due to the non-linear coupling be-tween the excitor (the reed) and the resonator (the bore) and ex-plains the increase of the brightness of the sound. As shown in fig-ure 6, these changes can be strong. For the fifth note (around time bin 200), the difference between the lowest value of the spectral centroid at the note onset and the highest, close to the end of the note, is about 500 Hz. A neat change in the note’s timbre is audible (sounds are given at http://w3lma.cnrs-mrs.fr/ barthet/). It is worth noticing that the spectral irregularity doesn’t reflect such timbre variations and is quite stable within the note duration. Indeed, as figure 8 shows, the odd descriptor decreases after the attack phase, whereas the even descriptor increases and thus compensates for the spectral irregularity. This does not mean that the energy of the odd harmonics diminishes during the note, but that the energy of even harmonics grows faster. This is an example of one of the subtle timbre variation the performer can produce on a clarinet with great expertise.
Whereas the intensity globally decreases, the spectral irregu-larity globally increases. Actually, the difference between the odd
200 400 600 800 1000 1200 1400 1600 1800 0 0.1 0.2 0.3 0.4 0.5 0.6 0.7 0.8 0.9 1
Mean of the retimed Spectral Irregularities
Time bins
IRRB
5
Figure 7: Spectral Irregularity (mean: bold, +/- standard
devia-tion: dotted); notes transitions: circles
200 400 600 800 1000 1200 1400 1600 1800 0 0.1 0.2 0.3 0.4 0.5 0.6 0.7 0.8 0.9 1
Mean of the retimed Odd & Even descriptors
Time bins
Odd and Even descriptors
5
Figure 8: Odd and Even descriptors (mean: bold, +/- standard
deviation: dotted) ; notes transitions: circles
and even harmonic energies gets higher as the intensity increases.
4.5. Timbre and Intensity correlation
Figure 5 and 6 show that there is a strong correlation between the spectral centroid and the envelope. Nevertheless, the spec-tral centroid of a note depends on its fundamental frequency and this biases the observation. Hence, we have normalized the spec-tral centroid according to the mean instantaneous fundamental fre-quency as follows:
SCB0(t) = SCB(t)
F 0(t) (14)
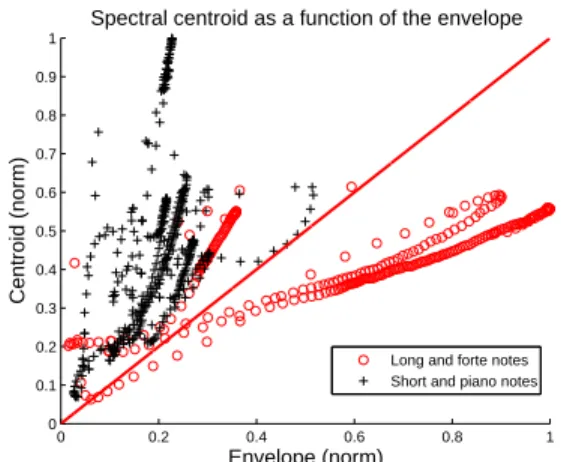
Figure 9 represents the normalized spectral centroid SCB0 as a function of the normalized mean RMS envelope for two cat-egories of notes, the short and piano ones, and the long and forte ones. It is worth noticing that these two categories of notes seem to follow different kinds of trajectories. Indeed, the spectral centroids of the short and piano notes increases very quickly compared to the envelope, whereas the spectral centroids of the long and forte notes seems to increase less rapidly than the envelope. The correlations
0 0.2 0.4 0.6 0.8 1 0 0.1 0.2 0.3 0.4 0.5 0.6 0.7 0.8 0.9 1 Envelope (norm) Centroid (norm)
Spectral centroid as a function of the envelope
Long and forte notes Short and piano notes
Figure 9: Spectral centroid as a function of the RMS envelope
we made are only qualitative but clearly proves that a link exist between the variations of the parameters of expression.
5. CONCLUSION AND FURTHER WORKS
The analysis and comparison of various recorded clarinet per-formances of the same piece played with the same musical in-tention showed that timbre (restricted to some pertinent descrip-tors) follows systematic patterns. We have hence verified on nat-ural clarinet sounds what has been observed on synthetic clarinet sounds [6].
Qualitative results show that these timbre patterns seem to be related to the rhythmic and intensity deviations over the course of the musical piece. It seems natural then to consider the timbre as an attribute of the musical expressivity. Nevertheless, the rela-tive influence of timbre, rhythm and intensity variations in expres-sive music performance is not fully understood. Multidimensional analysis are currently conducted to better understand these links.
We also plan in the future to address this issue by associating signal processing techniques altering the interpretation to psychoa-coustic evaluation.
6. ACKNOWLEDGEMENTS
We would like to thank C.Crousier for his excellent advices and implication in this project. We are also grateful to the GENESIS company for providing the LEA software.
7. REFERENCES
[1] G. Widmer and W. Goebl, “Computational Models of Ex-pressive Music Performance,” Journal of New Music
Re-search, vol. 33, no. 3, 2004.
[2] A. Friberg, A Quantative Rule System for Musical
Perfor-mance, Ph.D. thesis, Department of Speech, Music and
Hear-ing, Royal Institute of Technology, Stockholm, 1995. [3] J. Sundberg, Integrated Human Brain Science: Theory,
Method Application (Music), chapter Grouping and
Differ-entiation Two Main Principles in the Performance of Music, pp. 299–314.
[4] A. Tobudic and G. Widmer, “Playing Mozart Phrase by Phrase,” in Proc. of the 5th International Conference on
Case-based Reasoning (ICCBR’03), Trondheim, Norway,
2003.
[5] M. Wanderley, Gesture and Sign Language in
Human-Computer Interaction: International Gesture Workshop,
chapter Quantitative Analysis of Non-obvious Performer Gestures, p. 241, Springer Berlin, Heidelberg, 2002. [6] S. Farner, R. Kronland-Martinet, T. Voinier, and S. Ystad,
“Timbre variations as an attribute of naturalness in clarinet play,” in Proc. of the 3rd Computer Music Modelling and
Retrieval conference (CMMR05), Pisa, Italy, 2005.
[7] S. Dixon, “On the Analysis of Musical Expression in Audio Signals,” Storage and Retrieval for Media Databases,
SPIE-IS&T Electronic Imaging, vol. 5021, pp. 122–132, 2003.
[8] E. Gomez, Melodic Description of Audio Signals for Music
Content Processing, Ph.D. thesis, Pompeu Fabra Univeristy,
Barcelona, 2002.
[9] G. Pallone, Dilatation et Transposition sous contraintes
per-ceptives des signaux audio: application au transfert cinema-video, Ph.D. thesis, Aix-Marseille II University, Marseille,
2003.
[10] J.W. Beauchamp, “Synthesis by Spectral Amplitude and ”Brightness” Matching of Analyzed Musical Instrument Tones,” Journal of Audio Eng. Soc., vol. 30, no. 6, 1982. [11] P. Guillemain, R.T. Helland, R. Kronland-Martinet, and S.
Ystad, “The Clarinet Timbre as an Attribute of Expressive-ness,” in Proc. of the 2nd Computer Music Modelling and
Retrieval conference (CMMR04), 2004.
[12] M. Barthet, P. Guillemain, R. Kronland-Martinet, and S. Ys-tad, “On the Relative Influence of Even and Odd Harmonics in Clarinet Timbre,” in Proc. of the International Computer
Music Conference (ICMC05), Barcelona, Spain, 2005, pp.
351–354.
[13] J. Krimphoff, S. McAdams, and S. Winsberg, “Caractrisa-tion du timbre des sons complexes, II Analyses acoustiques et quantification psychophysique,” Journal de Physique IV,
Colloque C5, vol. 4, 1994.
[14] K. Jensen, Timbre Models of Musical Sounds, Ph.D. the-sis, Department of Computer Science, University of Copen-hagen, 1999.
[15] A.H. Benade and S.N. Kouzoupis, “The Clarinet Spectrum: Theory and experiment,” J. Acoust. Soc. Am., vol. 83, no. 1, 1988.