HAL Id: hal-03224764
https://hal.archives-ouvertes.fr/hal-03224764
Submitted on 11 May 2021
HAL is a multi-disciplinary open access archive for the deposit and dissemination of sci-entific research documents, whether they are pub-lished or not. The documents may come from teaching and research institutions in France or abroad, or from public or private research centers.
L’archive ouverte pluridisciplinaire HAL, est destinée au dépôt et à la diffusion de documents scientifiques de niveau recherche, publiés ou non, émanant des établissements d’enseignement et de recherche français ou étrangers, des laboratoires publics ou privés.
Macromolecular interactions in vitro, comparing
classical and novel approaches
Christophe Velours, Magali Aumont-Nicaise, Stephan Uebel, Patrick England,
Adrian Velazquez-Campoy, David Stroebel, Guillaume Bec, Pierre Soule,
Christophe Quétard, Christine Ebel, et al.
To cite this version:
Christophe Velours, Magali Aumont-Nicaise, Stephan Uebel, Patrick England, Adrian Velazquez-Campoy, et al.. Macromolecular interactions in vitro, comparing classical and novel approaches. European Biophysics Journal, Springer Verlag (Germany), 2021, 50, pp.313-330. �10.1007/s00249-021-01517-5�. �hal-03224764�
European Biophysics Journal
Macromolecular interactions in vitro, comparing classical and novel approaches
--ManuscriptDraft--Manuscript Number: EBJO-D-20-00187R1
Full Title: Macromolecular interactions in vitro, comparing classical and novel approaches
Article Type: S.I. : COST Action CA15126, MOBIEU: Between atom and cell
Keywords: Molecular scale biophysics; macromolecular interactions; artificial binders; double-stranded DNA breaks repair factors
Corresponding Author: PALOMA FERNANDEZ VARELA, Ph.D
Centre National de la Recherche Scientifique FRANCE
Corresponding Author Secondary Information:
Corresponding Author's Institution: Centre National de la Recherche Scientifique Corresponding Author's Secondary
Institution:
First Author: PALOMA FERNANDEZ VARELA, Ph.D
First Author Secondary Information:
Order of Authors: PALOMA FERNANDEZ VARELA, Ph.D
Christophe Velours, PhD Magali Aumont-Nicaise, PhD Stephan Uebel, PhD Patrick England, PhD Adrian Velazquez-Campoy, PhD David Stroebel, PhD Guillaume Bec, PhD Pierre Soule, PhD Christophe Quétard, PhD Christine Ebel, PhD Alain Roussel, PhD Jean-Baptiste Charbonnier, PhD Order of Authors Secondary Information:
Funding Information: ANR
(ANR-12-SVSE8-012) Mr Jean-Baptiste Charbonnier
ARC
(SLS220120605310) Mr Jean-Baptiste Charbonnier
INCA DomRep
(PLBIO 2012-280) Mr Jean-Baptiste Charbonnier
French Infrastructure for Integrated Structural Biology
(ANR-10-INBS-05)
Mr Jean-Baptiste Charbonnier
Abstract: Biophysical quantification of protein interactions is central to unveil molecular mechanisms of cellular processes. Researchers can choose from a wide panel of biophysical methods, including classical and more novel ones. A real-life proof-of-concept was carried out during an ARBRE-MOBIEU training school held in June 2019
training with lessons and practical sessions on six complementary approaches: (i) Analytical UltraCentrifugation with or without a Fluorescence Detector System (AUC-FDS), (ii) Isothermal Titration Calorimetry (ITC), (iii) Size Exclusion Chromatography coupled to Multi-Angle Light Scattering (SEC-MALS), (iv) Bio-Layer Interferometry (BLI), (v) MicroScale Thermophoresis (MST) and, (vi) switchSENSE. They implemented all these methods on two examples of macromolecular interactions: firstly, a protein-protein interaction between an artificial alphaRep binder, and its target protein, also an alphaRep; secondly, a protein-DNA interaction between a DNA repair complex, Ku70/Ku80 (hereafter called Ku), and its cognate DNA ligand. The students acknowledged that the workshop provided them with a clearer understanding of the advantages and limitations of the different techniques and will help them in the future to choose the approaches that are most relevant or informative to their projects.
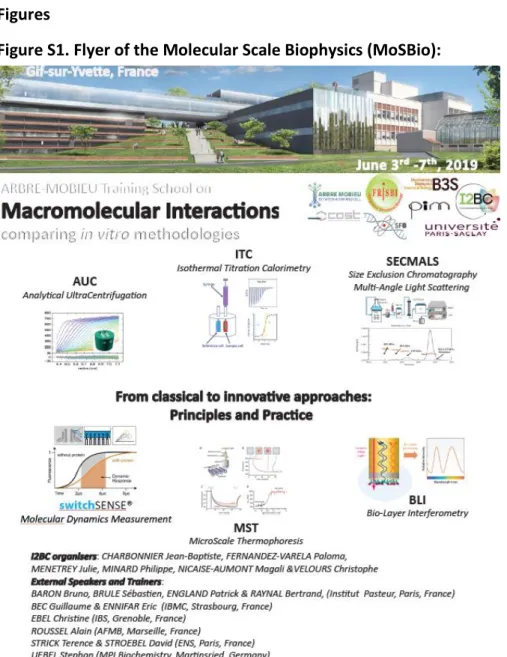
Response to Reviewers: Reviewer #1: We have incorporated all of your suggestions into our revised manuscript they were very helpful. You will find below the answer to your specific comments: 1)Despite the interest of some of the drawn conclusions—and their indubitable didactical value—, the strongly promotional content of the manuscript should be tempered. For instance, Figure S1 should be removed from the paper—maybe it can be substituted for a link to the website of the course in the main text.
As required Figure S1 has been removed and substituted by a link to the website of the course in the main text.
2)The need of in vitro validation of demonstrated interactions in cell is suggested in two occasions (lines 48 and 630). However, the in cell detection of an interaction
constitutes a stronger evidence of its specificity. It would be more adequate to talk about in vitro characterisation, which provides structural, physical and
thermodynamical details that cannot be obtained in cell (especially in a quantitative way) and are also important to understand macromolecular interactions.
Now lines 49 and 688 have been corrected to describe in vitro characterization instead of validation of macromolecular interactions observed in cell.
3)More detailed explanations about the followed procedures in "Materials and methods" section would be desirable rather than general descriptions of the used techniques, so the exposed experiments can be easily reproduced. Similarly, "Samples preparation" subsection barely contains information about experimental procedures. We agree with the reviewer that more detailed explanations about the procedures are missing. A few important details have been included in the revised version.
4)Line 124 states that only the interaction between A3 and Rep17 has been studied due to its stronger character versus the one between A3 and Rep2. However, measurements on the A3-Rep2 complex are commented (312). This should be clarified.
Now line 134 as required has been clarified in the text, both A3/Rep2 and A3/Rep17 interactions were measured by different methods during the preparation of the training. We chose to measure only the latter during the training because of its higher affinity. 5)Regarding binding experiments with labelled AlphaReps, some aspects about methodology and the results should be clarified.
We clarified the following questions regarding coupling or labelled A3:
- It seems plausible that the coupling of A3 to the DNA strand for switchSENSE (line 364) could affect the A3 binding with Rep2, positive or negatively. Has it been tested? -Now line 415: Binding of coupled A3-DNA to Rep2 was tested during the preparation of the training. The measured affinity was comparable with the values obtained previously with other methods, i.e. ITC, SPR (Léger et al., 2019).
- Authors state that the used dye for MST experiments substantially improves the signal detection and protein integrity versus the one used in AUC-FDS (line 400). Then, does the latter produce protein instability? In this case, could the His-Tag
Red-experiment, because we are out of the excitation and emission wavelengths range of the detector (488 nm and 505-565 nm, respectively).
- Authors suggest that the higher KD obtained by AUC-FDS and MST for the
AlphaReps interaction could be explained by a hindrance of the interaction site caused by the fluorophore (lines 441-444). However, the KD measured by MST suffers a considerably much bigger change, in spite of the suggested greater "respect to protein integrity". Can this point be really explained by any other details? Please, discuss this point deeper.
-Upon closer inspection we would like to omit the data set on A3-Rep17 from the blue channel, this measurement does not fulfil the quality criteria applicable to MST data (S/N) and the measured KD cannot be trust it under these conditions.
6)Regarding measurements on the Ku-DNA interaction, some points about the obtained results should be clarified.
We clarified the following points regarding Ku-DNA interactions:
- Authors suggest that SEC-MALS provide peaks corresponding to Ku binding to a 42 bp DNA with both 2:1 and 1:1 stoichiometry (lines 452-459). However, in consistency with the statement of that a 42 bp DNA should bind 2 Ku heterodimers (lines 144-146), a 1:1 binding should be barely o not observed. Could this result be explained by the use of an insufficient Ku concentration (not saturating) for the complexation reaction prior to SEC?
-Now lines 153-155/lines 495-504: SEC-MALS experiments were carried out with an excess of DNA, which corresponded to the last elution peak of the chromatograms. Because, we used a sub-saturating Ku concentration, we observed two types of complexes with the 42bp DNA, comprising one or two Ku heterodimers.
- Authors expose that they were not able to obtain a well fitted model for experimental data obtained by BLI, arguing the low capability of the used model to explain a more complex binding mechanism (lines 485-489). Should the obtained binding constants be taken into account? Or measurements are only qualitative...
-Now lines 528-534: The first BLI experiments were not conclusive, as a result the obtained binding constants are only qualitative in the presented conditions. We added a sentence at the end of the corresponding paragraph to precise this point (lines 537-538).
-7)Authors suggest that the deployed approaches allow them to "characterize the architecture" of the interactions (lines 555-557). However, no structural details or predictions about the studied complexes are provided in this article.
Now line 601: We specified the term architecture by adding “(in term of size and stoichiometry)” in the text as required.
8)In spite of the data provided by the results, a comparative discussion of the obtained KD values is not present in the manuscript. It seems essential in order to evaluate the scope of each of the presented biophysical techniques, as well as consider the use of one or another for each particular case.
We add a comparative discussion of the KD measured by the students and highlight that in the two systems studied the approaches tested allow to measured KD. We compare the difference between the maximal and minimal values obtained for each system (lines 622-630).
9)Some aspects about figures should be noted. The following figures have been corrected:
- Abbreviations defined in the caption to figure 1 need to be revised. It contains definitions for abbreviations that are not present in the figure (i. e. MT) and it lacks definition for abbreviations that are present (i. e. MM).
enlarged.
-Figure 3b: A new figure is proposed with larger line grids and marks.
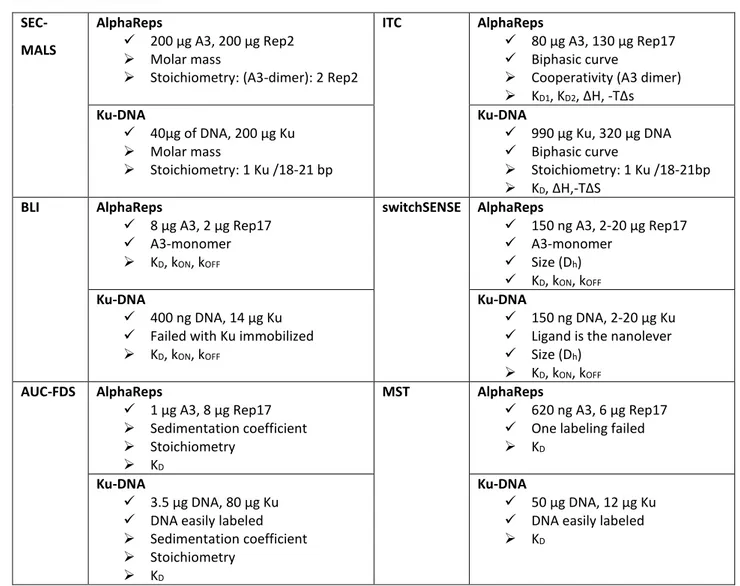
- Information displayed by figure 4 should be better organised. Sample quantities have to be displayed separated for the measurable parameters or further observations. -Figure 4: Sample quantities have been displayed separated for the measurable parameters or further observations as suggested.
- Reference to figure 2e in line 398 should be changed by figure 2f. -Figure 2e/2f references have been corrected.
10)Overall, the use of English should be revised. For instance, some informal expressions have to be changed in order to become more polished or precise. Specially, the repeated use of "amount of material" (lines 436, 569, 579, 589) referring to quantity of sample or expressions like "the same column as above" (line 452) rather than specifying the used material should be avoided.
The use of English has been revised.
Now lines 481, 591, 633, 642 have been corrected with quantity of sample instead of amount of material.
Now line 495 has been corrected with the use material.
Reviewer #2: We thank you very much for your comments and we follow all your recommendations.
1)Several of these techniques require a concentration series - the authors have chosen well-characterised systems from their own laboratories, and so the concentration ranges employed to accurately determine binding parameters are already known. However, it might be useful for new users if the authors were to summarise (in a sentence or two) how these concentration ranges were determined. Equally, when discussing AUC the authors mention that dn/dc and UV extinction coefficients are required. Again, it might be useful for novice users if the authors summarised how these values were determined.
We summarized in a paragraph at the end of section “Sample preparation” how concentration ranges can be determined (lines 356-362).
AUC required values, dn/dc and UV extinction coefficients are now described in Materials and Methods section (lines 280-282).
2)I believe that the use of screenshots from analysis software in the figures, whilst often not appropriate, is appropriate in a review of this type. However, the authors should ensure that the resolution of the images is high enough to allow readers to read the axis labels, etc where necessary. Where this isn't possible, legible labels should be added to the figure though other means (illustrator, Inkscape etc).
A higher resolution Figure3b (SECMALS) is proposed with labels that are more legible. In MST figures, legible labels have been added.
Specific minor comments.
Minor comments have been corrected: Figure 1 typo - Limitated -> Limited. Figure 1 typo has been corrected.
Line 116 missing word - "New applications of these artificial binders are currently *being* explored in relation to their ability to be expressed in eukaryotic cells". Now line 126 missing word has been added.
Line 153 typo - feedbacks -> feedback Now line 163 typo has been corrected.
Line 283 - "In the conditions used, we assumed A3 is a monomer, as the simultaneous presence of the monomeric and dimeric forms would make the analysis difficult." - for
analysis would be difficult.
An explanation about how and why the analysis of an interaction A3/Rep17 in the presence of monomeric and dimeric forms of A3 has been included in the text. (now lines 328-332)
Line 301 missing words- "such as 0.1 % Tween-20, to reduce surface tension (*in the* capillaries, chip, *and* biosensors)."
Now line 347 missing word has been added.
Line 619 - "The MoSBio training school over a week with 20 students proved to be a very rich occasion for such discussions." - this sentence seems out of place. Perhaps it was intended to be added to the following section (Line 628)?
The sentence “The MosBio training school…” has been moved to the following paragraph as suggested (now line 683).
Line 636 - NMR shift mapping can also reveal residues involved in interaction surfaces. Now line 692, NMR shift mapping has been added to the text.
Line 644 typo - feedbacks -> feedback Now line 701 typo has been corrected.
Dear Editors,
We are grateful that you and the reviewers appreciate the study presented in our article and give us the opportunity to send a revised version of our manuscript following the recommendations of the reviewers. You will find below a point-by-point response to the corrections asked by the reviewers. The corresponding changes in the manuscript are coloured in red in the clean version to help visualization. We would like to thank them for their careful analysis of the manuscript and their suggestions that improve the article
Reviewer #1: We have incorporated all of your suggestions into our revised manuscript they were very helpful. You will find below the answer to your specific comments:
1) Despite the interest of some of the drawn conclusions—and their
indubitable didactical value—, the strongly promotional content of the manuscript should be tempered. For instance, Figure S1 should be removed from the paper—maybe it can be substituted for a link to the website of the course in the main text.
As required Figure S1 has been removed and substituted by a link to the website of the course in the main text.
2) The need of in vitro validation of demonstrated interactions in
cell is suggested in two occasions (lines 48 and 630). However, the in cell detection of an interaction constitutes a stronger evidence of its specificity. It would be more adequate to talk about in vitro characterisation, which provides structural, physical and thermodynamical details that cannot be obtained in cell (especially in a quantitative way) and are also important to understand macromolecular interactions.
Now lines 49 and 688 have been corrected to describe in vitro characterization instead of validation of macromolecular interactions observed in cell.
3) More detailed explanations about the followed procedures in
"Materials and methods" section would be desirable rather than general descriptions of the used techniques, so the exposed experiments can be easily reproduced. Similarly, "Samples preparation" subsection barely contains information about experimental procedures.
We agree with the reviewer that more detailed explanations about the procedures are missing. A few important details have been included in the revised version.
4) Line 124 states that only the interaction between A3 and Rep17
has been studied due to its stronger character versus the one between A3 and Rep2. However, measurements on the A3-Rep2 complex are commented (312). This should be clarified.
Authors' Response to Reviewers' Comments Click here to access/download;Authors' Response to
Now line 134 as required has been clarified in the text, both A3/Rep2 and A3/Rep17 interactions were measured by different methods during the preparation of the training. We chose to measure only the latter during the training because of its higher affinity.
5) Regarding binding experiments with labelled AlphaReps, some
aspects about methodology and the results should be clarified.
We clarified the following questions regarding coupling or labelled A3:
- It seems plausible that the coupling of A3 to the DNA strand for switchSENSE (line 364) could affect the A3 binding with Rep2, positive or negatively. Has it been tested?
- Now line 415: Binding of coupled A3-DNA to Rep2 was tested during the preparation of the training. The measured affinity was comparable with the values obtained previously with other methods, i.e. ITC, SPR (Léger et al., 2019).
- Authors state that the used dye for MST experiments substantially improves the signal detection and protein integrity versus the one used in AUC-FDS (line 400). Then, does the latter produce protein instability? In this case, could the His-Tag Red-tris-NTA labelling used for both techniques?
- Now line 448: His-Tag Red-tris-NTA labelling cannot be used for AUC-FDS experiment, because we are out of the excitation and emission wavelengths range of the detector (488 nm and 505-565 nm, respectively).
- Authors suggest that the higher KD obtained by AUC-FDS and MST for the AlphaReps interaction could be explained by a hindrance of the interaction site caused by the fluorophore (lines 441-444). However, the KD measured by MST suffers a considerably much bigger change, in spite of the suggested greater "respect to protein integrity". Can this point be really explained by any other details? Please, discuss this point deeper.
- Upon closer inspection we would like to omit the data set on A3-Rep17 from the blue channel, this measurement does not fulfil the quality criteria applicable to MST data (S/N) and the measured KD cannot be trust it under these conditions.
6) Regarding measurements on the Ku-DNA interaction, some points
about the obtained results should be clarified.
We clarified the following points regarding Ku-DNA interactions:
- Authors suggest that SEC-MALS provide peaks corresponding to Ku binding to a 42 bp DNA with both 2:1 and 1:1 stoichiometry (lines 452-459). However, in consistency with the statement of that a 42 bp DNA should bind 2 Ku heterodimers (lines 144-146),
a 1:1 binding should be barely o not observed. Could this result be explained by the use of an insufficient Ku concentration (not saturating) for the complexation reaction prior to SEC?
- Now lines 153-155/lines 495-504: SEC-MALS experiments were carried out with an excess of DNA, which corresponded to the last elution peak of the chromatograms. Because, we used a sub-saturating Ku concentration, we observed two types of complexes with the 42bp DNA, comprising one or two Ku heterodimers.
- Authors expose that they were not able to obtain a well fitted model for experimental data obtained by BLI, arguing the low capability of the used model to explain a more complex binding mechanism (lines 485-489). Should the obtained binding constants be taken into account? Or measurements are only qualitative...
- Now lines 528-534: The first BLI experiments were not conclusive, as a result the obtained binding constants are only qualitative in the presented conditions. We added a sentence at the end of the corresponding paragraph to precise this point (lines 537-538).
-
7) Authors suggest that the deployed approaches allow them to
"characterize the architecture" of the interactions (lines 555-557). However, no structural details or predictions about the studied complexes are provided in this article.
Now line 601: We specified the term architecture by adding “(in term of size and stoichiometry)” in the text as required.
8) In spite of the data provided by the results, a comparative
discussion of the obtained KD values is not present in the manuscript. It seems essential in order to evaluate the scope of each of the presented biophysical techniques, as well as consider the use of one or another for each particular case.
We add a comparative discussion of the KD measured by the students and highlight
that in the two systems studied the approaches tested allow to measured KD. We
compare the difference between the maximal and minimal values obtained for each system (lines 622-630).
9) Some aspects about figures should be noted.
The following figures have been corrected:
- Abbreviations defined in the caption to figure 1 need to be revised. It contains definitions for abbreviations that are not present in the figure (i. e. MT) and it lacks definition for abbreviations that are present (i. e. MM).
- Figure 1: Abbreviations have been updated.
- Graphs in figure 3b should be more understandable. Line grids and marks have be enlarged.
- Figure 3b: A new figure is proposed with larger line grids and marks.
- Information displayed by figure 4 should be better organised. Sample quantities have to be displayed separated for the measurable parameters or further observations.
- Figure 4: Sample quantities have been displayed separated for the measurable parameters or further observations as suggested.
- Reference to figure 2e in line 398 should be changed by figure 2f.
- Figure 2e/2f references have been corrected.
10) Overall, the use of English should be revised. For instance,
some informal expressions have to be changed in order to become more polished or precise. Specially, the repeated use of "amount
of material" (lines 436, 569, 579, 589) referring to quantity of
sample or expressions like "the same column as above" (line 452) rather than specifying the used material should be avoided.
The use of English has been revised.
Now lines 481, 591, 633, 642 have been corrected with quantity of sample instead of amount of material.
Reviewer #2: We thank you very much for your comments and we follow all your recommendations.
1) Several of these techniques require a concentration series - the
authors have chosen well-characterised systems from their own laboratories, and so the concentration ranges employed to accurately determine binding parameters are already known. However, it might be useful for new users if the authors were to summarise (in a sentence or two) how these concentration ranges were determined. Equally, when discussing AUC the authors mention that dn/dc and UV extinction coefficients are required. Again, it might be useful for novice users if the authors summarised how these values were determined.
We summarized in a paragraph at the end of section “Sample preparation” how concentration ranges can be determined (lines 356-362).
AUC required values, dn/dc and UV extinction coefficients are now described in Materials and Methods section (lines 280-282).
2) I believe that the use of screenshots from analysis software in
the figures, whilst often not appropriate, is appropriate in a review of this type. However, the authors should ensure that the resolution of the images is high enough to allow readers to read the axis labels, etc where necessary. Where this isn't possible, legible labels should be added to the figure though other means
(illustrator, Inkscape etc).
A higher resolution Figure3b (SECMALS) is proposed with labels that are more legible. In MST figures, legible labels have been added.
Specific minor comments.
Minor comments have been corrected:
Figure 1 typo - Limitated -> Limited. Figure 1 typo has been corrected.
Line 116 missing word - "New applications of these artificial binders are currently *being* explored in relation to their ability to be expressed in eukaryotic cells".
Now line 126 missing word has been added.
Line 153 typo - feedbacks -> feedback Now line 163 typo has been corrected.
Line 283 - "In the conditions used, we assumed A3 is a monomer, as the simultaneous presence of the monomeric and dimeric forms would make the analysis difficult." - for completeness maybe expand on this with a sentence explaining how and/or why analysis would be difficult.
An explanation about how and why the analysis of an interaction A3/Rep17 in the presence of monomeric and dimeric forms of A3 has been included in the text. (now lines 328-332)
Line 301 missing words- "such as 0.1 % Tween-20, to reduce
surface tension (*in the* capillaries, chip, *and*
biosensors)."
Now line 347 missing word has been added.
Line 619 - "The MoSBio training school over a week with 20 students proved to be a very rich occasion for such discussions." - this sentence seems out of place. Perhaps it was intended to be added to the following section (Line 628)?
The sentence “The MosBio training school…” has been moved to the following paragraph as suggested (now line 683).
Line 636 - NMR shift mapping can also reveal residues involved in interaction surfaces.
Now line 692, NMR shift mapping has been added to the text.
Line 644 typo - feedbacks -> feedback Now line 701 typo has been corrected.
Macromolecular interactions in vitro, comparing classical and novel approaches
1
Christophe Velours1,2*, Magali Aumont-Nicaise1*, Stephan Uebel3, Patrick England4, Adrian 2
Velazquez-Campoy5,6,7,8,9, David Stroebel10, Guillaume Bec11, Pierre Soule12, Christophe 3
Quétard13, Christine Ebel14, Alain Roussel15, Jean-Baptiste Charbonnier1, Paloma Fernández 4
Varela1# 5
1Université Paris-Saclay, CEA, CNRS, Institute for Integrative Biology of the Cell (I2BC), 91198, 6
Gif-sur-Yvette, France. 2Microbiologie Fondamentale et Pathogénicité, MFP CNRS UMR 5234, 7
University of Bordeaux, 146 rue Léo Saignat 33076 Bordeaux, France. 3Bioorganic Chemistry & 8
Biophysics Core Facility, Max-Planck-Institute of Biochemistry, Martinsried, Germany. 9
4Molecular Biophysics platform, Institut Pasteur, Paris, France. 5Institute of Biocomputation 10
and Physics of Complex Systems (BIFI), Joint Units IQFR-CSIC-BIFI, and GBsC-CSIC-BIFI, 11
Universidad de Zaragoza, Zaragoza, 50018, Spain. 6Departamento de Bioquímica y Biología 12
Molecular y Celular, Universidad de Zaragoza, 50009, Zaragoza, Spain. 7Instituto de 13
Investigación Sanitaria Aragón (IIS Aragón), 50009, Zaragoza, Spain. 8Centro de Investigación 14
Biomédica en Red en el Área Temática de Enfermedades Hepáticas y Digestivas (CIBERehd), 15
28029, Madrid, Spain. 9Fundación ARAID, Gobierno de Aragón, 50009, Zaragoza, Spain. 16
10Institut de biologie de l’Ecole normale supérieure (IBENS), Paris, France. 11Institut de Biologie 17
Moléculaire et Cellulaire (IBMC), Strasbourg, France. 12NanoTemper Technologies GmbH, 18
Munich, Germany. 13ForteBio-Sartorius, Dourdan, France. 14Univ. Grenoble Alpes, CNRS, CEA, 19
IBS, Grenoble, France .15Architecture et Fonction des Macromolécules Biologiques (AFMB), 20
Marseille, France. 21
*Contributed equally 22
#Corresponding author: [email protected] ORCID: 0000-0001-23
5078-7102 24
Abstract
25
Biophysical quantification of protein interactions is central to unveil molecular mechanisms of
26
cellular processes. Researchers can choose from a wide panel of biophysical methods,
27
including classical and more novel ones. A real-life proof-of-concept was carried out during an
28
ARBRE-MOBIEU training school held in June 2019 in Gif-sur-Yvette, France. Twenty European
29
students benefited from a one-week training with lessons and practical sessions on six
30
complementary approaches: (i) Analytical UltraCentrifugation with or without a Fluorescence
31
Detector System (AUC-FDS), (ii) Isothermal Titration Calorimetry (ITC), (iii) Size Exclusion
32
Chromatography coupled to Multi-Angle Light Scattering (SEC-MALS), (iv) Bio-Layer
33
Interferometry (BLI), (v) MicroScale Thermophoresis (MST) and, (vi) switchSENSE. They
34
implemented all these methods on two examples of macromolecular interactions: firstly, a
35
protein-protein interaction between an artificial alphaRep binder, and its target protein, also
36
an alphaRep; secondly, a protein-DNA interaction between a DNA repair complex, Ku70/Ku80
37
Manuscript Click here to
access/download;Manuscript;EBJ_ARBRE-MOBIEU-final.docx Click here to view linked References
1 2 3 4 5 6 7 8 9 10 11 12 13 14 15 16 17 18 19 20 21 22 23 24 25 26 27 28 29 30 31 32 33 34 35 36 37 38 39 40 41 42 43 44 45 46 47 48 49 50 51 52 53 54 55 56 57 58 59 60 61
(hereafter called Ku), and its cognate DNA ligand. The students acknowledged that the
38
workshop provided them with a clearer understanding of the advantages and limitations of
39
the different techniques and will help them in the future to choose the approaches that are
40
most relevant or informative to their projects.
41
Keywords
42
Molecular scale biophysics, macromolecular interactions, artificial binders, double-stranded
43
DNA breaks repair factors
44
Introduction
45
Macromolecular interactions play a central role in the activation/inactivation of most cellular
46
mechanisms. These interactions can be measured in cellulo, or in vitro, and predicted in silico.
47
The classical in cellulo methods (such as tap-tag or two-hybrid) allow large-scale studies, but
48
in order to confirm that a direct interaction occurs between two macromolecules, quantitative
49
in vitro measurements are needed. These measurements allow to characterize interactions 50
not only in terms of affinity, but also to determine additional kinetic and thermodynamic
51
parameters, as well as to define the hydrophobic or hydrophilic nature of the interface. They
52
give access to the stoichiometry of the assembly and allow to map the regions involved by
53
using different constructs or mutants. In vitro measurements can also be useful to evaluate
54
the role of post-translational modifications or other regulatory events on the formation of
55
complexes. By in silico docking analysis, we can predict the structure of macromolecular
56
complexes or the impact of functional substitutions helping to optimize experimental design
57
(Andreani and Guerois, 2014).
58
The original idea of the project presented here originated during the organization of a
59
European Training School in Molecular Scale Biophysics (https://mosbio.sciencesconf.org/)
60
within the MOBIEU COST Action. We proposed to the participants to compare different
61
techniques allowing to measure macromolecular interactions in vitro. Nowadays, there is a
62
large panel of possibilities, and it becomes difficult to choose which technology will be the
63
best adapted when embarking into a new project. Each approach presents advantages and
64
drawbacks, and it is therefore difficult for the user to choose from the beginning which one
65
will be most adapted to the properties of the interaction partners. In the workshop, we
66 1 2 3 4 5 6 7 8 9 10 11 12 13 14 15 16 17 18 19 20 21 22 23 24 25 26 27 28 29 30 31 32 33 34 35 36 37 38 39 40 41 42 43 44 45 46 47 48 49 50 51 52 53 54 55 56 57 58 59 60 61
focused on six approaches (Fig. 1). Choosing between the different techniques can be
67
considered in a progressive manner. If none of the interaction partners can be easily labeled
68
or immobilized on a surface, approaches in which the macromolecules are in solution (AUC,
69
ITC, and SEC-MALS) should be favored (Fig. 1, top). However, several of them require large
70
quantities of biological material. When a partner can be immobilized easily on a bio-surface,
71
without affecting its function, approaches like BLI, switchSENSE and Surface Plasmon
72
Resonance (SPR) will be often tested, since they offer the possibility to use small amounts of
73
the immobilized partner (called ligand) (Fig. 1, middle). Finally, when the partners can be
74
labeled, again without affecting their function, fluorescent probes can be grafted allowing the
75
use of reduced amounts of material and facilitated signal analysis (AUC FDS, MST, or
76
Microfluidic diffusional sizing (MDS)) (Fig. 1, bottom).The choice of the optimal approach may
77
further rely on additional criteria including the solubility of the partners, the instrument
78
environment or non-specific interactions with instrument surfaces. Finally, it should be
79
stressed that it is preferable to perform measurements using several orthogonal techniques
80
to fully validate and characterize a biological interaction, and specify its features, such as
81
stoichiometry, kinetics or thermodynamics.
82
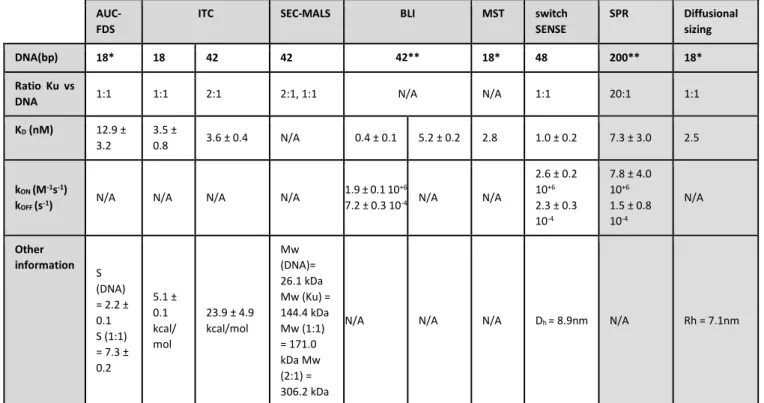
Figure 1. Decisional tree to help choosing the biophysical approach that best suits the study
83
of a specific molecular interaction.
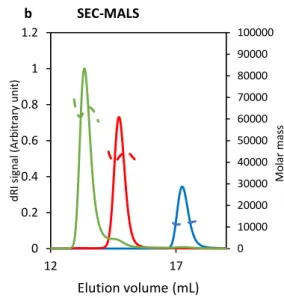
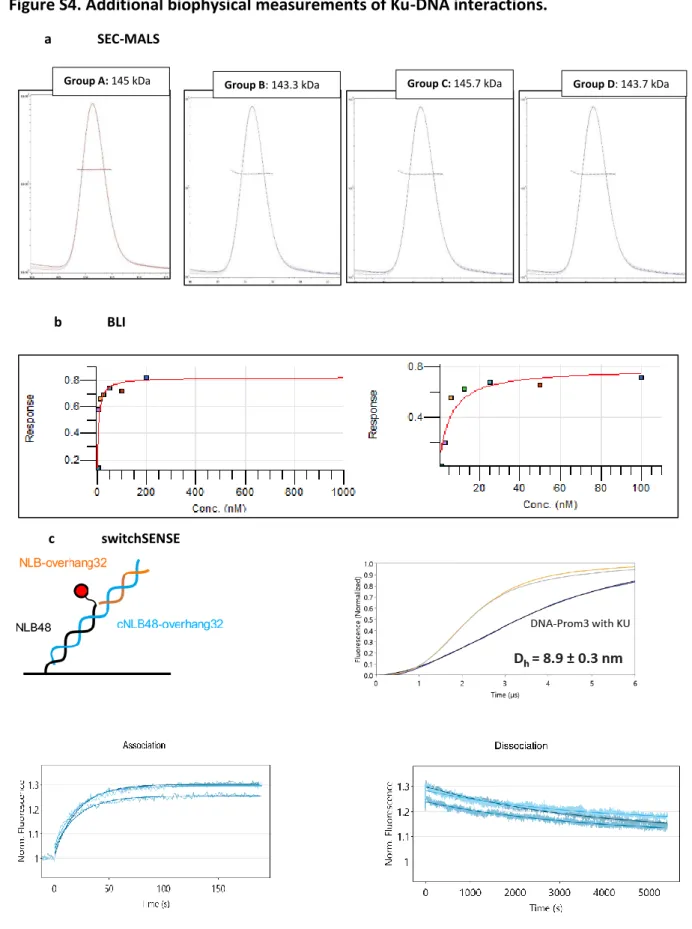
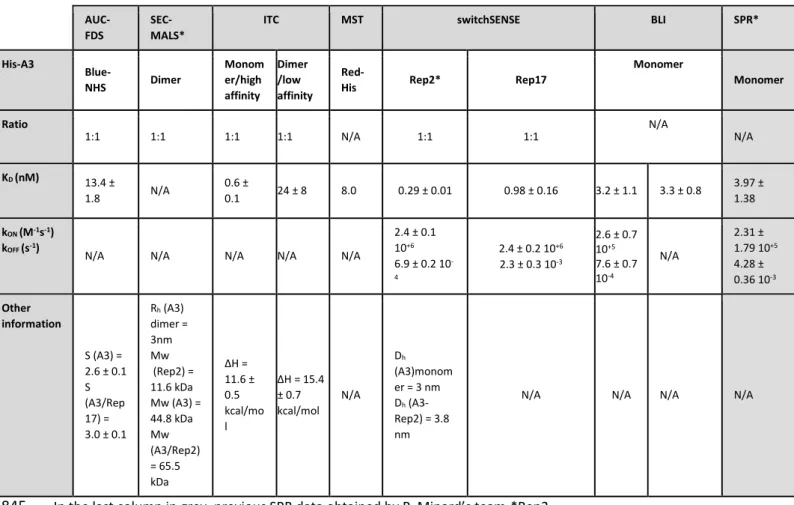
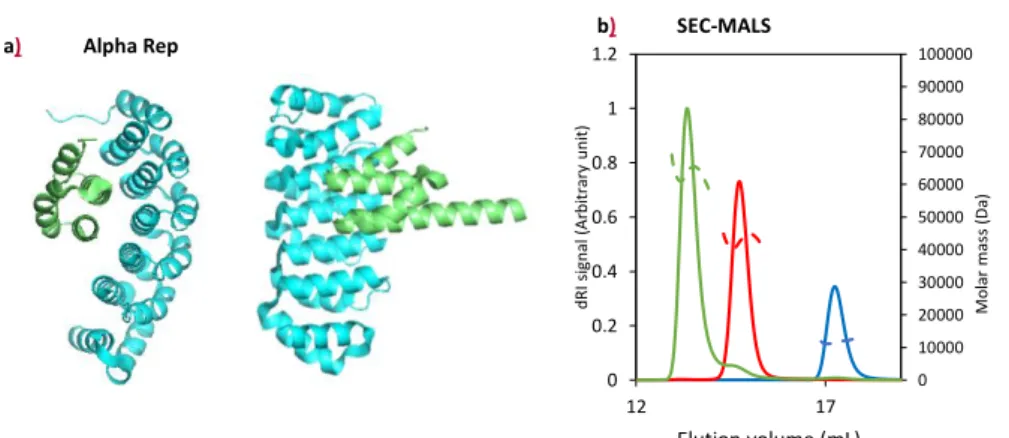
84 1 2 3 4 5 6 7 8 9 10 11 12 13 14 15 16 17 18 19 20 21 22 23 24 25 26 27 28 29 30 31 32 33 34 35 36 37 38 39 40 41 42 43 44 45 46 47 48 49 50 51 52 53 54 55 56 57 58 59 60 61
85
Six approaches were used in the training school. They can be classified in three main groups: measurements in 86
solution and label free (bottom, left), on biosensor with a partner graft on a surface (bottom, middle), and 87
methods with a partner labeled with a fluorescent probe (bottom, right). If a quality sample (pure, stable, 88
monodisperse) is available in large quantity (up to mg amount) one may start with label-free and in solution 89
approaches. Otherwise, if material is limited for one partner, surface approaches are a good alternative. Finally, 90
when labeling is possible, MST and AUC-FDS are highly complementary approaches to cross-validate interactions 91
measurements. The six approaches give access to different parameters of the interaction and present some 92
specific limitations. AUC: Analytical Ultracentrifugation; ITC: Isothermal Titration Calorimetry, SEC-MALS: Size 93
Exclusion Chromatography with Multi-Angle Light Scattering; BLI: Bio-Layer Interferometry; MST: MicroScale 94
Thermophoresis; AUC-FDS: Analytical Ultracentrifugation with a Fluorescence Detector System; S: Sedimentation 95
coefficient; KD, dissociation constant; n, stoichiometry; Dh, hydrodynamic diameter or Rh, hydrodynamic radius; 96
kON, kOFF; association and dissociation rates; MT mass transport. 97 1 2 3 4 5 6 7 8 9 10 11 12 13 14 15 16 17 18 19 20 21 22 23 24 25 26 27 28 29 30 31 32 33 34 35 36 37 38 39 40 41 42 43 44 45 46 47 48 49 50 51 52 53 54 55 56 57 58 59 60 61
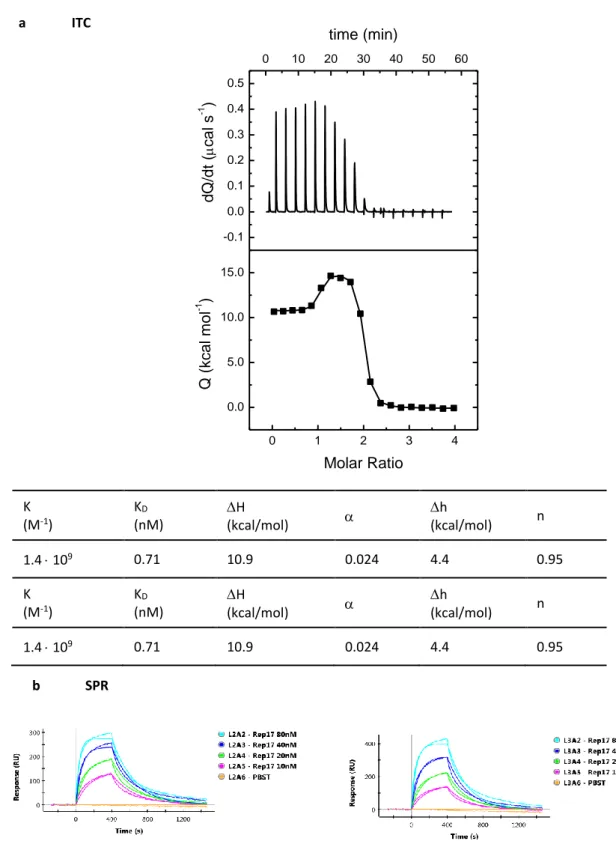
In this training school, we used as examples two different macromolecular interactions
98
systems, that have been well characterized in our laboratories using several of the approaches
99
discussed here. One is an interaction between two proteins, and the other a protein-DNA
100
interaction, both with an affinity in the nanomolar range. Reference data were initially
101
produced in our laboratories. A group of 20 participants reproduced our measurements during
102
the five-day MoSBio Training School.
103
The first project comes from P. Minard’s team, who uses an original family of artificial
104
helicoidal repeat proteins, called alphaRep (Guellouz et al., 2013). AlphaRep libraries allow to
105
select tight binders against a variety of targets by phage display. The alphaRep’s are highly
106
soluble proteins, easily expressed in E. coli, which display a very high thermal stability. These
107
proteins are cysteine-free and, thus do not contain disulfide bonds. They are composed by
108
repeated motifs made with two antiparallel alpha helices. Clusters of variable side chains,
109
mainly in the second helix, are positioned on the same face of the motifs. The ensemble of all
110
these variable motifs forms a library of surfaces from which tight binders can be extracted
111
against a given target. The alphaRep’s have been used for several applications, such as
112
chaperones for crystallization and structural studies of difficult targets (Valerio-Lepiniec et al.,
113
2015; Di Meo et al., 2017; Chevrel et al., 2018; Campanacci et al., 2019), as well as in
114
biophysical and live cell applications (Léger et al., 2019; Prasad et al., 2019; Fernandez et al.,
115
2020; Léger et al., 2020). New applications of these artificial binders are currently explored in
116
relation to their ability to be expressed in eukaryotic cells. Here we analyzed the interactions
117
between two alphaRep’s (Rep2 and Rep17) selected against a protein target, (A3), which is
118
itself an alphaRep. The interaction between the alphaReps has been extensively characterized
119
before in the laboratory by ITC, SEC-MALS and AUC, but also by Circular Dichroism (CD), SPR
120
and Fluorescence Resonance energy Transfer (FRET) (not used in this training school)
121
(Guellouz et al.,2013; Di Meo et al., 2017; Léger et al., 2019). Both A3 / Rep2 and A3 / Rep17
122
interactions were tested previously to determine which one was the most appropriate for the
123
training, and the former is weaker than the latter. During the training only A3 / Rep17
124
interaction was measured.
125
The second project comes from J.B. Charbonnier’s team. It concerns proteins involved in DNA
126
repair, and more precisely, in the classical Non-Homologous End Joining (c-NHEJ), the main
127
Double-Strand Break (DSB) repair pathway in human. The Ku70/Ku80 (Ku) heterodimer plays
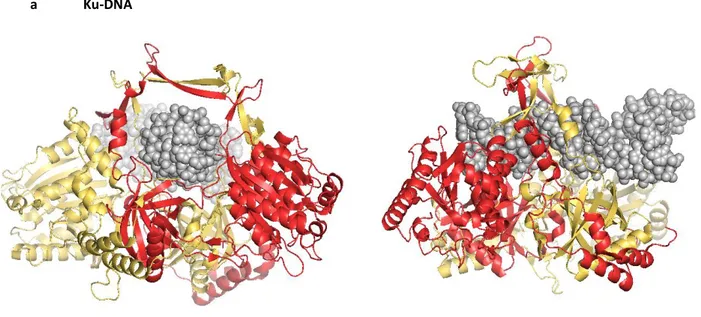
128 1 2 3 4 5 6 7 8 9 10 11 12 13 14 15 16 17 18 19 20 21 22 23 24 25 26 27 28 29 30 31 32 33 34 35 36 37 38 39 40 41 42 43 44 45 46 47 48 49 50 51 52 53 54 55 56 57 58 59 60 61
a central role in the recognition of DSB ends, as it is the first repair factor that interacts with
129
them. Ku binds tightly to DNA ends in a sequence independent manner thanks to its
ring-130
shaped structure (Walker et al., 2001). Ku then iteratively recruits different NHEJ partners
131
(ligase 4, nucleases and polymerases) (Chang et al., 2017; Frit et al., 2019). Ku also contributes
132
to the tethering (synapse) between the two DSB ends to avoid misrepair with other DSB ends.
133
J.B. Charbonnier’s team (Tadi et al., 2016; Nemoz et al., 2018) has recently described the
134
recruitment mechanism of some NHEJ factors by Ku at the molecular level. DSBs, despite being
135
deleterious DNA lesions, are generated on purpose during radiotherapy or in genome editing
136
by CRISPR-Cas9. Understanding the molecular basis of the c-NHEJ is thus central to improve
137
these major biotechnological applications. Here we analyzed the interaction between Ku and
138
DNA substrates of different lengths, to determine the most appropriate to the training and to
139
study the threading of Ku on DNA. The characterization of the interaction between Ku and
140
DNA was extensively studied in the laboratory by ITC, MST (Tadi et al., 2016; Nemoz et al.,
141
2018; Gontier, Chapter of MiMB, in press), switchSENSE, AUC, BLI (data not published) and,
142
more recently by other techniques not used during the training school (SPR, MDS or FRET).
143
One Ku occupies about 18 bp on DNA. Several Ku molecules can thread on DNA when the size
144
of the DNA is longer than 18bp, and a long DNA can be covered by one Ku molecule every
145
18bp.
146
We present in this article the results obtained by 20 students during a European Training
147
School in Molecular Scale Biophysics that took place from June 3rd to 7th, 2019 at I2BC at Gif-148
sur-Yvette, France. We report the protocols used to analyze the two systems under study
149
(protein/protein and protein/DNA interactions) using the six biophysical methods mentioned
150
above. The results obtained by the students during this week are shown and compared to our
151
previous published data when available. Finally, we compare the advantages and drawbacks
152
of the different approaches used during this training and present some feedbacks from the
153
students, allowing to have a global overview of the pros and cons of these six complementary
154 biophysical approaches. 155 1 2 3 4 5 6 7 8 9 10 11 12 13 14 15 16 17 18 19 20 21 22 23 24 25 26 27 28 29 30 31 32 33 34 35 36 37 38 39 40 41 42 43 44 45 46 47 48 49 50 51 52 53 54 55 56 57 58 59 60 61
Materials and Methods
156
Biophysical approaches in solution that do not require labeling of an interaction partner
157
Size Exclusion Chromatography with Multi-Angle Laser Light Scattering detection
(SEC-158
MALS): SEC-MALS allows to determine the absolute molar mass of the components of a
159
protein/multiprotein sample. It indicates if elution peaks are homogenous in term of protein
160
composition or if they are composed of mixtures, either of different oligomers or of different
161
conformers. SEC-MALS allows size determination if an online Dynamic Light Scattering (DLS)
162
detector is included in the setup (Folta-Stogniew, 2006). We used an HPLC system from
163
Shimadzu coupled to a MALS detector (miniDAWN TREOS) plus a DLS detector (QELS), and a 164
refractometer (optilab T-rEX) from Wyatt technologies (Fig. S1). To run an experiment, one
165
needs 1 L of running buffer to equilibrate the column and detectors, and 2 mg/mL of protein
166
(for MW of 20 kDa), down to 0.5 mg/mL if the MW is higher than 150 kDa. Depending of the
167
column used, the volume of the sample (30 µL for Bio-SEC-3 Agilent, 50 µL for KW-803/804
168
Shodex, and 100 µL for Superose 6, Superdex 75 or Superdex 200 increase 10/300 GL Cytiva) 169
and the time of elution can differ. A run (including an equilibration step and a control BSA
170
sample) takes typically a few hours and consumes about 40-200 µg of sample.
171
Isothermal Titration Calorimetry (ITC): ITC allows the direct, and thorough thermodynamic
172
characterization of interactions between molecules in solution with no limitation of partner
173
size (Holdgate, 2001; Krell, 2008; Velazquez-Campoy and Freire, 2006) and without labeling.
174
ITC is an equilibrium solution technique to quantify dissociation constants (KD) values, but also 175
other interaction parameters (enthalpy, entropy, stoichiometry, and heat capacity). ITC is not
176
affected by the optical properties of the samples, but may be very sensitive to the composition
177
of the buffer (e.g. presence of DMSO or mismatches between solutions). For the ITC
178
experiments, we used three instrument models: VP-ITC, ITC200 and PEAQ-ITC all from
179
Malvern Panalytical (Fig. S1). One of the interacting partner is placed in a cell (1.4 mL for the 180
VP-ITC, 200 µL for the ITC200 and PEAQ-ITC) and the other in a syringe (300 µL for the VP-ITC,
181
40 µL for the ITC200 and PEAQ-ITC). Sequential injections are made from a syringe (5-10 µL
182
for the VP-ITC, 1-2 µL for the ITC200 and PEAQ-ITC). In the data described here, we used
80-183
990 µg of the molecule in the cell, and 130-320 µg of the molecule in the syringe. The transient
184
heat effect due to complex formation (and other potential unspecific phenomena) upon
185
partner injection is measured as the titration progresses, from which the binding isotherm is
186 1 2 3 4 5 6 7 8 9 10 11 12 13 14 15 16 17 18 19 20 21 22 23 24 25 26 27 28 29 30 31 32 33 34 35 36 37 38 39 40 41 42 43 44 45 46 47 48 49 50 51 52 53 54 55 56 57 58 59 60 61
constructed.
187
Biophysical approaches with a partner immobilized on a surface
188
Bio-Layer Interferometry (BLI): BLI is a fast, high throughput and label-free technology for
189
measuring biomolecular interactions analyzing the interference pattern of white light
190
reflected from a layer of immobilized macromolecules on a biosensor tip and an internal
191
reference (Abdiche et al., 2018). It enables real-time analysis for determination of affinity,
192
kinetics and concentration, with one of the binding partners immobilized onto the biosensor
193
surface (ligand) and the other in solution (analyte). This microfluidic-free technology is
194
particularly adapted for performing binding assays in crude lysates or cell culture media. We
195
used an Octet RED96e during the training, and previously a RED384, both from FortéBio (Fig.
196
S1). We used 1-5 µg/mL of ligand to load NTA sensors for 20-120 s for low density or 120-600
197
s for high density, and a range of at least 7 (2-fold dilutions starting at 100-200 nM) of the
198
analyte with an association time of 600-900 s. We consumed per run about 8 µg of protein A3,
199
and 400 ng of 42 bp biotinylated DNA for the immobilization, and about 2-14 µg of respective
200
analytes. The concentration of ligand could be reduced (at least by 2) in favor of a longer
201
incubation. The consumption of the analyte, depends on the affinity of the interaction, as the
202
concentrations used should range from KD /20 to 10 x KD. 203
switchSENSE: switchSENSE technology is based on short DNA nanolevers (48 bp in our case),
204
which are immobilized on gold electrodes in a microfluidic channel. The intrinsically negatively
205
charged DNA nanolevers can be electrically actuated (“switched”) on the gold surface to
206
oscillate at high frequencies (Knezevic et al., 2012). A switchSENSE microfluidic biochip
207
contains four flow channels, each containing six gold electrodes. Switching of the DNA is
208
mediated by alternating the voltage across the gold surface. The motion of the levers is
209
tracked in real time (µs scale) via time-resolved single photon counting detecting a fluorescent
210
probe present on the immobilized DNA strands. The complementary DNA strands can be
211
cross-linked to a ligand via amine or thiol coupling or click-chemistry. By hybridization of this
212
conjugated complementary strand to the surface-tethered DNA nanolever, the surface is
213
functionalized with the ligand of interest. Upon binding of an analyte, the hydrodynamic
214
friction of the levers is affected and subsequently the movement of the levers is slowed down.
215
This change in switching speed is used by the system to determine the size (Dh) or 216
conformational changes of ligands and complexes. The kinetics of molecular interactions (kON, 217 1 2 3 4 5 6 7 8 9 10 11 12 13 14 15 16 17 18 19 20 21 22 23 24 25 26 27 28 29 30 31 32 33 34 35 36 37 38 39 40 41 42 43 44 45 46 47 48 49 50 51 52 53 54 55 56 57 58 59 60 61
kOFF, KD) can be followed using two measurement modes: dynamic or static. In the first case, 218
analyte binding is measured through the change of the oscillation rate of the electrically
219
actuated DNA nanolevers (changes in dynamic response). In the second case, the DNA
220
nanolevers are kept at an upright position, in a constant electric field, and analyte in close
221
proximity to a dye can alter the local chemical environment resulting in a fluorescence change
222
(also called Fluorescence Proximity Sensing). Binding is then measured thanks to the
223
fluorescence intensity variation of the functionalized nanolever. For the switchSENSE
224
experiments, we used a DRX2 device from Dynamic Biosensors with two LED light sources (for 225
the excitation of red and green fluorophores) (Fig. S1). In all cases, a hundred µg of protein
226
where enough to generate cross-linked complementary strands (cNL-DNA) for several round
227
of experiments, since one measurement needs only 40 µL of 100 nM DNA-protein conjugate.
228
A sizing measurement classically takes less than an hour. The amount of analyte needed for a
229
kinetic experiment depends on the overall affinity, which delimits flow rates, and
230
association/dissociation times to be used. During association, a too slow flow rate can be the
231
cause for mass transport limitation effect and during dissociation an inadequate flow rate can
232
result in re-binding effects. Here we used flow rates of 100-500 µL/min, association times of
233
80-300 s, and 1500 s of dissociation time. In sample quantities, we used 150 ng of the
cross-234
linked ligands, and 2-20 µg of its partner for a series of 3 concentrations.
235
Biophysical approaches with a labeled partner
236
Analytical UltraCentrifugation with Fluorescence Detection (AUC-FDS): AUC is a powerful
237
technique for the characterization of macromolecules and macromolecular self- and
hetero-238
association processes in solution. It was used here with labeled protein or DNA, but it can be
239
used with non-labeled material like SEC-MALS and ITC. An analytical ultracentrifuge is a
high-240
speed centrifuge equipped with one or more detectors (absorbance/interference,
241
fluorescence) allowing to monitor sedimentation in real time. Two types of complementary
242
experiments can be performed, sedimentation velocity and sedimentation equilibrium (Zhao
243
et al., 2013). Sedimentation velocity experiments allow to determine the size distribution of
244
species, their aggregation and oligomerization, sedimentation coefficients, hydrodynamic
245
radius, shape and molar masses, their stoichiometry and KD (by isotherm fitting sedimentation 246
coefficients measured at various concentrations). Sedimentation equilibrium is suited for
well-247
defined samples, and gives molar mass and KD information. The centrifugation speed can be 248 1 2 3 4 5 6 7 8 9 10 11 12 13 14 15 16 17 18 19 20 21 22 23 24 25 26 27 28 29 30 31 32 33 34 35 36 37 38 39 40 41 42 43 44 45 46 47 48 49 50 51 52 53 54 55 56 57 58 59 60 61
set between 600 and 260 000 g allowing to study all sizes of macromolecules. The duration of
249
sedimentation experiments ranges from 2 h to several days (Fig. S1). For the AUC-FDS
250
experiments we used a ProteomeLab XL-I ultracentrifuge from Beckman Coulter equipped
251
with a Fluorescence Detection System (FDS) from AVIV Instruments (Fig. S1). A sedimentation
252
velocity experiment requires 100-450 µL of sample at 0.3 to 1.5 OD, for
253
absorbance/interference detection, and 5-60 nM concentration, for fluorescence detection,
254
whereas sedimentation equilibrium requires 130 µL at 0.2 to 0.5 OD. In interference, the limit
255
of detection is 0.1 mg/mL, but in absorbance it depends on sample extinction coefficients. To
256
produce the data described here, we used about 1-3.5 µg of the fluorescent molecule and
8-257
80 µg of the non-fluorescent molecule.
258
Microscale Thermophoresis (MST): MST is a novel technology for the analysis of biomolecules
259
based on the modification of fluorescence intensity induced by the temperature, due to
260
Temperature Related Intensity Changes (TRIC) and the directed movement of particles in a
261
microscopic temperature gradient (thermophoresis) (Asmari et al., 2018; Jerabek-Willemsen
262
et al., 2011). Thermophoresis is influenced by a combination of changes at the level of the
263
hydration shell, shape, charge…, (all the parameters that influence the Soret coefficient) of
264
biomolecules, which result in differences of movement along the temperature gradient as well
265
as the brightness of the fluorescent tag. MST provides information on the binding affinities
266
with good accuracy and sensitivity in the pM to mM range. This technology allows
267
immobilization-free measurement of interactions in any buffer and complex biological liquid,
268
but requires one of the two partners to be labeled with a fluorescent dye to measure
protein-269
protein interactions (there is also a label free instrument that detects the intrinsic
270
fluorescence of proteins). Any size of unlabeled molecules can be used (from ions, to large
271
proteins). We used a Monolith NT.115 blue/green and red/blue from NanoTemper
272
Technologies (Fig. S1). MST experiments, performed in capillaries, require a low sample 273
consumption (200 µL at 20 nM of the fluorescent molecule, and 20 µL of the non-fluorescent
274
molecule at the highest concentration needed, depending on the expected KD). To produce 275
the data described here, we used about 50-350 ng of the fluorescent molecule and 6-12 µg of
276
the non-fluorescent molecule.
277
Sample preparation
278
AlphaReps are recombinant proteins produced by standard overexpression procedures in
279 1 2 3 4 5 6 7 8 9 10 11 12 13 14 15 16 17 18 19 20 21 22 23 24 25 26 27 28 29 30 31 32 33 34 35 36 37 38 39 40 41 42 43 44 45 46 47 48 49 50 51 52 53 54 55 56 57 58 59 60 61
E.coli (Guellouz et al., 2013). For our experiments, we used the following alphaRep proteins: 280
A3, which is the target and Rep17 and Rep2, which are the binders. Because A3 forms
281
homodimers at high concentration, it was used as ligand for real-time biosensors approaches
282
(BLI, switchSENSE) and was the labeled partner in AUC-FDS and MST experiments. In the
283
conditions used, we assumed A3 is a monomer, as the simultaneous presence of the
284
monomeric and dimeric forms would make the analysis difficult.
285
Ku is a recombinant protein produced by standard overexpression procedures in insect cells
286
(Nemoz et al., 2018). For our experiments, we used different lengths of dsDNA depending on
287
the assay format. Shorter DNA are not adapted for biosensor approaches, since a DNA too
288
close to the surfaces will hinder its interaction with Ku. DNA is practical to work with, because
289
it is easy to modify and is commercially available. For immobilized on BLI biosensors and for
290
detection in AUC-FDS and MST, we ordered biotinylated and 5-Carbofluorescein
(5-FAM)-291
labeled DNA oligonucleotides, respectively.
292
To perform biophysical characterization measurements, samples of high purity, stability and
293
monodispersity are needed (Fig. S2). All proteins were dialyzed to eliminate glycerol from the
294
storage buffer, which can interfere with the measurements. We chose the pH and ionic
295
strength of the buffer for the best solubility of the samples. To simplify as much as possible,
296
we used the dialysis buffer (20 mM Tris-HCl pH 8, 150 mM NaCl, 5 mM -mercaptoethanol) as
297
running buffer in most experiments. Due to the particularities of each approach and
298
measurement devices, there are some limitation in the buffer choice. In some cases, blocking
299
agents were required, such as 1mg/mL BSA, especially for low protein concentrations (in the
300
nM range), to prevent surface adsorption, as well as detergents, such as 0.1 % Tween-20, to
301
reduce surface tension (capillaries, chip, biosensors). For AUC-FDS, we had to avoid Tris-HCl
302
or HEPES above 20 mM, which can cause problems at 230 nm wavelength, and be aware of
303
other absorbent molecules (nucleotides, old DTT or -mercaptoethanol). For MST experiment,
304
we used the commercial MST buffers (50 mM Tris-HCl pH 7.4, 150 mM NaCl, 10 mM MgCl2, 305
0.05 % Tween-20) for Ku-DNA and, Roti®-Stock 1x PBS (10 mM Na2HPO4, 2 mM KH2PO4 pH 306
7.6137 mM NaCl, 2.7 mM KCl, 0.005% Tween 20) for A3-Rep17. For switchSENSE sizing
307
experiments Dh estimation, a low salt buffer is required (10 mM Tris-HCl, 40 mM NaCl, 0.05 % 308
Tween-20, 50 µM EGTA, 50 µM EDTA).
309 1 2 3 4 5 6 7 8 9 10 11 12 13 14 15 16 17 18 19 20 21 22 23 24 25 26 27 28 29 30 31 32 33 34 35 36 37 38 39 40 41 42 43 44 45 46 47 48 49 50 51 52 53 54 55 56 57 58 59 60 61
Results
310
Biophysical measurements of alphaRep interactions
311
We characterized the interaction of A3 with its binders Rep2 and Rep17 using the following
312
techniques presented in the Fig. 1: in solution approaches, which do not require labeling
(SEC-313
MALS and ITC), in solution approaches that require labeled protein or DNA (MST and
AUC-314
FDS), and surface approaches (BLI and switchSENSE). The students performed the
315
measurements presented here during the training (Fig. 2, Fig. S3 and Table S1). The studied
316
interactions data represent limited value due to students measuring and protein
317
concentration as common denominators, but added benefits of putting the techniques in
318
context. For most of them, additional measurements and controls are needed. When
319
available, we mention the values that have been reported for some approaches in previous
320
articles.
321
AlphaRep interactions measured by label free in solution approaches
322
Due to time limitations, the SEC-MALS experiments were performed in our platform prior to
323
the training. We used a Superdex 200 increase 10/300 GL column (Cytiva), and compared
324
three different runs with A3 alone, Rep2 alone and A3-Rep2 complex at 2 mg/mL
325
concentration each. A3 eluted as a dimer with a molar mass of 44.8 ± 0.4 kDa and, a
326
hydrodynamic radius of 3.0 ± 0.2 nm. Rep2 eluted as a monomer with a molar mass of 11.6 ±
327
0.9 kDa. The Rep2 concentration was insufficient, in view of the small molar mass, to make
328
accurate sizing measurement by DLS. Finally, the A3-Rep2 complex eluted before the free
329
proteins, with a molar mass of 65.5 ± 0.4 kDa and hydrodynamic radius of 4.0 ± 0.2 nm (Fig.
330
2b). The stoichiometry was determined by using the protein conjugate method (Loiseau et al.,
331
2017). Accurate mass can be calculated from MALS data with this method, which uses two
332
concentration detectors simultaneously (a refractometer and UV spectrophotometer), and
333
information about refractive index increment (dn/dc) and UV extinction coefficient of each
334
component. In our case, the complex corresponds to one dimer of A3 and two Rep2
335
molecules.
336
Preparatory ITC experiments were performed in our platform on a PEAQ-ITC instrument with
337
A3 in the cell at 18 µM and Rep17 in the syringe at 187 µM (Fig. S3a). Three different groups
338
of students did a triplicate measurement (Fig. 2c) during the training using the same
339 1 2 3 4 5 6 7 8 9 10 11 12 13 14 15 16 17 18 19 20 21 22 23 24 25 26 27 28 29 30 31 32 33 34 35 36 37 38 39 40 41 42 43 44 45 46 47 48 49 50 51 52 53 54 55 56 57 58 59 60 61
instrument. We observed bi-phasic thermograms, and isotherms were fitted using a model of
340
two identical binding sites with cooperativity. This cooperativity could stem from the
341
propensity of A3 to form homodimers at µM concentration as shown by SEC-MALS (Freire et
342
al., 2009; Vega et al., 2015). We could estimate two KD values, the first KD corresponds to an 343
interaction with a tight affinity (KD1 0.5 - 0.7 nM) and the second one to a weaker affinity (KD2 344
16 – 32 nM). With the obtained parameters for each site, described in the table at the bottom
345
of thermograms, an average global affinity (Wyman and Gill, 1990) could be calculated
346
(geometric mean of both dissociation constants: KD,av = sqrt(KD1 x KD2), which for each assay 347
was 3.9 nM, 3.1 nM, and 3.2 nM, close to that obtained with other techniques. Data were
348
analyzed during the training using the Origin software and the new PEAQ ITC software for
349
comparison.
350
AlphaRep interactions measured by biophysical approaches with a partner immobilized on
351
a surface
352
Preliminary BLI experiments were performed before the training on an Octet RED384
353
instrument where His-tagged A3 protein was captured on Ni-NTA sensors at 5 µg/mL for 20 s
354
and Rep17 concentration ranges from 200 nM to 1.56 nM. In these conditions, in which A3 is
355
most probably in a monomeric form, the calculated kinetic rates were kON of 1.3 10+5 M-1s-1, 356
kOFF of 5.9 10-3 s-1 and KD of 22.4 nM (data not shown). We observed that the fit was not correct 357
with a single site model and that residuals showed systematic errors. During the training, a
358
duplicate experiment was performed on an Octet RED96e in a buffer containing 1 mg/mL BSA
359
and 0.1 % Tween-20 to limit the non-specific binding. In this case, the fitting was improved
360
(Fig. 2d). We obtained the following preliminary values: kON of 2.6 ± 0.7 10+5 M-1s-1, kOFF of 7.6 361
± 0.7 10-4 s-1,K
D of 3.2 ± 1.1 nM. The KD measured from the plateau of the curve (steady state) 362
was of 3.3 ± 0.8 nM, close to the one obtained from kinetics (Fig. S3c).
363
For the switchSENSE experiments, we first coupled A3 with the DNA strand (cNL-B48), which
364
was complementary to the tethered DNA strand on the chip. In this case, the
surface-365
tethered DNA strand was labeled with a red fluorescent probe (NLB48-red dye). The
DNA-366
protein conjugate was purified using an anion-exchange-chromatography (Fig. S3d, top left).
367
We then hybridized the A3-cNLB48 with the NLB48 on the sensor surface at a concentration
368
of 100 nM. The hybridization step could be monitored in real-time by measuring the
369 1 2 3 4 5 6 7 8 9 10 11 12 13 14 15 16 17 18 19 20 21 22 23 24 25 26 27 28 29 30 31 32 33 34 35 36 37 38 39 40 41 42 43 44 45 46 47 48 49 50 51 52 53 54 55 56 57 58 59 60 61