Ecological insights through single-cell measurements of
marine bacteria
by
Cherry Gao
B.Sc. Interdepartmental Honours in Immunology McGill University (2012)
Submitted to the Department of Biological Engineering in partial fulfillment of the requirements for the degree of
Doctor of Philosophy at the
Massachusetts Institute of Technology September 2020
©2020 Massachusetts Institute of Technology. All rights reserved.
Signature of Author: ………. Cherry Gao Department of Biological Engineering August 14, 2020
Certified by: ………..… Roman Stocker Thesis Supervisor Professor of Civil and Environmental Engineering
Accepted by: ………. Douglas A. Lauffenburger Thesis Committee Chair Ford Professor of Biological Engineering, Chemical Engineering, and Biology
Ecological insights through single-cell measurements of
marine bacteria
by
Cherry Gao
Submitted to the Department of Biological Engineering on August 14, 2020 in partial fulfillment of the requirements for the degree of
Doctor of Philosophy in Biological Engineering
Abstract
Bacteria in the ocean, though invisible to the naked eye, play an indispensable role in facilitating life on Earth by driving chemical reactions that are essential to the planet’s habitability. Some marine bacteria, however, cause disease outbreaks that are capable of rapid and massive
destruction of ecosystems. Although individual bacterial cells are ~1 µm in size, their collective action enables large-scale nutrient fluxes throughout the marine food web, as well as wreak havoc in marine systems with major socioeconomic consequences for humans. In this Thesis, I seek to connect single-cell measurements of behavior and metabolism of marine bacteria to ecological processes that shape global biogeochemical cycles and influence ecosystem health. In particular, I focus on the impact of microbial activities on two globally-relevant contexts: (1) the biogeochemical cycling of sulfur, a chemical element that is essential to life, and (2) coral disease, which threatens the reef ecosystems that support marine biodiversity and provide food security for many human coastal communities. In Chapter 1, I describe the development of synthetic biology tools for the construction of fluorescent reporters in a marine bacterium
(Ruegeria pomeroyi). These engineered reporter strains enabled the investigations in Chapter 2, which presents the first single-cell measurements of the transcriptional response of R. pomeroyi to different concentrations of dimethylsulfoniopropionate (DMSP), a pivotal compound in the oceans’ carbon and sulfur cycles and a key chemical currency in marine microbial interactions. These measurements revealed the importance of microscale DMSP hotspots in marine sulfur cycling. In Chapter 3, I describe the simultaneous measurements of behavior (through microscopy) and gene expression (through RNA sequencing) of a coral pathogen, Vibrio coralliilyticus, to investigate the sequence of microscopic events preceding infection. The Appendix describes the methodology of tracking single cells over time through quantitative microscopy and high-throughput image analysis. The application of new tools from biological engineering to marine microbial ecology presents an unprecedented opportunity to understand the connections between single-cell behaviors, and ecosystem- and global-scale processes.
Thesis Supervisor: Roman Stocker
Acknowledgements
I would like to acknowledge the guidance and support of my Thesis Supervisor, Roman Stocker. Roman’s dynamic leadership inspired me to straddle not only scientific fields, but also continents and academic institutions. He has been a terrific role model from whom I have learned how to approach problems with scientific rigor and communicate discoveries effectively. I would like to thank the members of my globally-distributed Thesis Committee, Doug Lauffenburger,
Katharina Ribbeck, and Justin Seymour, for their guidance delivered sometimes locally, and sometimes remotely. The close mentorship of Jean-Baptiste Raina and Vicente Fernandez has been indispensable throughout my PhD, and I am extremely thankful to have had JB and Vicente as my mentors.
I am deeply grateful to the National Science Foundation for supporting my graduate studies through the Graduate Research Fellowships Program. I would like to acknowledge the training programs that granted me the incredible opportunities to gain field experiences in oceanography research, first at the University of Hawaii (C-MORE Summer Course on Microbial
Oceanography), and second at Palmer Station in Antarctica (NSF Advanced Training Program in Antarctica for Early-Career Scientists). I am also grateful to the Department of Biological
Engineering for the unwavering commitment to support students, including myself.
I am privileged to have been a part of many enriching communities at both MIT and at ETH Zurich. I would like to thank my invaluable friends in the Stocker lab and Parsons (Building 48), whose curiosity, intelligence, and humor have made each day of my PhD journey a joy,
including during the COVID-19 pandemic. I also thank the Sidney Pacific Graduate Community, Graduate Student Council Sustainability Subcommittee, MIT Concert Choir, Akademischer Chor Zürich, ETH Entrepreneur Club, MIT Sandbox Innovation Fund, The Martin Trust Center for MIT Entrepreneurship, and the MIT Delta V accelerator for enabling my personal growth and granting me the freedom to explore.
Most importantly, I would like to thank my family for their love, support, and encouragement throughout my life and time at MIT. I dedicate this PhD Thesis to my mother and father, who have sacrificed so much to make my dreams a reality.
Table of Contents
Abstract ... 3
Acknowledgements ... 4
Table of Contents ... 5
Introduction ... 7
Microorganisms in the ocean facilitate life (and death) on Earth. ... 7
Bacterial catabolism of dimethylsulfoniopropionate in the global sulfur cycle. ... 8
Mucus is the host-pathogen interface in coral disease. ... 9
Single-celled measurements in marine microbial ecology. ... 10
Chapter 1. Genetic engineering of Ruegeria pomeroyi DSS-3 ... 12
1.1 Overview of engineered strains of DSS-3 ... 13
1.2 Plasmid vectors for engineering DSS-3 ... 16
1.3 Transformation of DSS-3 ... 17
1.4 Constitutive fluorescent protein expression in DSS-3 ... 19
1.5 Single-color protein fusion reporter ... 23
1.6 Single-color promoter fusion reporter ... 26
1.7 Tri-color promoter fusion designs ... 28
1.8 Conclusions ... 38
1.9 Acknowledgements ... 38
Chapter 2. Single-cell bacterial transcription measurements reveal the importance of dimethylsulfoniopropionate (DMSP) hotspots in ocean sulfur cycling ... 40
2.1 Abstract ... 40
2.2 Introduction ... 41
2.3 Results and Discussion ... 42
2.4 Methods ... 50
2.5 Figures ... 64
2.6 Supplementary Figures and Tables ... 71
2.8 Supplementary Notes ... 93
2.9 Acknowledgements ... 97
2.10 Author contributions ... 98
Chapter 3. Coral mucus rapidly induces chemokinesis and genome-wide transcriptome shifts toward pathogenesis in a bacterial coral pathogen ... 99
3.1 Abstract ... 99
3.2 Introduction ... 100
3.3 Materials and methods ... 101
3.4 Results ... 106 3.5 Discussion ... 112 3.6 Figures ... 116 3.7 Supplementary Methods ... 124 3.8 Supplementary Figures ... 129 3.9 Supplementary Tables ... 147 3.10 Supplementary Discussion ... 160 3.11 Acknowledgements ... 165 3.12 Author contributions ... 166
Conclusions and Future Directions ... 167
Appendix. Quantitative microscopy and image analysis ... 170
A1. Image analysis for cellular fluorescence quantification ... 170
A2. Image analysis for phytoplankton-bacteria co-incubation experiment ... 175
A3. Video analysis for cell segmentation, swimming track reconstruction, and speed calculation ... 178
A4. Motile and non-motile cell determination ... 180
Introduction
Microorganisms in the ocean facilitate life (and death) on Earth.
Marine microorganisms facilitate life on Earth by driving chemical reactions that are essential to the planet’s habitability. However, a minority of microorganisms in the ocean can be harmful, and their toxic blooms or infections of marine animals are capable of rapid and massive destruction of ecosystems. Photosynthesis by single-celled marine phytoplankton sequesters carbon and produces oxygen on a scale equivalent to terrestrial plants1,2, and thus is responsible
for creating the largest carbon sink on Earth located in the deep ocean2,3, as well as the
production of much of the world’s oxygen. In a process called the microbial loop4,5, microbes
play an indispensable role in the ocean food web by recycling waste products of other organisms back into nutrients, thus forming critical links in the global cycling of essential elements
including carbon, nitrogen, phosphorous, and sulfur. Some of these microbial metabolisms, however, can cause the rapid expansion of a single microbial species whose local domination over other organisms can be deleterious in some contexts, such as disease and algal blooms. Thus, understanding and potentially harnessing microbial processes in the ocean have important implications on the future of our climate, marine-sourced food security, and ecosystem health.
The majority of the ocean’s biomass is concentrated in single-celled microorganisms (eukaryotes and prokaryotes), whose contribution to biomass far surpasses that of fish, crustaceans (e.g., Antarctic krill), and megafauna (e.g., whales) combined6. Of the total biomass in the ocean (~6
gigatons of carbon), 27% is estimated to comprise of prokaryotes (bacteria and archaea; ~1.6 gigatons of carbon)6, which are capable of diverse metabolic modes. Although these metabolic
activities are carried out by individual cells, their collective action across ~1029 prokaryotic cells
in the open ocean6,7 enables large-scale nutrient fluxes throughout the marine food web, as well
as wreak havoc through disease outbreaks that cause marine animal mortalities worldwide. Thus, individual cellular metabolic activities have major consequences at the global and ecosystem scales. In this Thesis, I focus on understanding the interplay between microbial metabolisms and large-scale consequences in two globally-relevant contexts: the biogeochemical cycling of sulfur
(Chapters 1 and 2), a chemical element that is essential to life, and coral disease (Chapter 3), which threatens the reef ecosystems that support marine biodiversity and provide food security for millions of humans8.
Bacterial catabolism of dimethylsulfoniopropionate in the global sulfur cycle.
The centerpiece of ocean sulfur cycling, dimethylsulfoniopropionate (DMSP), is a ubiquitous organosulfur compound in the marine environment. Up to 10% of the carbon fixed by
phytoplankton cells in the ocean is converted to DMSP9, resulting in a global DMSP production
exceeding one billion tons per year10. DMSP is an important currency in the ecological and
metabolic exchanges between phytoplankton and heterotrophic bacteria11, as it represents a
major nutrient source that fulfills much of the sulfur and carbon demand of bacteria (up to 95% and 15%, respectively12,13).
Heterotrophic marine bacteria catabolize DMSP via two competing catabolic pathways14 with
distinct consequences for global sulfur and carbon cycles: the demethylation pathway leads to the incorporation of both carbon and sulfur into bacterial biomass, whereas the cleavage pathway results in the incorporation of carbon only and the release of sulfur in the form of the
climatically-active gas dimethylsulfide (DMS). DMS represents a significant source of marine sulfate aerosols, which are a precursor of cloud condensation nuclei. Thus, the production of DMS via bacterial cleavage of DMSP is implicated in climate regulation through modification of cloud albedo (reflection of solar radiation)15,16 and therefore the Earth’s atmospheric
temperatures. However, the environmental factors that govern the utilization of one pathway over the other, and ultimately the production and release of DMS into the atmosphere, have remained elusive, marking a major gap in the mechanistic link between individual microbial processes and global-scale carbon and sulfur biogeochemical cycles.
The marine bacterium Ruegeria pomeroyi encodes both DMSP degradation pathways in a single cell, offering a unique opportunity to study the regulation of these metabolic pathways within the same organism. In Chapters 1 and 2, I investigate the effect of different ecologically-relevant concentrations of DMSP on the bacterial utilization of the demethylation vs. cleavage pathways.
The development of a synthetic biology toolbox in R. pomeroyi (Chapter 1) enabled the
construction of a suite of fluorescent reporter strains that visually report the expression of dmdA and dddW, the genes encoding the enzymes responsible for the first steps of demethylation and cleavage pathways, respectively.
Mucus is the host-pathogen interface in coral disease.
While many species of marine bacteria, such as R. pomeroyi, are important drivers of life-enabling chemical transformations, a minority of these bacteria are pathogens that cause disease outbreaks in ecosystems which are critical for human socioeconomic activities, such as coral reefs. Coral reefs are currently threatened by sea surface temperature rise and ocean
acidification. One major consequence of these environmental changes is the rise of opportunistic bacterial pathogens17–19 such as Vibrio coralliilyticus, which becomes virulent against their coral
host, Pocillopora damicornis, at high temperatures (above 27 °C)20. Increasing prevalence of
bacterially-mediated coral disease outbreaks due to rising seawater temperatures has caused coral mortality and the collapse of reef ecosystems worldwide17–19. Uncovering the sequence of events
in bacteria that lead to coral pathogenicity is critical in protecting these important ecosystems.
To fight against infections, corals are equipped with innate and adaptive-like immunity21, and
cultivate a beneficial microbiome which may contribute to their resilience against pathogens22,23.
Due to their sessile lifestyle, corals rely on the viscosity and movement of mucus—a part of the innate immunity that covers the coral surface—to concentrate a large population of bacteria (the coral microbiome)24,25, and to transport trapped particulates towards the gastrovascular cavity for
consumption, or away from the coral body into the reef wasters as waste products26. However,
recent studies have found that the pathogen V. coralliilyticus increases swimming speed in, and chemotaxis efficiency towards, the mucus of heat-stressed corals27,28. Thus, mucus represents a
critical chemical signal that dictates pathogen behaviors, and potentially, disease outcomes.
To date, infection studies of V. coralliilyticus have uncovered several virulence genes that are necessary for coral infection. These virulence genes include motility, chemotaxis, colonization, and host damage genes29–36. However, the sequence of behavioral and molecular events that lead
to pathogenicity by V. coralliilyticus remain a major open question. Thus, uncovering the temporal evolution of pathogen behavior in the moments leading up to infection marks a critical missing link in understanding the environmental factors that dictate coral disease outcome. In Chapter 3, I describe single-cell experiments to understand the behavior and gene expression of a bacterial coral pathogen in the context of its host mucus.
Single-celled measurements in marine microbial ecology.
For bacteria, the majority of the ocean is a food desert that is dotted by ephemeral nutrient hotspots produced by larger organisms such as eukaryotic phytoplankton37. Due to leakage and
diffusion, elevated DMSP concentrations may exist in the immediate area surrounding phytoplankton cells, representing nutrient oases for starved marine bacteria. Similarly, the diffusion of mucus from corals into the surrounding seawater provides nutrient-rich hotspots in the otherwise oligotrophic (nutrient-poor) reef waters. In both cases, the success of bacteria in finding and utilizing these nutrient opportunities relies on their ability to sense and respond rapidly to changes in their surrounding environment.
Bacterial behaviors and interactions, due to their small cell size and the ephemeral nature of nutrient distributions in the marine environment, occur at spatial lengths of micrometers and timescales of seconds to minutes38–40. Thus, to effectively study bacteria in the ocean, one must
utilize methods that enable the observation of these rapid and microscopic behaviors and activities. However, traditional marine microbial ecology studies have relied on large-volume sampling schemes in which precise manipulation of the environment and high temporal and spatial resolution measurements are difficult to impossible. Recent studies have chartered the way towards studying natural populations of marine microbes at their length and time scales through the utilization of single-cell techniques in genomics41–44, behavioral observations45, and
in-situ microscopy imaging46,47, which have enabled our understanding of the spatiotemporal
heterogeneity that govern microbial ecology in the ocean. Furthermore, recent advances in biological engineering tools, including synthetic biology, microfluidics, and microscopy offer the ability to precisely manipulate, measure, and model individual bacterial activities at the
In September 2013, the then Head of the Department of Biological Engineering at MIT, Doug Lauffenburger, defined biological engineering to the incoming class of PhD students as a cycle to “design, build, and test” biological systems “using ‘omics technology and other tools in molecular and cellular life sciences”. In this context, this Thesis describes my endeavor in harnessing the biological engineering toolbox towards the investigation of marine microbial processes with ecosystem-level and global implications. In Chapter 1, I describe the development of a synthetic biology toolbox in a DMSP-degrading marine bacterium, R. pomeroyi, that enabled the iterative design-build-test cycle towards the creation of a suite of fluorescent reporter strains. In Chapter 2, I present the application of these R. pomeroyi fluorescent reporter strains to perform single-cell transcriptional measurements in different concentrations of DMSP, which led to the discovery of the importance of microscale DMSP hotspots in marine sulfur cycling. In Chapter 3, I describe the simultaneous measurements of behavior (video microscopy) and gene expression (transcriptomics) of a coral pathogen to investigate the sequence of microscopic events leading up to infection. In the Appendix, I describe the quantitative microscopy methods and image analysis software development that enabled these single-cell investigations. The application of new tools from biological engineering to marine microbial ecology presents an unprecedented opportunity to understand the
Chapter 1.
Genetic engineering of Ruegeria pomeroyi DSS-3
This Chapter describes the development of genetic engineering tools in the marine bacterium R. pomeroyi DSS-3, and the intermediate engineering steps that led to the design and construction of the final fluorescent reporters for quantitative DMSP pathway gene expression used in Chapter 2. This Chapter describes my “design, build, test” cycle of genetic engineering in DSS-3, including failed attempts and lessons learned, which I record here in the hopes of reducing time and resources spent towards successful engineering of DSS-3 by future researchers.
DSS-3 was first isolated from the coast of Georgia, USA, by selection for enrichment in DMSP-amended seawater48,49. The DSS-3 genome was sequenced in 2004 (ref. 50), which facilitated the
generation of the first cloning protocols51 and genetic experiments involving knockouts and
complementation of genes, transposon mutagenesis, and RNA-seq and microarray
measurements10,52–55. In this Chapter, I first discuss the plasmid vectors (Section 1.2) and
transformation protocols (Section 1.3) that were tested in DSS-3, and their outcomes. The establishment of these genetic engineering protocols in our laboratory environment enabled the construction of the first fluorescent strain of DSS-3 (Section 1.4). Next, different fluorescent reporters of DMSP degradation gene expression (dmdA and dddW) were built and tested
iteratively (Sections 1.5–1.7). The work described in this Chapter represents, to our knowledge, the first (i) transformation of DSS-3 with large (up to 14.833 kb) plasmids; (ii) usage of a synthetic promoter (PA1/04/03) for constitutive expression in DSS-3; (iii) demonstration of fluorescent protein expression in DSS-3; and (iv) establishment of triparental mating protocol in DSS-3 with helper plasmid pRK600.
1.1 Overview of engineered strains of DSS-3
Several fluorescent strains of DSS-3 were constructed and tested with microscopy to assess their fluorescence signal outputs. Figure 1.1 shows a list of engineered plasmids transformed into DSS-3 that are discussed in this Chapter. Additional reporter strains are discussed in Chapter 2. All engineered plasmids transformed into DSS-3 that are discussed in both Chapters 1 and 2 are listed in Table 1.1.
Figure 1.1 | Overview of unpublished engineered plasmids transformed into R. pomeroyi DSS-3. All constructs were cloned into the plasmid vector pRK415 in the multiple cloning site (MCS). Open circles, origins of replication; black arrows, promoters; colored arrows, fluorescent protein genes; jagged line, 9-amino acid linker; T, terminators.
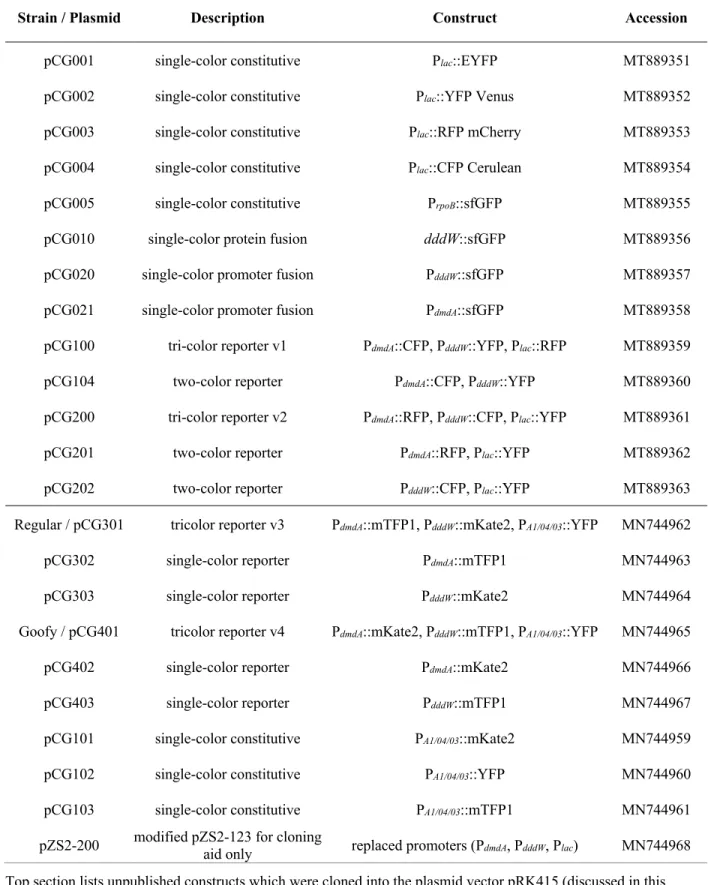
Table 1.1 | List of all engineered plasmids transformed into R. pomeroyi DSS-3.
Strain / Plasmid Description Construct Accession
pCG001 single-color constitutive Plac::EYFP MT889351
pCG002 single-color constitutive Plac::YFP Venus MT889352
pCG003 single-color constitutive Plac::RFP mCherry MT889353
pCG004 single-color constitutive Plac::CFP Cerulean MT889354
pCG005 single-color constitutive PrpoB::sfGFP MT889355
pCG010 single-color protein fusion dddW::sfGFP MT889356
pCG020 single-color promoter fusion PdddW::sfGFP MT889357
pCG021 single-color promoter fusion PdmdA::sfGFP MT889358
pCG100 tri-color reporter v1 PdmdA::CFP, PdddW::YFP, Plac::RFP MT889359
pCG104 two-color reporter PdmdA::CFP, PdddW::YFP MT889360
pCG200 tri-color reporter v2 PdmdA::RFP, PdddW::CFP, Plac::YFP MT889361
pCG201 two-color reporter PdmdA::RFP, Plac::YFP MT889362
pCG202 two-color reporter PdddW::CFP, Plac::YFP MT889363
Regular / pCG301 tricolor reporter v3 PdmdA::mTFP1, PdddW::mKate2, PA1/04/03::YFP MN744962
pCG302 single-color reporter PdmdA::mTFP1 MN744963
pCG303 single-color reporter PdddW::mKate2 MN744964
Goofy / pCG401 tricolor reporter v4 PdmdA::mKate2, PdddW::mTFP1, PA1/04/03::YFP MN744965
pCG402 single-color reporter PdmdA::mKate2 MN744966
pCG403 single-color reporter PdddW::mTFP1 MN744967
pCG101 single-color constitutive PA1/04/03::mKate2 MN744959
pCG102 single-color constitutive PA1/04/03::YFP MN744960
pCG103 single-color constitutive PA1/04/03::mTFP1 MN744961
pZS2-200 modified pZS2-123 for cloning aid only replaced promoters (PdmdA, PdddW, Plac) MN744968 Top section lists unpublished constructs which were cloned into the plasmid vector pRK415 (discussed in this Chapter). Bottom section lists published constructs cloned into plasmid vector pBBR1MCS-KanR (discussed in Chapter 2). GenBank accession numbers are provided.
1.2 Plasmid vectors for engineering DSS-3
In this Thesis, two plasmid vectors were utilized to genetically engineer DSS-3. First, pRK415 (GenBank EF437940) is a broad-host-range, 10.69 kb expression vector with a tetracycline resistance cassette56, which has been used in gene knockout and complementation studies in
DSS-3 (refs. 10, 52). The large size of pRK415 led to several challenges, including low electroporation efficiency and the potential effect of the burden of DNA replication on cell physiology. Furthermore, linearization of the vector backbone, which is necessary for insertion of e.g., fluorescent protein genes, was performed through restriction enzymes, since vector linearization through high-fidelity PCR amplification was difficult. The restriction enzyme method led to low yield of linearized vectors (posing a challenge for final plasmid construction through Gibson assembly), and fragments of the lacZ gene (encoding β-galactosidase) and its promoter (Plac) from the multiple cloning site (MCS) remained at the 5’ and 3’ ends of the insert,
which may have an effect on the expression of the DNA. Furthermore, the selection antibiotic of pRK415, tetracycline (administered at 20 µg/ml on agar plates and 3 µg/ml for liquid culture), is light-sensitive and thus may result in increased false-positive transformants.
I later converted to using a different plasmid vector, pBBR1MCS-KanR (GenBank U23751), which is a 5.144 kb vector. The pBBR1MCS series of plasmid vectors contain different antibiotic-resistance cassettes (kanamycin, tetracycline, ampicillin, or gentamycin), has been highlighted as a genetic tool for engineering Roseobacters57, and has previously been used for
complementation of a knocked out gene in DSS-3 (ref. 54). After testing different concentrations of kanamycin on wildtype DSS-3, 50 µg/ml was determined to be a selective concentration of the antibiotic, and pBBR1MCS-KanR was chosen for subsequent cloning work. The smaller size of pBBR1MCS-KanR vector backbone enabled the PCR amplification of the entire vector backbone without the MCS, thus eliminating the effect of any residual β-galactosidase gene on fluorescent reporter expression and performance (see Chapter 2 for detailed methods on cloning with pBBR1MCS-KanR).
1.3 Transformation of DSS-3
1.3.1 Electroporation
Electroporation has previously been utilized by others to transform DSS-3 (refs. 51, 52, 58, 59). Briefly, electrocompetent DSS-3 was prepared from a 500-ml liquid culture in 1/2 YTSS medium, grown overnight at room temperature until OD600 0.1–0.5 (see below for a note on
optical density). Growth was stopped by incubating on ice for 30 min. Cells were washed three times with sterile 10% glycerol (250 ml, 150 ml, then 100 ml) with gentle centrifugation (5000 × g for 10 min) at 4 °C. After the final centrifugation, concentrated electrocompetent cells were resuspended in 1 ml 10% glycerol, aliquoted in 100 µl, and kept frozen at –80 °C until electroporation.
Prior to electroporation, plasmids were methylated using the M.SssI CpG Methyltransferase (New England Biolabs), and DNA was purified using the DNA Clean & Concentrator kit (Zymo Research). Electroporation was performed on 100 µl electrocompetent DSS-3 with 5 µl of methylated and cleaned DNA in a 2 mm cuvette, using the Gene Pulser Xcell (BioRad)
electroporator with the following settings: 1.8 kV, 25 µF, 200 Ω. Post-electroporation recovery was initiated with the addition of 1 ml pre-warmed (30 °C) 1/2 YTSS to cells, which were subsequently transferred to 14-ml growth tubes.
Electroporation is a relatively high-cost and time-consuming transformation procedure that is extremely sensitive to chemical and environmental variability and human error. I experienced a period of time during which all DSS-3 electroporation attempts failed and did not yield any positive transformation colonies on selection plates. This was a laboratory-specific phenomenon, since electroporation of the same plasmids in another laboratory (Prof. Mary Ann Moran’s group at University of Georgia) led to positive DSS-3 transformants. Although the exact cause of this series of failed electroporation remains unknown, several steps can be taken to identify the problematic step should a future researcher encounters the same problem.
First, positive transformant yield seems to decrease with the duration of storage of
less than 1 week before electroporation if possible, and should not be used after 2 months of storage at –80 °C. If viability of frozen electrocompetent cells is questioned, one should streak out an aliquot on an agar plate to confirm that the frozen cells can form viable colonies.
Second, the optical density at which cultures are harvested for electrocompetent cell preparation has an effect on transformation efficiency. In one electroporation troubleshooting experiment with pCG201 (12.746 kb), electrocompetent cells that were harvested at OD600 of 0.1 yielded the
largest number of transformed cells, followed by OD600 0.19, 0.33, then 0.49. In the same
experiment, OD600 of 0.07 yielded no colonies.
Third, methylation of DNA should be confirmed with a BstUI (New England Biolabs) restriction enzyme digestion. If DNA is methylated, it should be protected from BstUI digestion.
Unsuccessful methylation of DNA may result from old S-adenosylmethionine (SAM).
Finally, if the plasmid is large (11–15 kb in this case), an initial recovery period of 4–6 h in 1/2 YTSS at 30 °C should be followed by an extended recovery period overnight in the presence of dilute selection antibiotic (3 µg/ml tetracycline for pRK415-based plasmids). Following
extended recovery, all cells should be plated on a selection agar plate (centrifuge first to remove most liquid). In my case, these recovery and plating procedures yielded 10–30 colonies on the selection plate 3 days after plating.
1.3.2 Triparental mating
Challenges with the electroporation protocol led me to start utilizing a tri-parental conjugation (mating) method to transform DSS-3 in the last few years of this Thesis (detailed methods in Section 2.4.4). The tri-parental conjugation method was successful for transforming plasmids with both pRK415 and pBBR1MCS vector backbones.
1.3.3 Genomic integration
Genomic integration of fluorescent reporters into the DSS-3 genome using the mini-Tn7
transposon system60,61 was briefly explored but failed to yield positive integration results. In this
(carrying the DNA fragment for insertion) into a bacterial cell leads to a single-copy insertion of the desired DNA fragment into a neutral part of the genome that is believed to not affect the host (attTn7 site located downstream of the glmS gene). For a genomic integration trial in DSS-3, the helper plasmid and the delivery plasmid (AKN132 from ref. 60 which carries a P1/04/03-DsRed expression cassette with gentamycin resistance in a pUC-based plasmid carrying the ColE1 origin of replication) were extracted by miniprep from E. coli. Following methylation and
column purification in separate vessels, the two plasmids were combined for electroporation into DSS-3. After recovery of 3.5 h or overnight in liquid 1/2 YTSS at 30 °C, cells were plated on 1/2 YTSS gentamicin (10 µg/ml) selection plates. Even after 6 days of incubation, plates showed no colonies.
The failure of these genomic integration trials in DSS-3 may be due to two reasons: (i) the ColE1 origin of replication in the delivery plasmid is not compatible in DSS-3, and/or (ii) the insertion site (attTn7) sequence encoded in the delivery plasmid does not match the sequence in the DSS-3 genome, leading to failed insertion. According to correspondence with the authors of ref. 60, the exact sequence of the delivery plasmid has been lost. Thus, further exploration of genomic integration with the mini-T7n would require some effort, including re-sequencing the 6.3 kb plasmid. Furthermore, genomic integration of a single copy of the fluorescent reporter construct, while eliminating the quantification challenge of variable copy number of a plasmid-based reporter, would most likely lead to low fluorescence signal that would mask low-level gene expression (as see in Chapter 2). Thus, I quickly moved on from genomic integration and focused solely on reporter construction in plasmids.
1.4 Constitutive fluorescent protein expression in DSS-3
To test whether fluorescent protein expression and subsequent microscopy imaging are possible in DSS-3, different colors of fluorescent proteins and constitutive promoters were inserted in the multiple cloning site (MCS) of pRK415 and subsequently electroporated into DSS-3.
1.4.1 lac promoter in pRK415
The 70-bp lac promoter (Plac) in pRK415 controls the expression of the lacZ gene (encoding
β-galactosidase) which is also the MCS of the plasmid. Thus, I first tested this pRK415 lac promoter to achieve constitutive fluorescence in DSS-3. The gene encoding EYFP (enhanced yellow fluorescent protein) was inserted in the MCS through double digestion using restriction enzymes (New England Biolabs) HindIII (5’ end of EYFP) and PstI (3’ end) to create the first engineered plasmid of this Thesis, pCG001 (
Table 1.1). Similarly, Venus YFP, mCherry RFP, and Cerulean CFP were inserted into the MCS using EcoRI (5’ end) and PstI (3’ end) to create pCG002, pCG003, and pCG004, respectively. Plasmids were electroporated into DSS-3 as described above.
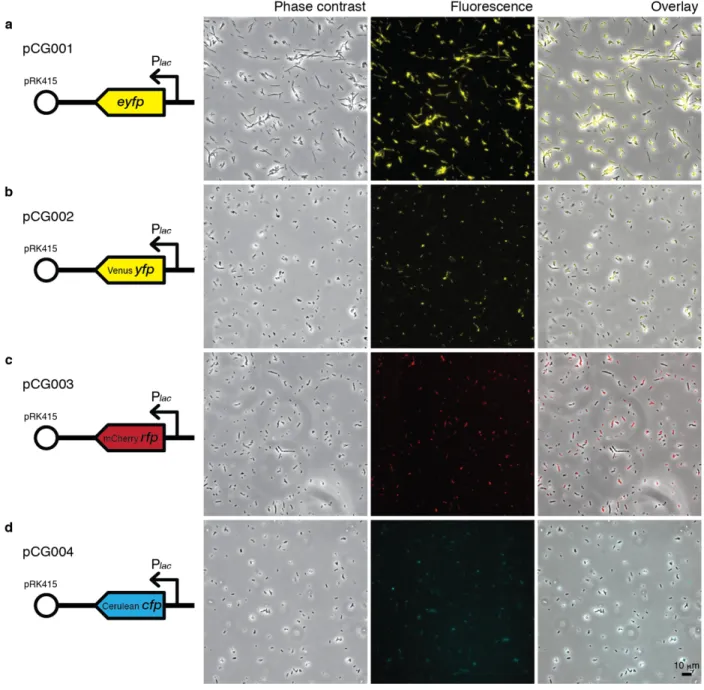
Fluorescence microscopy imaging of transformed DSS-3 confirmed the presence of fluorescence signals in appropriate color channels (Figure 1.2), thus confirming that the expression of
fluorescent proteins (across the color spectrum) is possible in DSS-3, and that the lac promoter in pRK415 induces constitutive expression in DSS-3. However, the fluorescence signals were weak, and required high exposure times (1 second) and gain setting on the camera for detection. A 5-h induction with the addition of 0.5 mM IPTG (activator of the lac promoter) during the exponential stage of growth of pCG002-transformed DSS-3 did not lead to detectable increase in fluorescence signal (not shown). These results suggest that the lac promoter, and possibly
Figure 1.2 | Microscopy images of constitutively fluorescent DSS-3 (lac promoter of pRK415). All cells were imaged after overnight growth (30 °C) in liquid 1/2 YTSS amended with 3 µg/ml tetracycline, using a 40× objective. (a) pCG001 (EYPF) images were acquired with an electron multiplying CCD (EMCCD) camera (iXon3 885; Andor Technology; 8 µm pixel; exposure 100 ms; gain 58), with fluorescence excitation from a metal halide white light source (Lumen 200) and a filter cube with 450±50 nm excitation, 485 nm bandpass, and 515 nm long-pass emission filters. (b–d) pCG002 (Venus YFP), pCG003 (mCherry RFP), and pCG004 (Cerulean CFP) images were acquired with an sCMOS camera (Andor Zyla 4.2; 6.5 µm pixel; exposure 1 second; gain 1), with fluorescence excitation from single-color LED light source (Lumencor) at 508 nm (b), 555 nm (c), 440 nm (d) and a tri-color ECFP/EYFP/mCherry filter cube (Chroma 69308). Different brightness adjustments of fluorescence images were used between fluorescence only and overlay images. Scale bar, 10 µm.
1.4.2 Promoter of a housekeeping gene (rpoB)
I next searched within the DSS-3 genome for housekeeping genes whose promoters may be suitable candidates of constitutive promoters. In particular, rpoB (SPO3508), which encodes the β subunit of RNA polymerase, was stably expressed in a microarray study of DSS-3 (ref. 62). The 293-bp sequence upstream of rpoB, which is arranged in an operon with rpoC (SPO3507) downstream was cloned out of the DSS-3 genome, and fused with the superfolder GFP (sfGFP) gene in the MCS of pRK415 to construct pCG005. Fluorescence microscopy of the overnight culture of the DSS-3 strain containing pCG005 showed extremely low fluorescence signals (not shown), thus leading to the conclusion that the 293-bp sequence may not contain the correct promoter sequence for rpoB, or that rpoB is expressed at a very low level.
1.4.3 Strong, constitutive, modified lac promoter: PA1/04/03
The modified lac promoter, PA1/04/03, was originally derived from Escherichia coli63 but has
been used for fluorescence tagging in diverse species of Gram-negative bacteria, including Vibrio anguillarum64, Marinobacter adhaerens65, Caulobacter crescentus66, Pseudomonas
putida60, and the Roseobacter Phaeobacter gallaeciensis67. Thus, I cloned the sequence
containing PA1/04/03 and the downstream putative RBS from the pXGFPC-2 Plac::mKate2 plasmid (used in C. crescentus by ref. 66) and fused this sequence to genes of mKate2 RFP, Venus YFP, and mTFP1 to construct pCG101, pCG102, and pCG103, respectively. The PA1/04/03 promoter yielded strong constitutive fluorescence in DSS-3 which was even visible macroscopically on a culture plate (Figure 1.3). These constitutively fluorescent strains were used in the final experiments described in Chapter 2.
Figure 1.3 | Photograph of a culture plate containing constitutively fluorescent DSS-3. The plasmids contain the PA1/04/03 promoter with genes of fluorescent proteins mKate2 (pCG101), Venus YFP (pCG102), and mTFP1 (pCG103).
1.5 Single-color protein fusion reporter
After confirming that fluorescent protein expression is possible in DSS-3, I investigated the feasibility of reporting DMSP degradation gene (dmdA and dddW) expression by fluorescence emission in DSS-3. A protein fusion approach was chosen to preserve the 1:1 stoichiometry between the DMSP enzyme and the fluorescent protein (Figure 1.4). The fluorescent protein, superfolder GFP (sfGFP) was chosen for its superior performance in protein fusions68. I opted to
first work with the cleavage gene, dddW, whose expression was dramatically upregulated (~70×) in DSS-3 incubated in DMSP55. A similarly large upregulation in my engineered reporter strain
would yield measurable fluorescence signal output.
Figure 1.4 | Protein fusion reporter construct in DSS-3 containing the putative promoter of dddW, and the
The plasmid pCG010 (12.387 kb) contained the putative promoter (500 bp) and gene sequence of dddW (456 bp) followed by a 9-amino acid linker (5'–Gly Gly Ser Gly Gly Ser Ser Gly Gly– 3’) and the gene sequence of superfolder gfp (714 bp), inserted in the pRK415 vector backbone (linearized by a PstI restriction digest) at the MCS through a 3-fragment Gibson assembly. The peptide linker, which was encoded in PCR primers as Gibson overhangs, were designed to be flexible and minimize steric hinderance between the two connected proteins (DddW and sfGFP) for proper protein folding. Glycine (Gly) confers flexibility to the peptide linker and has the smallest side chain, and the interspersed serine (Ser) improves the solubility of the multi-Gly chain69. To facilitate the protein fusion between DddW and sfGFP, the stop codon of dddW and
the start codon of superfolder gfp were omitted.
Incubation of the DddW-sfGFP protein fusion reporter with 2.5 mM DMSP led to upregulation of fluorescence within 65 min (Figure 1.5). Negative control in glucose did not show signal increase. These results suggest that the 500-bp sequence upstream of dddW contains a DMSP-responsive promoter that controls the expression of the DMSP cleavage gene. Furthermore, the protein fusion construct allowed the proper folding of sfGFP, which enabled the detection of its fluorescence signal.
However, fluorescence signals were weak and required high exposure time (1 sec) and gain (200) on a sensitive camera (EMCCD) to enable visualization. The expression of a fusion protein, in addition to the replication of a large plasmid, is likely energetically burdensome, which could lead to slow cellular processes such as protein production. Furthermore, the implications of more than doubling the genetic materials encoding dddW on downstream processes in DMSP catabolism is unclear. Thus, a more streamlined reporter design may promoter fusions, which I explore in the next section.
Figure 1.5 | Fluorescence of the single-color DddW-sfGFP protein fusion reporter strain of DSS-3 incubated in 2.5 mM DMSP. All cells were grown overnight (30 °C) in glucose-amended (2.5 mM) MBM with tetracycline (4 µg/ml) to OD600 0.26 and washed in non-amended MBM before treatment (0 h) with 2.5 mM DMSP (dark blue) or
glucose (black dotted) dissolved in MBM. One image per time point was acquired with an EMCCD camera (iXon3 885; Andor Technology; 8 µm pixel; exposure 1 sec; gain 200) and 40× objective, with fluorescence excitation from a metal halide white light source (Lumen 200) and the EGFP filter cube (Chroma 49002). Sample phase and fluorescence (false-colored) microscopy images of three cells are shown at time points 3–8 (black bar). Each displayed fluorescence image is an average of 5 frames taken consecutively as described above (each frame 1 sec exposure) to reduce background noise. Data points and error bars are average ± s.e.m. fluorescence outputs of cells after background subtraction. Glucose fluorescence was measured in the first 5 time points and averaged (dotted black line). Mean ± s.d. cell number in DMSP at time points 2–9 was 655±196; glucose at time points 2–5 was 456±124. Scale bar, 1 µm.
1.6 Single-color promoter fusion reporter
Promoter fusion, in which the expression of a fluorescent protein is controlled by the promoter of the gene of interest (dddW or dmdA), was explored next as a more efficient reporter design than protein fusion (Figure 1.6). Plasmids pCG020 (11.879 kb) and pCG021 (11.574 kb) contained the sfGFP gene fused to the putative promoter-containing 500-bp sequence upstream of dddW and 222-bp sequence upstream of dmdA, respectively, in the MCS of the pRK415 vector
backbone (linearized by a PstI restriction digest) through 3-fragment Gibson assembly. The 222-bp sequence upstream of dmdA avoids an overlap with an upstream gene (SPO1912) encoded in the opposite direction.
Figure 1.6 | Single-color promoter fusion reporter construct in DSS-3, each encoding sfGFP under the control of putative promoters of DMSP catabolism genes, dmdA (SPO1913) and dddW (SPO0453). Due to a cloning error, the sfGFP gene in pCG020 contains an extra leucine (Leu) before the stop codon.
Time-lapse fluorescence microscopy of a DMSP incubation experiment (Figure 1.7) revealed that the demethylation (PdmdA::sfGFP) reporter strain significantly upregulated fluorescence
signals starting at 110 min for both DMSP concentrations (1 mM and 1 µM) compared to glucose negative control (one-tailed t-test at each time point, p < 0.01). The cleavage
(PdddW::sfGFP) reporter strain showed faster significant upregulation (within 20 min) but only at
the higher concentration of DMSP (1 mM) compared to glucose (one-tailed t-test at each time point, p < 0.01). Furthermore, fluorescence signals at the first time point in glucose were 47.65 ± 4.39 a.u. for demethylation compared to 1.98 ± 0.16 a.u. for cleavage, suggesting that
demethylation is expressed at a higher baseline level than cleavage pathway in the absence of DMSP. These results agree with the results that were later obtained with the final, tri-color reporter strains (described in Chapter 2). The differences in the fluorescence outputs (y-axis values) between the two reporter strains is likely due to the large differences in the number of
cells in the incubation experiment rather than differences in expression levels of the two genes. The larger number of cells (1700 cells quantified at 65-min time point in glucose) of the cleavage (dddW) reporter likely led to faster depletion of DMSP, and thus fluorescence signals plateaued earlier and at lower signal values than the demethylation (dmdA) reporter (335 cells at 65 min in glucose) (Figure 1.7).
These results confirmed that the promoter fusion reporter design (Figure 1.7) yields stronger fluorescence signals than the protein fusion design (Figure 1.5). Strong fluorescence outputs are desirable for achieving a high signal-to-noise ratio, which is important for quantification of signals. Furthermore, these results confirmed that the 500-bp and 222-bp upstream of dddW and dmdA, respectively, contain DMSP-responsive promoters.
Figure 1.7 | Fluorescence of single-color promoter fusion reporter strains of DSS-3 incubated in 1 mM or 1 µM DMSP. All cells were grown overnight (30 °C) in glucose-amended (1 mM) MBM with tetracycline (3 µg/ml) and washed in non-amended MBM before treatment (0 h) with DMSP (1 µM, 1 mM) or glucose (1 mM) dissolved in MBM. One pair of phase contrast and fluorescence images per time point and treatment condition was acquired with an sCMOS camera (ORCA-Flash 4.0 V3; Hamamatsu Photonics; 6.5 µm pixel; exposure 300 ms) and 40× objective, with fluorescence excitation from a single-color LED light source (470 nm; Lumencor) and the EGFP filter cube (Chroma 49002). Data points and error bars are average ± s.e.m. fluorescence outputs of cells after background subtraction. Number of cells at t = 65 min (fourth time point) in the glucose condition was 1,700 for the cleavage reporter, and 335 for the demethylation reporter.
1.7 Tri-color promoter fusion designs
After validating the feasibility of constitutive fluorescence expression (Section 1.4) and
promoter-fusion reporter construction (Section 1.6) in DSS-3, I next combined these designs to build a tri-color promoter fusion reporter strain that would enable the gene expression
quantification of both DMSP pathway genes (dmdA and dddW) within a single cell. The third, constitutively expressed fluorescent protein enabled the quantification of fluorescence signal as a proxy of gene expression by providing a normalization factor to account for plasmid number and metabolic activity differences in cells. Below, I describe the two iterations of tri-color reporter designs that preceded the final versions (strains Regular and Goofy) that were published and described in Chapter 2.
1.7.1 Fluorescent protein choice
As of June 2020, FPbase lists 778 fluorescent proteins spanning the entire visible spectrum and each possessing different biochemical properties (www.fpase.org, ref. 70). The three fluorescent proteins incorporated into tri-color reporters were carefully chosen to optimize for maximum spectral separation (to minimize spectral leakage), fast maturation (to be as close to real-time as possible), monomeric structure (to preserve stoichiometry of the three fluorescent proteins), and high quantum yield (to enable detection of low gene expression). For tri-color reporter versions 1 and 2, this led to the choice of Cerulean CFP, Venus YFP, and mCherry RFP. In versions 3 and 4, the final reporter designs described in Chapter 2, contained mTFP1, Venus YFP, and mKate2 RFP.
1.7.2 Tri-color reporter version 1 (challenge of spectral leakage)
I drew inspiration from a tri-color promoter fusion plasmid that was built in the synthetic biology community by the Elowitz group71, pZS2-123, which contains three fluorescent proteins
(Cerulean CFP, Venus YFP, and mCherry RFP) fused to different inducible promoters. The three promoter fusion cassettes were separated by terminators to prevent transcriptional
read-through71. A modified tri-color promoter fusion scaffold, with the promoters swapped out for
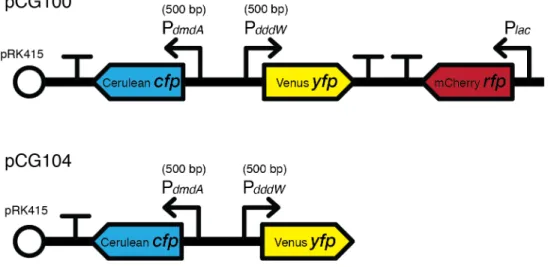
putative promoters of dddW and dmdA (500 bp upstream of each gene), was integrated into the MCS of pRK415, which led to a 14.833 kb plasmid (pCG100), transformed into DSS-3 by electroporation. A two-color version, pCG104 (13.631 kb), was also constructed as a control to ensure that the inclusion of the third color (mCherry RFP) does not interfere with the promoter activity patterns measured through CFP and YFP fluorescence signals.
Figure 1.8 | Tri-color reporter version 1 and the two-color reporter control in DSS-3, containing promoter fusions. The 500-bp upstream sequences of the two genes involved in DMSP catabolism (dmdA and dddW) were used as putative promoters. The third color (RFP) was expressed with a constitutive promoter, Plac, located at the MCS of pRK415.
Time-lapse fluorescence microscopy of this DSS-3 tri-color reporter strain incubated in different concentrations of DMSP revealed the concentration-dependent upregulation of both pathways (Figure 1.9). In the lowest four DMSP concentrations tested (2.3 µM–0.46 mM), the time point, as well as the magnitude of fluorescence, at which signals plateaued were
fluorescence signal did not plateau within the experimental duration (5.75 h). However, the temporal patterns of fluorescence signals of the demethylation (PdmdA::CFP) and cleavage
(PdddW::YFP) reporters of the tri-color strain were almost identical, albeit different magnitudes of
fluorescence signal values (y-axis, Figure 1.9), which may point to substantial spectral leakage between yellow and cyan fluorescence color channels. The two-color reporter (pCG104) strain showed similar fluorescence patterns (data not shown). This highlighted the need for better spectral separation of fluorescent proteins, which may be achieved through better optical setups of the microscope (e.g., limiting the excitation and emission wavelength ranges, and increasing detector sensitivity to increase the signal-to-noise ratio) to differentiate signals from different colors of fluorescent proteins. Furthermore, the fluorescence signals from the constitutively expressed Plac::RFP cassette of the tri-color strain were barely detectable, highlighting the need
for a stronger constitutive promoter. Overall, experiments with the tri-color reporter version 1 showed the feasibility of integrating three promoter fusion reporter cassettes into a single
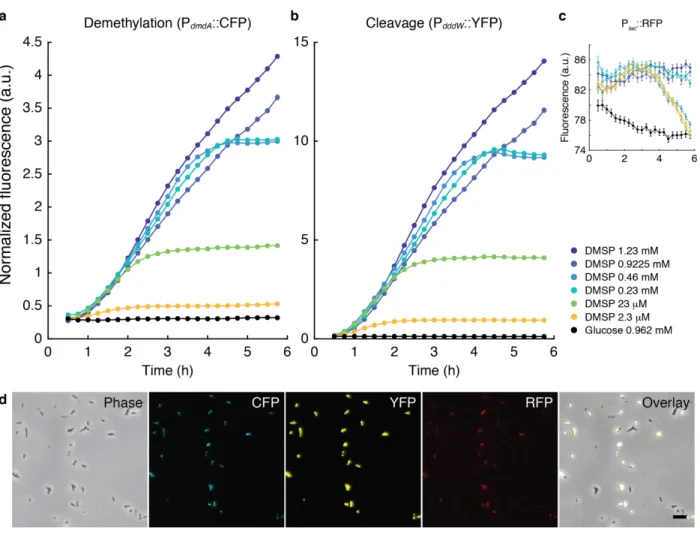
Figure 1.9 | Fluorescence of tri-color reporter (version 1) strain of DSS-3 incubated in different
concentrations of DMSP (2.3 µM–1.23 mM). All cells were grown overnight (23.1 °C) in glucose-amended (1 mM) MBM with tetracycline (3 µg/ml) and washed in non-amended MBM before treatment (0 h) with DMSP or glucose dissolved in MBM. At each time point, images at 20 different xy positions were acquired for each
experimental condition with an sCMOS camera (Andor Zyla 4.2; 6.5 µm pixel; exposure 200 ms for CFP and YFP, 400 ms for RFP; gain 4) and 40× objective with fluorescence excitation from single-color LED light source (Lumencor) with 100% power at 440 nm (a), 508 nm (b), 555 nm (c) and a tri-color ECFP/EYFP/mCherry filter cube (Chroma 69308). Only cells with constitutive RFP fluorescence intensities of greater than 25 a.u. were deemed RFP-positive and included for analyses. (a,b) Each cell’s CFP and YFP signals (after background subtraction) were normalized by the average RFP intensity at the same time point. Data points and error bars are mean ± s.e.m. normalized fluorescence of cells. (c) Mean ± s.e.m. of RFP fluorescence of cells after background subtraction. Mean ± s.d. number of RFP-positive cells across experimental conditions at the fourth time point (1.25 h) was 6900 ± 1583. (d) Sample microscopy images at 4 h (15th time point) of incubation with 1.23 mM DMSP. Scale bar, 2 µm. Number of cells at t = 65 min (fourth time point) in the glucose condition was 1,700 for the cleavage reporter, and 335 for the demethylation reporter.
1.7.3 Tri-color reporter version 2 (challenge of reporter cassette arrangement)
In the second iteration of tri-color reporters of DMSP degradation gene expression in DSS-3, several changes were made: (i) the colors of fluorescent proteins fused to the promoters of dddW and dmdA were changed, to simultaneously spectrally distance the two reporters as well as to assign a different color to each promoter compared to version 1, (ii) the 231-bp inter-promoter space between PdddW and PdmdA of pCG100 was eliminated such that the promoters are now
back-to-back, and (iii) only the 250-bp sequence was used as putative promoters of both dmdA and dddW. I previously showed that the 222-bp sequence upstream of dmdA was sufficient for activation by DMSP (Figure 1.7). Furthermore, bacterial promoters are typically shorter than 100 bp, containing two hexamer sequences at –10 and –35 bp upstream of the start of the gene72.
Thus, I reasoned that shortening the putative promoter sequences of dmdA and dddW would still lead to functional reporters. As a result, pCG200 was 13.972 kb, representing a 5.8% reduction in size (862 bp) compared to pCG100. Two-color reporter controls were also built, this time separating dmdA (pCG201) and dddW (pCG202) reporters into to two plasmids but both containing the constitutive Plac::YFP cassette to enable normalization to account for plasmid
copy number and metabolic activity variation.
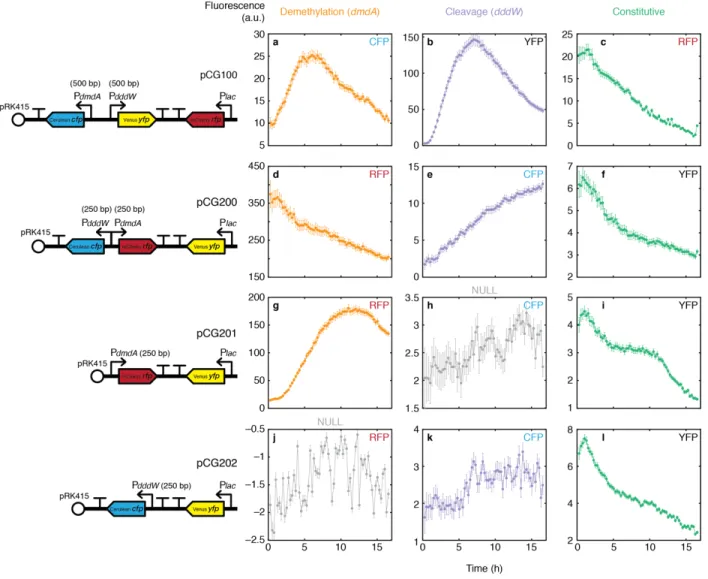
Figure 1.10 | Tri-color reporter version 2 and the two-color reporter control in DSS-3, containing promoter fusions. In an effort to decrease the size of the final plasmids, only the 250-bp upstream sequences of the two DMSP catabolism genes (dmdA and dddW) were used as putative promoters, without a spacer region between the two promoters. The third color (RFP) was expressed with a constitutive promoter, Plac, located at the MCS of pRK415.
Comparisons of fluorescence signals of tri-color reporter versions 1 and 2 incubated in 1 mM DMSP revealed that the direction and spacing of reporter cassettes on the DNA scaffold has a large impact on the accuracy of the reporters (Figure 1.11). As previously shown in Figure 1.9, tri-color reporter version 1 (pCG100) showed signal increase of both dmdA and dddW reporters in DMSP, which plateaued at ~6–7 h (Figure 1.11a–c). In contrast, tri-color reporter version 2 (pCG200) showed contrasting behaviors of dddW and dmdA reporters, whereby the dddW reporter signal increased as shown previously, but the dmdA reporter fluorescence decreased in DMSP in a temporal pattern that mimicked that of constitutive YFP (Figure 1.11d–f).
Furthermore, the dmdA reporter displayed high baseline fluorescence (362.48 ± 22.07 a.u. at the fourth time point, 62 min), suggesting that the back-to-back arrangement of promoters is causing bidirectional gene expression response that is not responsive to DMSP for dmdA (Figure 1.11d). The dmdA two-color reporter control (pCG201) containing solely the dmdA reporter and the constitutively expressed YFP showed the expected increase of the dmdA reporter (Figure 1.11g), suggesting that the absence of a spacer region between the putative promoters of dmdA and dddW caused the inappropriate behavior of the tri-color version 2. Furthermore, the dddW two-color reporter control (pCG202) was unresponsive to DMSP (Figure 1.11k), and showed a fluorescence signal pattern that mimicked that of background noise (Figure 1.11h). This lack of dddW signal may be caused by the sequential positioning of the putative promoter of dddW and transcriptional terminators, whose effect may be overpowering and inactivating the dddW
promoter in the context of pCG202. Importantly, all constitutively expressed fluorescent proteins showed similar temporal patterns (Figure 1.11c,f,i,l), suggesting that the activity of the Plac
cassette is insulated from the rest of the DNA scaffold, perhaps due to the double transcriptional terminators. Taken together, the tri-color reporter version 2 revealed the importance of
preserving the original direction and spacing of reporter cassettes on the DNA scaffold for successful reporting of dmdA and dddW promoter activities.
Figure 1.11 | Fluorescence signal comparisons of DSS-3 tri-color reporter versions 1 and 2 incubated in DMSP (1 mM). All cells were grown overnight (30 °C) in glucose-amended (1 mM) MBM with tetracycline (3 µg/ml) and washed in non-amended MBM before treatment (0 h) with 1 mM DMSP. At each time point (15-min intervals), phase contrast and fluorescence images at one xy position per experimental condition were acquired with an sCMOS camera (ORCA-Flash 4.0; Hamamatsu Photonics; 6.5 µm pixel; exposure 1 sec) and 40× objective, with fluorescence excitation from a single-color LED light source (Lumencor) at 100% power and different filter cubes used for imaging different fluorescent proteins: mCherry (Chroma 49008), 575 nm excitation; EYFP (Chroma 49003), 513 nm excitation; ECFP (Chroma 49001), 440 nm excitation. All cells detected in phase contrast images, regardless of their fluorescence intensities, were included for analyses. Data points and error bars are mean ± s.e.m. of fluorescence of cells after background subtraction. Fluorescence signals detected in all three channels (RFP, YFP, CFP) of four reporter constructs were quantified (number of cells at fourth time point, 62 min): pCG100 (a–c, 564 cells); pCG200 (d–f, 614 cells); pCG201 (g–i, 1,150 cells); pCG202 (j–k, 1,431 cells).
1.7.4 Final tri-color reporter versions (strains Regular and Goofy)
Several improvements were made in the final versions of the tri-color reporters (pCG301 and pCG401). First, a smaller plasmid vector, pBBR1MCS-KanR, was used, which resulted in 7.974 kb tri-color reporter plasmids that were easier to engineer and transform into DSS-3. Second, the usage of the strong constitutive PA1/04/03 promoter enabled me to quantitatively correct
fluorescence signals for spectral leakage. Third, the lengths of putative promoters were determined through observations of responses in previous reporter designs in the presence of DMSP (500 bp for dddW and 222 bp for dmdA). Finally, I explored the fluorescent protein palette and identified mKate2 RFP and mTFP1 as superior replacements for mCherry RFP and Cerulean CFP (Figure 1.12). While excitation spectra of the two RFPs are similar, mKate2 emission spectra are slightly farther red, leading to greater separation of excitation and emission. Furthermore, mKate2 has shorter maturation time and higher quantum yield than mCherry. Similarly, mTFP1 emission and excitation wavelengths are well-separated, and its quantum yield is higher than that of Cerulean. Furthermore, the mTFP1 emission spectra does not show two peaks as Cerulean does. Taken together, mKate2 and mTFP1 are brighter and possess cleaner spectral profiles, for which signal detection optimization was easier. Details of methods and experiments with the final tri-color reporter strains of DSS-3 are available in Chapter 2.
Figure 1.12 | Excitation and emission spectra of fluorescent proteins mKate2, mCherry, mTFP1, and
Cerulean (adapted from FPbase70).
1.7.5 Fluorescence off-kinetics
Once fluorescent proteins are expressed in a cell, fluorescence signals are detectable for a long time due to the proteins’ stability (half-lives of hours to more than a day73). To characterize the
decay of fluorescence signals, or off-kinetics, of the DSS-3 fluorescent reporters upon the sudden withdrawal from DMSP, single-color reporter strains of DSS-3 (transformed with pCG302, PdmdA::mTFP1 or pCG303, PdddW::mKate2, described in Chapter 2) were first incubated with 10
mM DMSP for 3 hours, and subsequently washed and resuspended in 10 mM succinate.
In both strains, the rate of fluorescence signal increase slowed within 37 minutes of transfer from DMSP to succinate, and started to decrease within 97 minutes for PdddW::mKate2 and within 157
decay upon withdrawal from DMSP may be due to the slow maturation times of the fluorescent proteins, which may continue to fold even in the absence of DMSP. Even after 3.5 hours of incubation in succinate and in the absence of DMSP, fluorescence signals did not return to baseline levels. It is possible that the cells continue to express dmdA and dddW genes in the hours following DMSP exposure and withdrawal. However, a more likely explanation is that the stability of fluorescent proteins causes the fluorescence signal to decouple from gene expression levels. This represents a major limitation of the fluorescence reporter system, which is likely unsuitable for measurements of gene expression downregulation.
Figure 1.13 | Fluorescence off-kinetics. DSS-3 strains reporting dmdA (a) or dddW (b) promoter activities were used. All cells were grown overnight (30 °C) in succinate-amended (10 mM) MBM with kanamycin (25 µg/ml). Overnight cultures were directly loaded into microfluidic observation chambers (60 µm height) for the “no treatment” condition (open circles). For DMSP incubation, cells were washed in non-amended MBM before treatment (at t = 0 h) with 10 mM DMSP. DMSP-treated cells were either placed in the observation chambers (red, blue), or placed in 1.5-ml Eppendorf tubes and incubated in a shaker at 30 °C, and subsequently washed and resuspended in 10 mM succinate at ~3 h. Cells were subjected to antibiotic pressure throughout the entire experiment (kanamycin, 25 µg/ml), and time-lapse observations were conducted at 30 °C on a caged incubator-equipped microscope. At each time point, phase contrast and fluorescence images at two xy positions per
experimental condition were acquired with an sCMOS camera (Andor Zyla 4.2; 6.5 µm pixel; exposure 200 ms for fluorescence, 9.8 ms for phase contrast) and 40× objective, with fluorescence excitation from a single-color LED light source (Lumencor) at 100% power and different filter cubes used for imaging different fluorescent proteins:
ECFP cube (Chroma 49001) with 440 nm excitation for TFP fluorescence measurements (a); and mCherry cube (Chroma 49008) with 555 nm excitation for mKate RFP fluorescence measurements (b). All cells detected in phase contrast images, regardless of their fluorescence intensities, were included for analyses. Data points and error bars are mean ± s.e.m. of fluorescence of cells after background subtraction. Number of cells included in fluorescence signal quantification at the fourth time point, 3.6 h: a, 4872 cells (no treatment), 1833 cells (DMSP continuous), 1684 cells (DMSP-to-succinate) cells; b, 5212 cells (no treatment), 1895 cells (DMSP continuous), 1741 cells (DMSP-to-succinate).
1.8 Conclusions
Like any genetic engineering efforts in relatively novel model organisms, the “design, build, test” cycle of engineering of DSS-3 was a multi-year effort spanning two laboratory
environments as a result of a move from MIT to ETH Zurich. Careful calibrations of protocols were necessary for each laboratory environment due to the sensitivity of cloning procedures to chemical and environmental variations. In this Chapter, I first discussed the challenges that I encountered with plasmid vectors and transformation protocols of DSS-3, and suggested potential solutions to them. I then demonstrated the feasibility of constitutively expressing fluorescent proteins across the visible spectrum in DSS-3, using a constitutive promoter or through promoter fusions with genes of interest. Finally, I arrived at the final tri-color fluorescent reporter design which enabled the first semi-real-time measurements of DMSP pathway
expression at the single-cell level, which I discuss in Chapter 2.
1.9 Acknowledgements
The work in this Chapter would not have been possible without the critical tips and
conversations during the protocol troubleshooting stage. I would like to thank Prof. C.A. Voigt and his group members for teaching me how to clone and for demonstrating the great potential of synthetic biology. I also thank Prof. C.R. Reisch for crucial conversations that led me to the pBBR1MCS plasmids and the tri-parental mating protocol that finally got me out of a
troubleshooting rut. I thank Prof. A. Persat for a key conversation that led me to pivot towards a tri-color reporter design, and Dr. A.S. Burns for his assistance in troubleshooting the
enable my cloning work: Prof. C.R. Reisch (pRK415, pRK600), Prof. S. Molin (miniTn7 plasmids), Prof. M.E. Kovach (pBBR1MCS series), Dr. F. Moser (sfGFP, EYFP), Dr. G. D'Souza (mTFP1, mKate2).
Chapter 2.
Single-cell bacterial transcription measurements
reveal the importance of dimethylsulfoniopropionate
(DMSP) hotspots in ocean sulfur cycling
Work presented in this chapter has been published as “Cherry Gao, Vicente I. Fernandez, Kang Soo Lee, Simona Fenizia, Georg Pohnert, Justin R. Seymour, Jean-Baptiste Raina & Roman Stocker. Single-cell bacterial transcription measurements reveal the importance of
dimethylsulfoniopropionate (DMSP) hotspots in ocean sulfur cycling. Nature Communications 11, 1942 (2020). https://doi.org/10.1038/s41467-020-15693-z”
2.1 Abstract
Dimethylsulfoniopropionate (DMSP) is a pivotal compound in marine biogeochemical cycles and a key chemical currency in microbial interactions. Marine bacteria transform DMSP via two competing pathways with considerably different biogeochemical implications: demethylation channels sulfur into the microbial food web, whereas cleavage releases sulfur into the
atmosphere. Here, we present single-cell measurements of the expression of these two pathways using engineered fluorescent reporter strains of Ruegeria pomeroyi DSS-3, and find that external DMSP concentration dictates the relative expression of the two pathways. DMSP induces an upregulation of both pathways, but only at high concentrations (>1 µM for demethylation; >35 nM for cleavage), characteristic of microscale hotspots such as the vicinity of phytoplankton cells. Co-incubations between DMSP-producing microalgae and bacteria revealed an increase in cleavage pathway expression close to the microalgae’s surface. These results indicate that bacterial utilization of microscale DMSP hotspots is an important determinant of the fate of sulfur in the ocean.
2.2 Introduction
Up to 10% of the carbon fixed by phytoplankton cells in the ocean is converted to
dimethylsulfoniopropionate (DMSP)9, resulting in a global production of this compound that
exceeds one billion tons per year10. DMSP is an important currency in the ecological and
metabolic exchanges between phytoplankton and heterotrophic bacteria11, as it represents a
major nutrient source that contributes significantly to the sulfur and carbon demand of bacteria (up to 95% and 15%, respectively12,13). DMSP is utilized by marine bacteria via two competing
catabolic pathways14: the demethylation pathway leads to the incorporation of both carbon and
sulfur into bacterial biomass, whereas the cleavage pathway results in the utilization of carbon but the release of sulfur in the form of the climatically-active gas dimethylsulfide (DMS). The environmental factors that govern the utilization of one pathway over the other, and ultimately the production and release of DMS to the atmosphere, have remained elusive, marking a major gap in the mechanistic link between microbial processes and global-scale carbon and sulfur biogeochemical cycles.
The water-column concentration of DMSP has been hypothesized to be an important factor regulating the choice of degradation pathway by bacteria (DMSP Availability Hypothesis14) and
it has been speculated that bacteria control the fate of sulfur from DMSP by adjusting the relative expression of the demethylation and cleavage pathways (Bacterial Switch Hypothesis74).
Concentrations of DMSP in bulk seawater are typically low, ranging from a few nanomolar (global oceanic average: 16.91 ± 22.17 nM75) up to 200 nM during phytoplankton blooms76.
However, much higher DMSP concentrations are expected to occur in the vicinity of individual DMSP-producing organisms, such as phytoplankton cells, which can have intracellular DMSP concentrations of hundreds of millimolar77. Efforts to elucidate the environmental drivers of
microbial catabolism of DMSP have to date been limited to measurements in large-volume batch cultures78,79 and seawater samples80. As a consequence, an understanding of the influence of
microscale heterogeneity in DMSP concentrations on the microbial choice of degradation pathway is lacking.