Any correspondence concerning this service should be sent
to the repository administrator:
[email protected]
This is a Publisher’s version published in:
http://oatao.univ-toulouse.fr/26441
To cite this version:
Lahrar, El Hassane
and Belhboub, Anouar
and Simon, Patrice
and
Merlet, Céline
Ionic Liquids under Confinement: From Systematic
Variations of the Ion and Pore Sizes toward an Understanding of the Structure
and Dynamics in Complex Porous Carbons. (2020) ACS Applied Materials
and Interfaces, 12 (1). 1789-1798. ISSN 1944-8244
Ionic Liquids under Con
finement: From Systematic Variations of the
Ion and Pore Sizes toward an Understanding of the Structure and
Dynamics in Complex Porous Carbons
El Hassane Lahrar,
†,‡Anouar Belhboub,
†,‡Patrice Simon,
†,‡and Céline Merlet*
,†,‡†CIRIMAT, Université de Toulouse, CNRS, Bât. CIRIMAT, 118, route de Narbonne, 31062 Toulouse cedex 9, France ‡Réseau sur le Stockage Électrochimique de l’Énergie (RS2E), Fédération de Recherche CNRS 3459, HUB de l’Énergie, Rue
Baudelocque, 80039 Amiens, France
*
S Supporting InformationABSTRACT: We use molecular simulations of an ionic liquid in contact with a range of nanoporous carbons to investigate correlations between the ion size, pore size, pore topology, and properties of the adsorbed ions. We show that diffusion coefficients increase with the anion size and, surprisingly, with the quantity of adsorbed ions. Both findings are interpreted in terms of confinement: when the in-pore population increases, additional ions are located in less-confined sites and diffuse faster. Simulations in which the pores are enlarged while keeping the topology constant support these observations. The interpretation of properties across structures is more challenging. An interesting point is that smaller pores do not necessarily lead to a larger confinement. In this work, the highest degrees of confinement are observed for intermediate pore sizes. We also show a correlation between the quantity of adsorbed ions and the ratio between the maximum pore diameter and the pore limiting diameter.
KEYWORDS: molecular simulations, nanoporous carbons, ionic liquids, confinement, diffusion, porosity
1. INTRODUCTION
Ionic liquids are considered as promising electrolytes for electrochemical double-layer capacitors (EDLCs), also called supercapacitors, thanks to their wide electrochemical windows, allowing for larger energy densities, and their higher safety compared to organic electrolytes.1−4 One downside of using ionic liquids compared to organic or aqueous electrolytes is their relatively low ionic conductivity, which can limit the power density of the devices. In EDLCs, charge storage occurs through reversible ion adsorption at the electrode/electrolyte interface. Porous carbons are widely used as electrode materials owing to their low cost and the large surface areas they provide.5−7Understanding the relationships between the ions and carbon structures and the electrochemical perform-ance of supercapacitors is a major challenge as the disordered nature of most of the carbons used commonly renders this interface very difficult to characterize. Moreover, pure ionic
liquids are highly concentrated and the description of the electrostatic interactions in such systems is still a challenge.8,9 Recent advances in in situ experimental methods, such as nuclear magnetic resonance (NMR) and electrochemical quartz crystal microbalance (EQCM), have provided invalu-able insights into the charge-storage mechanisms of ionic-liquid-based supercapacitors.10−12When a potential difference is applied between the carbon electrodes, the charge storage can occur through counter-ion adsorption, co-ion desorption, and ion exchange. It was demonstrated that the charging mechanism depends on the nature of the electrolyte and is usually different for the positive and negative electrodes due to the asymmetry between anions and cations. It was also shown that the total number of ions in the pores affects the diffusion
Received: September 16, 2019
Accepted: December 6, 2019
Published: December 6, 2019
Research Article
www.acsami.org
Cite This:ACS Appl. Mater. Interfaces 2020, 12, 1789−1798
coefficients of these adsorbed species,13 which therefore impacts the power density of the devices. While these techniques have allowed considerable progress in the under-standing of the charging mechanisms, there is still no clear way to predict the charging mechanisms by simply knowing the nature of the ions and the structure of the carbon electrode.
A number of theoretical models have been proposed in the past to calculate the number of ions adsorbed in a porous electrode at a given potential difference and predict the corresponding electrochemical performances.14,15These mod-els have the advantage of being very fast and have permitted the establishment of key concepts such as the superionic effect,16
that is, the fact that ions of the same charge can be nearest neighbors in small pores thanks to the enhanced charge screening from the pore walls. In addition to theoretical models, molecular dynamics simulations have been used extensively to probe the structural, capacitive, and dynamic properties of the interface between pure ionic liquids and porous electrodes.17,18 While being more computationally expensive, molecular simulations have a great advantage in their ability to describe the complex nature of the ions and the porous structure in a much more accurate way than analytical models. The relationship observed experimentally between the total number of ions in the pores and the diffusion coefficients could be reproduced in a number of simulations.19,20 Nevertheless, such studies are still rare and usually focus on a single porous carbon structure so that a clear picture of the correlations between the ion size, porous structure, and interfacial properties is still missing.
In this work, we report a methodical molecular dynamics simulations study of the confinement effects for a pure ionic liquid in contact with a set of nanoporous carbons. We start by systematically varying the anion size to assess the influence of this property on the structural and dynamical properties of the ionic liquid in the bulk and under confinement. We show that while the evolution of the quantity of adsorbed ions with the anion size is intuitive, the variation of the diffusion coefficients is unforeseen. We interpret the observed trends in terms of degrees of confinement of the ions in the porous carbons. We then focus on two carbon structures, which we enlarge arbitrarily to investigate the effect of the pore size while keeping the same topology, and show that the obtained results are in agreement with the trend observed for the anion size evolution. Finally, we compare structural and dynamical properties across carbons with different topologies, a much more challenging task. We show that the confinement does not necessarily decrease with an increase of pore size and that the nonregularity of the structure, tentatively assessed here through the ratio between the maximum pore diameter and the pore limiting diameter, seems to be correlated to the total number of ions adsorbing in the porous volume.
2. METHODS
2.1. Systems Studied. Molecular dynamics (MD) simulations of
a pure ionic liquid (1-butyl-3-methylimidazolium hexa
fluorophos-phate, [BMI][PF6], and derivatives) both in the bulk and in contact
with a porous carbon have been carried out (Figure 1). The
electrolyte is represented by a coarse-grained model with three sites
Figure 1.Snapshot of one of the simulated systems: a pure ionic liquid in contact with a porous carbon. Anions are represented in green, cations in
red, and carbon atoms in light blue. This snapshot was generated using the VMD software.27
Figure 2.Pore size distributions of different carbon structures studied in this work: (a) ordered carbons,28and (b) disordered carbons.30Pore size
distributions were obtained using the Poreblazer software.31(c) Snapshots of a few selected structures; other structures can be seen in the
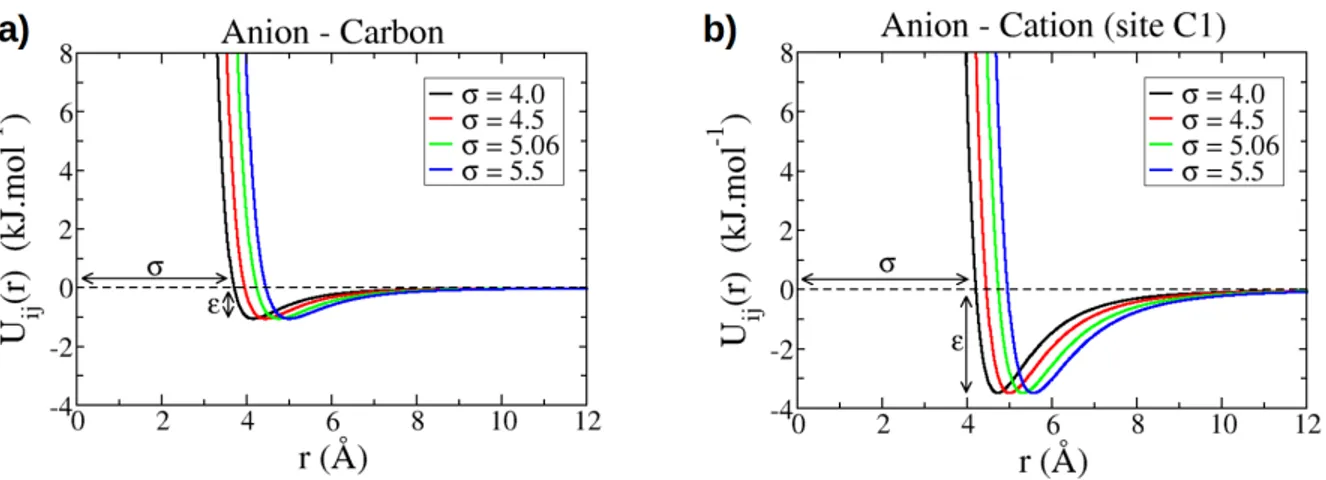
for the cation and one site for the anion.21The cation geometry is kept rigid. The intermolecular interactions are calculated as the sum of a Lennard-Jones potential and coulombic interactions as follows:
Ä Ç ÅÅÅÅÅ ÅÅÅÅÅ ÅÅÅ i k jjjjj j y { zzzzz z i k jjjjj j y { zzzzz z É Ö ÑÑÑÑÑ ÑÑÑÑÑ ÑÑÑ ε σ σ πε = − + u r r r q q r ( ) 4 4 ij ij ij ij ij ij ij i j ij 12 6 0 (1)
where rijis the distance between sites i and j andε0is the permittivity
of free space.σij andϵij are the Lennard-Jones parameters defining
respectively the position of the repulsive wall and the depth of the
energy well (seeFigure S1). Crossed parameters are calculated by the
Lorentz−Berthelot mixing rules. The parameters for the ions are
taken from the work of Roy and Maroncelli,21 the ions are not
polarizable and carry charges of±0.78e. Note that the reduction of
the ion charge from ±1.0e to ±0.78e leads to a remarkable
improvement in the agreement between the simulation and the experiment for a variety of static and dynamic properties of
[BMI][PF6]. The use of reduced charges, while being obviously less
accurate than the more computationally expensive polarizable force
fields,22 has been shown to be relevant for a large number of
systems.23−25For the carbon atoms, the parameters are taken from
the article of Cole and Klein.26The carbon atoms are neutral and the
carbon structure is kept rigid as a single entity during the simulations. To study the effect of the anion size on the properties of the systems,
we simply varied the σ parameter for the anion. Starting from the
original model withσAnion= 5.06 Å, we tested three other values: 4.0,
4.5, and 5.5 Å. The evolution of the Lennard-Jones potential with σAnion is shown in the Supporting Information. We note that considering a strict rigidity of the carbon structure and using a coarse-grained model for simulations of confined liquids are strong
assumptions, which are discussed in theSupporting Information.
For the simulations of the pure ionic liquid in contact with porous
carbons, we study a set of 14 carbons with equal densities (1 g·cm−3).
The pore size distributions of all carbons are given inFigure 2along
with snapshots of a few carbons. Snapshots for all of the carbons are
provided in theSupporting Information. Among the carbons studied,
10 are ordered, with a well-defined pore size or having at most a bimodal distribution. These carbons usually have a channel oriented in the z direction. The other four carbons are disordered and are characterized by a much wider pore size distribution. The ordered
carbons were generated by Deringer et al.28 through quench
molecular dynamics using a machine-learning-based force field
developed using the Gaussian approximated potentials approach29
and are thus designated as“GAP” carbons. The disordered carbons
are taken from the work of Palmer et al.30and were also obtained
from quench molecular dynamics. For these carbons, we keep the
original naming system of the authors, “QMDNx”, where “Nx” is
related to the quench rate: a higher number indicates a higher quench rate, which usually corresponds to a more disordered carbon.
All simulations reported here have been conducted using the
LAMMPS software.32The timestep is set to 2 fs. Bulk simulations are
performed with cubic simulation boxes and contain 1200 ion pairs.
The systems are first equilibrated in the NPT ensemble for 4 ns
before collecting data for 10 ns in the NVT ensemble. The simulations with porous carbons also contain 1200 ion pairs. The
simulation boxes have dimensions close to 48.5 Å× 48.5 Å × 210 Å
and depend on the anion size. The systems arefirst equilibrated in the
NPT ensemble for 2 ns before collecting data for 10 ns in the NVT ensemble. The pressure of the NPT simulations is set to 1 atm and all simulations are conducted at 400 K. The barostat and thermostat time constants are 0.5 and 0.1 ps, respectively. A cut-off of 12 Å was used for the Lennard-Jones interactions while coulombic interactions were evaluated using a particle−particle particle−mesh Ewald solver.
2.2. Pair Distribution Functions and Diffusion Coefficients.
We characterize the structural and dynamical properties through pair
distribution functions and diffusion coefficients. Pair distribution
functions, or radial distribution functions, give a measure of the
probability offinding a pair of atoms separated by a distance r, relative
to the probability estimated for a completely random distribution at
the same density. A possible expression for these pair distribution functions is presented below:
ρ ρ ρ − = × αβ αβ α β g r r r r r r ( ) ( , ) ( ) ( ) i j i j i j (2) (1) (1) (2) where ρα(1) and ρ αβ
(2) are respectively the one-body and two-body
particle densities for ions of speciesα (and β).
Generally, in a uniformfluid, the diffusion is homogeneous along
the three axes, x, y and z; and the self-diffusion coefficients are determined using the Einstein relation, which relates this property to the mean-square displacements of the molecules as follows:
= ⟨|Δ | ⟩ →∞ D dt r t lim 1 2 ( ) t i 2 (3)
where d is the dimensionality of the system and Δri(t) is the
displacement of a typical ion of the considered species in time t. The presence of the porous carbon breaks the symmetry of the
system, as shown inFigure 1, and we can define a region of “free
electrolyte” and a region of “confined electrolyte”. The determination of diffusion coefficients in such a system has been described in the
literature.33,34 An analysis in which fictitious boundaries are
introduced is used. Dxx and Dyy are determined from the mean
square displacements⟨Δx2(t)⟩ and ⟨Δy2(t)⟩ of particles remaining in
a given region. Pi(t) is the survival probability for a particle in that
given region: = ⟨Δ ⟩ = ⟨Δ ⟩ →∞ →∞ D z x t tP t D z y t tP t ( ) lim ( ) 2 ( ) , ( ) lim ( ) 2 ( ) xx i t i i yy i t i i 2 2 (4)
Pi(t) is the probability for a particle i to remain in a region of interest
and can be calculated numerically from the simulation. If N(t, t +τ) is
the total number of i particles in the region of interest during the time
interval between t and t + τ and N(t) designates the number of
particles in the layer at time t, then P(τ) can be calculated as follows:
∑
τ = +τ = P T N t t N t ( ) 1 ( , ) ( ) t T 1 (5)where T is the average of the total number of time steps.
The diffusion coefficient along the z axis, Dzz, is determined from
the autocorrelation of an eigenfunction based on the the z limit condition: i k jjj yπ{zzz ψ ψ = − ⟨ ⟩ → D z L n t t ( ) lim ln( ( ) (0) ) zz i t n i n i 2 0 (6) whereψni(t) is given by i k jjjjj y{zzzzz ψ = π − − z n z t z z z ( ) sin ( ) n i i i i i min max min (7)
In these equations, zmini and zmaxi are the coordinates that define the
width of a given region L = zmaxi − zmini , and n is an integer that should
not affect the results much in the diffusive regime; here, we choose n = 3. This result is based on the Smoluchowski equation applied in a region where the potential of mean force is constant. More details on
this analysis are available in ref33.
3. RESULTS AND DISCUSSION
3.1. Effect of the Anion Size on the Bulk Properties. We start our systematic study of the correlation between the ion size, pore size, and properties of the electrolyte under confinement by analyzing the effect of the ion size. Here, for the sake of fundamental understanding, we simply vary theσ parameter of the anion in the Lennard-Jones potential employed. The coarse-grained model we use to represent the pure ionic liquid is well suited for this as the anion is described as a single spherical site.21While this is not realistic, molecular
simulations give us this unique opportunity to assess the effect of such a variation. Starting from the original model of Roy and Maroncelli, developed to represent [BMI][PF6] and having a
σAnionof 5.06 Å, we investigate four different anion sizes: 4.0,
4.5, 5.06, and 5.5 Å. Since the variation of theσ parameter for the anions modifies the intermolecular interactions, we need to start by characterizing the structural and dynamical properties of the bulk liquid before turning to the characterization of the same properties under confinement.
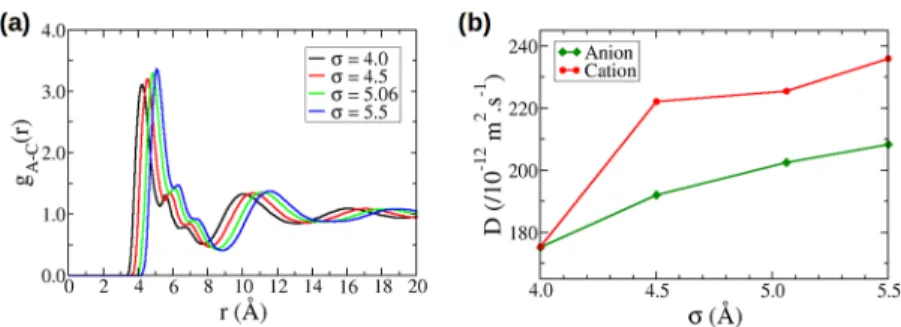
Figure 3a gives the pair distribution functions between the centers of mass of the anions and the cations in the bulk. The curves for the different σAnion values are similar, but, as
expected, the larger theσAnion, the larger the distance at which
the first maximum is observed. The heights of the first maximum and the following minimum also vary slightly with σAnion. The average coordination number is constant withσAnion
and close to 6. It is unclear at this point as to what drives the slightly more pronounced structuring for the largerσAnion, but it is probably related to a different interplay between Lennard-Jones and electrostatic interactions for ions of different sizes. Another interesting point to note is the presence of two shoulders on the first peak of the pair distribution functions; these shoulders are due to different orientations of the cations with respect to the anion.
Figure 3b gives the diffusion coefficients calculated for the bulk electrolyte. In this figure, we see that the diffusion coefficient increases when the anion size increases. Starting from the originalσAnionof 5.06 Å, we observe a variation of up
to 20% in the diffusion coefficient. It is also interesting to note that while we modify onlyσAnion, the diffusion coefficient of the cation is also affected. We believe that the fact that we obtain equal values forσAnion= 4.0 Å is fortuitous. The increase in the
diffusion coefficients can be related to the decrease in density when σAnion increases; densities have been known to affect diffusion.35,36 The increase in the ion−ion distance reducing
the electrostatic interactions could also contribute to increasing the diffusion coefficients.
3.2. Effect of the Anion Size on the Confined Properties. We now discuss the effect of the anion size on the confined properties of the electrolyte. In the remainder of this article, we focus mainly on the properties of the anions but similar conclusions can be drawn for the cations. In this part, we investigate ion adsorption and diffusion in 11 different carbon structures with average pore sizes comprised between 7.8 and 12.2 Å: 10 ordered carbons designated as GAPs and one disordered carbon designated as QMD4x. One important information to extract when observing the ion adsorption in porous materials is the quantity of ions actually adsorbed in the pores. This is relevant for energy storage as it can impact both the power density, that is, how fast the systems can be charged or discharged, and the capacitance of such devices. The quantities of ions adsorbed in the porous carbons are given in
Figure 4and were calculated as the number of ions having a z coordinate comprised between the ones of the outer most carbon atoms. The total pore population is the sum of the numbers of anions and cations in the carbon normalized by the mass of the carbon material. We remind here that all carbons have the same density of 1 g·cm−3. It is very clear fromFigure 4a that, for a given carbon, the variation of the total pore population withσAnionis monotonous. Not surprisingly, when
the anion size increases, the quantity of ions in the pores decreases. It is interesting to note that the curves are almost linear and with similar slopes for all of the carbons. This might be a feature specific to ordered carbons as the disordered carbon QMD4x does not show a linear trend (seeSupporting Information).
Figure 4b gives the diffusion coefficients as a function of σAnionfor the various GAP carbons. While the trend is not as
clear as for total pore populations, most of the systems show a decrease in the diffusion when the anion size increases. It is
Figure 3.(a) Centers of mass radial distribution functions between anions and cations; and (b) diffusion coefficients for bulk simulations of pure
ionic liquids with various Lennard-Jones parameters (σ for the anion.).
Figure 4.(a) Total pore populations. (b) Diffusion coefficients for the anions confined in the GAP carbons with various Lennard-Jones parameters
thus the opposite of what was observed in the bulk simulation and it shows how big an effect the confinement has on the dynamical properties of the electrolyte. Also worth noticing is the fact that the diffusion coefficients of anions adsorbed in the carbons are around 1 order of magnitude smaller than that in the bulk. This is a smaller decrease than that observed in pulse-field gradient NMR experiments,13
but it is in agreement with other simulation studies.19,20
From Figure 4, it seems that the diffusion coefficients are larger when the total pore population is larger. This is even clearer inFigure S4in which we plot the diffusion coefficients as a function of the total pore population. This result is rather counter-intuitive, and previous experiments13 and simula-tions19,20have shown a reverse trend. It is important to note however that previous correlations were performed with a given electrolyte−carbon combination and the changes in populations were due to an applied potential difference. In the present case, the situation is very different because we are studying a set of electrolytes, due to the variation of the anion size, and a set of carbons, with different pore sizes and topologies.
To explain the observations made on the correlation between the total pore population and the diffusion coefficients, we characterize the structure of the electrolyte in a finer way. First, we analyze the ionic densities in the x
direction. The carbons we choose for this study have a topology in which the x and y axes more or less correspond to particular orientations in the carbon topology. The ionic densities as well as snapshots of the electrolyte−carbon system are shown inFigure 5for the smallest and the largest sizes of the anion. In thisfigure, it is again clear that a smaller anion size leads to a higher density of ions in the pores. More interestingly, and especially visible in the anion densities, the density seems to increase mostly in the center of the pore. In the case of GAP8, we even observe a change of structure from a bilayer of ions for large anions to a trilayer for small anions. Previous studies have shown that ions in the center of the pores move faster than ions in thefirst layer close to the carbon surface.35,37,38As a consequence, increasing the ion density in the center of the pores compared to that of thefirst layer close to the carbon might explain the global increase in the diffusion coefficient.
To generalize this analysis to carbon structures where the main directions of diffusion or packing are not x, y, or z, we calculate degrees of confinement (DoCs) of the anions and observe how these quantities change withσAnion. The degree of
confinement, as defined by Merlet et al.,39is the percentage of the solid angle around the ion that is occupied by the carbon atoms, normalized by the maximal value taken by this quantity. As such, the DoC depends both on the number of carbons
Figure 5.Left: ionic densities along the x axis for the GAP2 and GAP8 carbons. Right: snapshots showing the ions confined in the GAP8 carbon.
Anions are represented in green, cations in red, and carbon atoms in light blue. These snapshots were generated using the VMD software.27
Figure 6.Top: snapshots of anions located in typical adsorption sites in the GAP8 and GAP9 structures. These snapshots were generated using the
OVITO software.40Only carbon atoms (in light yellow) and anions (colored according to their instantaneous DoCs) are shown for clarity.
Bottom: distribution of the DoCs experienced by anions confined in these porous carbons.
surrounding an ion and on each ion−carbon distance.Figures 6and7show distributions of the DoC experienced by anions confined in a few selected carbons. Distributions for the remaining carbons are given inFigure S5. For almost all of the carbons, with the exception of GAP6, the DoCs increase when σAnionincreases. Atfirst glance, this is surprising as we would
expect that larger anions would not be able to enter some of the pores or occupy sites with less confinement. To interpret this result and understand the different behavior of GAP6, we look more closely at some of the carbons, namely GAP6, GAP7, GAP8, and GAP9.
Figure 6shows the distributions of the DoCs experienced by anions confined in GAP8 and GAP9 carbons as well as snapshots of the anions in typical adsorption sites. Anions are colored according to their instantaneous DoCs. GAP8 is the carbon with the largest pore size (12.2 Å). The distribution of DoCs shows a large peak around 25−30% for a small σAnion
value and a main peak with shoulders at a very high confinement for a large σAnionvalue. From the snapshots, we can notice that the lowest DoCs correspond to anions located closer to the center of the pores, while the largest DoCs observed in the case of large anions result from the fact that ions are pushed closer to the pore walls and in the corners. The anions in the corners probably diffuse more slowly than the ones close to the center of the pores, which explains the increase of diffusion coefficients for smaller anions. GAP9 is a carbon with a smaller pore size (10.3 Å) having a much less regular shape. With this carbon, we observe a change from a wide peak for small anions to a bimodal distribution for large anions. In the case of a smallσAnionvalue, it seems that the ions
occupy more of the pore space compared to the case of the larger anions where the ions seem to be located in a more ordered fashion. A larger mobility of the small ions in the direction perpendicular to the carbon surface could explain why the distribution is wider in this case compared to the curves for larger ions.
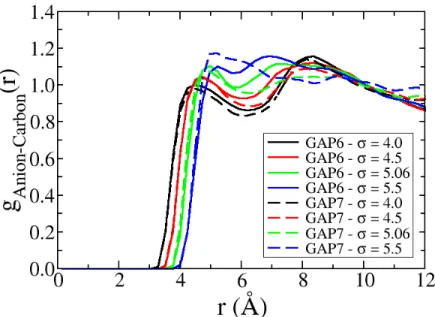
Figure 7shows the distributions of the DoCs experienced by anions confined in GAP6 and GAP7 carbons as well as snapshots of the anions in typical adsorption sites. These carbons are the ones with the smallest pore sizes (7.8 and 8.0 Å for GAP6 and GAP7, respectively). While these carbons have
similar pore sizes, they have very different topologies; GAP6 has relatively rectangular-shaped pores, while GAP7 has diamond-shaped pores. In GAP6, the pore surface is relatively smooth and there are no adsorption sites with especially high DoCs. As a consequence, for all anion sizes and pore populations, the ions occupy similar sites. The peak in the distribution of DoCs shifts to a lower confinement as the anion size increases; this is probably simply due to an increase in the anion−carbon distance as σAnion increases. It is important to
note that while the diffusion coefficient still increases with the ion population, the slope of this increase is much less pronounced than that for most of the carbons. The case of GAP7 is very different, with the existence of two well-identified adsorption sites: the anions occupy the center of the pore or are very confined in the small corners. The distributions of DoCs always show two clear peaks, but the relative populations of more-confined and less-confined ions vary with the anion size. The anion−carbon pair distribution functions for these two carbons are given inFigure S6and show that, as expected, the anion−carbon distance tends to increase with the anion size. It is thus indeed the different interplay between the ion− carbon distance and number of carbons around an ion that leads to the different behaviors observed in GAP6 and GAP7. Overall, it seems that the behavior of the diffusion coefficient of the anions is well correlated with the variations in the DoCs. It is difficult to go beyond as the variation of the local diffusion coefficient with the DoC is not known and probably not linear. The existence of an exchange between the various positions in the pores also makes it very difficult to analyze the anion trajectories in more depth. This analysis also shows the importance of the shape of the pores. Indeed, carbons with very similar average pore sizes, for example GAP6 and GAP7, can show very different behaviors.
3.3. Effect of the Pore Size on the Confined Properties. After investigating the effect of the anion size on the local structure and dynamics through the DoCs and diffusion coefficients, we now turn to an exploration of the impact of the pore size on the same properties. To this aim, we apply scaling factors of 1.2 and 1.4 on two carbon structures with the same average pore size, namely GAP8 and QMD4x. We keep σAnion constant at 5.06 Å. The initial pore size
Figure 7.Top: snapshots of anions located in typical adsorption sites in the GAP8 and GAP9 structures. These snapshots were generated using the
OVITO software.40Only carbon atoms (in light yellow) and anions (colored according to their instantaneous DoCs) are shown for clarity.
distributions and their evolution with the scaling procedure are shown in Figure S7. It is important to note that while this method allows us to focus on a change of the pore size at constant topology, this generates structures with densities different from those of the original ones and with larger C−C bonds.
Figure 8 shows the diffusion coefficients as a function of pore size and the distribution of DoCs for GAP8 and QMD4x carbons and their scaled counterparts. We observe a very clear increase of the diffusion coefficient with the pore size as expected. We note that the diffusion coefficients for the ordered GAP8 carbon are always lower than those of the disordered QMD4x carbon. For the GAP8 carbon, the distributions of DoCs show a single peak toward a lower confinement when the pore size increases. Compared to the initial GAP carbons, many more environments can exist at DoCs very close to zero in the scaled carbons. For the QMD4x carbon, the distributions of DoCs are much wider with no clear peak, but the shift to lower confinements is also observed with the pore size increase. The absence of a clear peak is probably the result of a lack of clearly defined geometries in this highly disordered carbon. It is worth pointing out that the DoCs are usually lower for the QMD4x carbon with respect to the GAP8 structure, in agreement with the larger diffusion coefficients calculated in the disordered carbon. In addition, the ordered carbons are characterized by tunnels along the z axis; therefore, the confined ions move faster in this direction, but the carbon walls prevent the mobility of ions along the x and y axes, leading to very small Dx and Dy diffusion coefficients (see Figure S8). In contrast, in the disordered carbons, the diffusion coefficients are more important in the x and y directions. Overall, both the confinement and directionality effects tend to increase the average diffusion coefficients for disordered carbons compared to ordered ones.
The results provided by the simulations with scaled carbon structures are concordant with the observations made for the anion size effect.
3.4. Comparison of Topologically Different Carbon Structures. After discussing the effects of the anion size and the pore size on the electrolyte properties under confinement, we now attempt to rationalize the correlations between the porous structure and the properties of the confined electro-lytes. There are a number of properties used to characterize porous structures, none being ideal as it is very challenging to describe a complex structure with only a few key parameters. Here, we use Poreblazer31 to extract the properties of the carbon structures. We determined the pore size distributions (PSDs) and use them to calculate the average pore sizes (see
Figures 2andS9). While not being sufficient, the average pore size is very often used to compare carbons and was shown to correlate with some electrochemical properties.41,42The other properties we will use are the pore limiting diameter, that is, the smallest opening along the pore that a molecule needs to cross to diffuse through this material, and the maximum pore diameter, that is, the largest opening along the pore. The positions of these two quantities with respect to the PSD are shown on two carbon structures in the Supporting Information. In this part, we analyze molecular simulations conducted with the initial coarse-grained model for the ionic liquid (σAnion= 5.06 Å) in contact with 14 carbon structures (10 GAPs and 4 QMDs).
Figure 9 shows the total pore population and the anion diffusion coefficient for all of the carbons studied here. The first thing we observe is that the total pore population is always lower for QMDs compared to GAPs. The QMDs are much more disordered, which might prevent an optimal packing of the ions in the porosity. We note that one of the disordered carbons, QMD8x, contains even less ions (almost three times less) than the others. This carbon is the only QMD carbon that does not contain a big pore (its PSD does not show any
Figure 8.(a) Diffusion coefficients for anions confined in scaled carbons with different pore sizes. (b) Distribution of the DoCs experienced by
anions confined in these porous carbons.
Figure 9.(a) Total pore populations. (b) Diffusion coefficient as a function of the average pore size for ions confined in the various carbons.
maximum close to 14 Å). Another interesting point is that for the GAP carbons, which span a larger range of pore sizes, no monotonous increase of the total pore population with the pore size is observed, but some structures seem to allow for larger quantities of ions to pack in. We also note that going across carbons with different topologies and going from small to large pore sizes, the diffusion coefficient is not monotonous, as already observed by Wang et al.36 in slit pores, and not correlated with the total pore population, as is clear from
Figure 10a. This underlines the importance of the pore topology and the inability of the average pore size as a single parameter to characterize the porous structure. Interestingly, the highest diffusion coefficients are observed for the GAP9 and QMD2x carbons, the two carbons that show the largest diffusions along the x and y directions, that is, perpendicular to the main direction (seeFigure S8for the different components of the diffusion coefficients). This suggests that diffusion in three dimensions and not only in a channel is important for a faster diffusion.
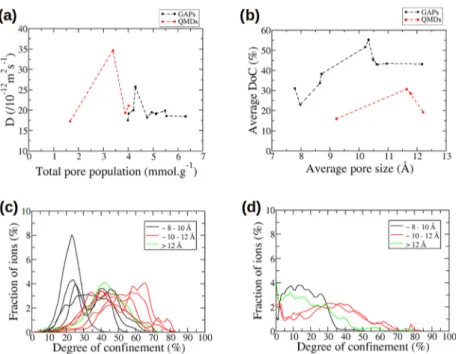
We now calculate the DoCs in the different carbons to try to gain insights into these variations. Figure 10 shows the distributions of DoCs for anions adsorbed in all of the carbons (Figure 10c) as well as the variation of the DoC with the pore size (Figure 10d). One might expect that the DoC increases
when the pore size decreases but this is not the case. Actually, the confinement seems to be lower for very small pore sizes, increases for intermediate pore sizes, and decreases again above 12 Å. This trend is seen clearly inFigure 10c,d, where the curves for different carbons are colored according to the range of pore sizes that they belong to. In particular, the highest DoCs are observed for intermediate average pore sizes between 10 and 12 Å. Interestingly, the same trend is observed for GAPs and QMDs even if the DoC distributions for QMDs are much wider.
Considering the ordered GAP carbons and the geometrical descriptors for the pore topologies, one idea that comes to mind is to use the ratio of the longest distance over the shortest distance defining the main pore. If the pore is square-like, then this ratio will be close to 1. If the pore is more diamond-shaped, then this ratio will be larger than 1. The more distorted the pore, the larger the ratio. The value of the ratio is thus very dependent on the pore shape and we call it the “form factor” in the remainder of this article. These shortest and longest distances are not always well defined, especially for disordered carbons, and so, as a proxy, we will use the maximum pore diameter and the pore limiting diameter determined using Poreblazer.31
Figure 10.(a) Diffusion coefficient as a function of the total pore populations. (b) Degree of confinement as a function of the average pore size. (c,
d) Distributions of DoCs for the anions confined in all of the nanoporous carbons studied here (left: GAP, right: QMD).
Figure 11.(a) Total pore populations and (b) diffusion coefficients as a function of the form factor defined as the ratio between the maximum pore
Plots showing the total pore population and the diffusion coefficients as a function of the form factor are given inFigure 11. From this figure, it seems that this descriptor is indeed correlated with the total pore population for a range of carbons, including three of the disordered carbons. QMD8x is again an outlier showing a very low quantity of adsorbed ions. Close to the value of 1.0 for the form factor, the dispersion is larger. In this region, the effect of the actual pore size is probably more important as the pore is more square or sphere-like. On the contrary, no clear correlation can be established between the diffusion coefficients and the form factor. It is worth noting though that the actual values of the diffusion coefficients are relatively similar, with many values around 20 × 10−12 m2s−1, which makes it more challenging to identify
trends.
Overall, this comparison between carbons having different topologies underlines the fact that smaller pores do not necessarily lead to a larger confinement and suggests that more relevant geometrical descriptors than the pore sizes could be used. A further step, out of the scope of the present work and requiring a larger database, would be to characterize the topology in a more complete way, for example using a pore recognition approach.43
4. CONCLUSIONS
We have carried out a methodical molecular dynamics simulation study of ionic liquid adsorption into nanoporous carbons to investigate the correlation between the ion size, pore size, porous structure, and structural and dynamical properties. We have shown that a change in the anion size does not affect the diffusion coefficients in the same way in the bulk or under confinement. Moreover, under confinement, we have shown that for a given carbon structure, the diffusion coefficient increases when the total pore population increases. This surprising result was explained by observing the position of the ions within the pores. Assuming that more-confined ions diffuse more slowly, as proposed in the literature, the increase in ion population leads to more ions being less confined, located in a more central position in the pores, and results in a diffusion coefficient increase. The degree of confinement of the ions was also analyzed in scaled carbon structures, which allowed us to explore a change of the pore size while keeping a constant topology. The results are concordant with the ones obtained for varying anion sizes. We then tried to apply our analysis to the study of the same pure ionic liquid in contact with 14 carbon structures, ordered and disordered. This task appeared to be more challenging, but we could highlight some interesting features. It was shown that the degree of confinement does not necessarily increase with the decrease in the average pore size. Actually, it seems that the pore sizes could be divided into three sets: small pore sizes below 10 Å, intermediate pore sizes between 10 and 12 Å, which correspond to the largest confinements observed, and the largest pore sizes above 12 Å. In addition, a correlation between the total pore population and the ratio between the maximum pore diameter and the pore limiting diameter was observed. In the future, the characterization of the porous structures would benefit a lot from more complete approaches, for example using pore recognition.
■
ASSOCIATED CONTENT*
S Supporting InformationThe Supporting Information is available free of charge at
https://pubs.acs.org/doi/10.1021/acsami.9b16740.
Lennard-Jones potentials, snapshots of the carbons studied, additional diffusion coefficients and DoC plots, pore size distributions of the scaled carbons, average pore sizes, x/y/z components of the diffusion coefficients, pair distribution functions, and a discussion on the rigidity and coarse-grained approximations (PDF)
■
AUTHOR INFORMATION Corresponding Author *E-mail:[email protected] ORCID Patrice Simon:0000-0002-0461-8268 Céline Merlet:0000-0003-3758-273X NotesThe authors declare no competingfinancial interest.
The data corresponding to the plots reported in this paper, as well as an example inputfile for LAMMPS, are available in the Zenodo repository with identifier https://zenodo.org/record/ 3407266#.Xfz93nVKhUZ.
■
ACKNOWLEDGMENTSThis project has received funding from the European Research Council (ERC) under the European Union’s Horizon 2020 research and innovation programme (grant agreement no. 714581). This work was granted access to the HPC resources of CALMIP supercomputing center under the allocation P17037. The authors acknowledge Pierre-Louis Taberna, Michelle Liu, Berend Smit, Mathieu Salanne, Benjamin Rotenberg, and Nidhal Ganfoud for useful discussions.
■
REFERENCES(1) Zhong, C.; Deng, Y.; Hu, W.; Qiao, J.; Zhang, L.; Zhang, J. A Review of Electrolyte Materials and Compositions for Electrochemical Supercapacitors. Chem. Soc. Rev. 2015, 44, 7484−7539.
(2) Béguin, F.; Presser, V.; Balducci, A.; Frackowiak, E. Carbons and Electrolytes for Advanced Supercapacitors. Adv. Mater. 2014, 26, 2219−2251.
(3) Brandt, A.; Pohlmann, S.; Varzi, A.; Balducci, A.; Passerini, S. Ionic Liquids in Supercapacitors. MRS Bull. 2013, 38, 554−559.
(4) Lewandowski, A.; Olejniczak, A.; Galinski, M.; Stepniak, I. Performance of Carbon-Carbon Supercapacitors Based on Organic, Aqueous and Ionic Liquid Electrolytes. J. Power Sources 2010, 195, 5814−5819.
(5) Simon, P.; Gogotsi, Y. Capacitive Energy Storage in Nano-structured Carbon−Electrolyte Systems. Acc. Chem. Res. 2013, 46, 1094−1103.
(6) Liu, T.; Zhang, F.; Song, Y.; Li, Y. Revitalizing Carbon Supercapacitor Electrodes with Hierarchical Porous Structures. J. Mater. Chem. A 2017, 5, 17705−17733.
(7) Fic, K.; Platek, A.; Piwek, J.; Frackowiak, E. Sustainable Materials for Electrochemical Capacitors. Mater. Today 2018, 21, 437−454.
(8) Lee, A. A.; Perez-Martinez, C. S.; Smith, A. M.; Perkin, S. Underscreening in Concentrated Electrolytes. Faraday Discuss. 2017, 199, 239−259.
(9) Lhermerout, R.; Perkin, S. Nanoconfined Ionic Liquids: Disentangling Electrostatic and Viscous Forces. Phys. Rev. Fluids 2018, 3, No. 014201.
(13) Forse, A. C.; Griffin, J. M.; Merlet, C.; Carreteo-Gonzalez, J.; Raji, A.-R. O.; Trease, N. M.; Grey, C. P. Direct Observation of Ion Dynamics in Supercapacitor Electrodes Using In Situ Diffusion NMR Spectroscopy. Nat. Energy 2017, 2, No. 16216.
(14) Kornyshev, A. A. Double-Layer in Ionic Liquids: Paradigm Change? J. Phys. Chem. B 2007, 111, 5545−5557.
(15) Huang, J.; Sumpter, B. G.; Meunier, V. Theoretical Model for Nanoporous Carbon Supercapacitors. Angew. Chem., Int. Ed. 2008, 47, 520−524.
(16) Kondrat, S.; Kornyshev, A. Superionic State in Double-Layer Capacitors with Nanoporous Electrodes. J. Phys.: Condens. Matter 2011, 23, No. 022201.
(17) Merlet, C.; Rotenberg, B.; Madden, P. A.; Salanne, M. Computer Simulations of Ionic Liquids at Electrochemical Interfaces. Phys. Chem. Chem. Phys. 2013, 15, 15781−15792.
(18) Fedorov, M. V.; Kornyshev, A. A. Ionic Liquids at Electrified
Interfaces. Chem. Rev. 2014, 114, 2978−3036.
(19) Burt, R.; Breitsprecher, K.; Daffos, B.; Taberna, P.-L.; Simon, P.; Birkett, G.; Zhao, X. S.; Holm, C.; Salanne, M. Capacitance of Nanoporous Carbon-Based Supercapacitors Is a Trade-Off between the Concentration and the Separability of the Ions. J. Phys. Chem. Lett.
2016, 7, 4015−4021.
(20) He, Y.; Qiao, R.; Vatamanu, J.; Borodin, O.; Bedrov, D.; Huang, J.; Sumpter, B. G. The Importance of Ion Packing on the Dynamics of Ionic Liquids during Micropore Charging. J. Phys. Chem. Lett. 2016, 7, 36−42.
(21) Roy, D.; Maroncelli, M. An Improved Four-Site Ionic Liquid Model. J. Phys. Chem. B 2010, 114, 12629−12631.
(22) Schröder, C. Comparing Reduced Partial Charge Models with Polarizable Simulations of Ionic Liquids. Phys. Chem. Chem. Phys.
2012, 14, 3089−3102.
(23) Bowron, D. T.; D’Agostino, C.; Gladden, L. F.; Hardacre, C.; Holbrey, J. D.; Lagunas, M. C.; McGregor, J.; Mantle, M. D.; Mullan, C. L.; Youngs, T. G. A. Structure and Dynamics of 1-Ethyl-3-methylimidazolium Acetate via Molecular Dynamics and Neutron
Diffraction. J. Phys. Chem. B 2010, 114, 7760−7768.
(24) Bhargava, B. L.; Balasubramanian, S. Refined Potential Model
for Atomistic Simulations of Ionic Liquid [BMIM][PF6]. J. Chem.
Phys. 2007, 127, No. 114510.
(25) Chaban, V. Polarizability Versus Mobility: Atomistic Force Field for Ionic Liquids. Phys. Chem. Chem. Phys. 2011, 13, 16055− 16062.
(26) Cole, M. W.; Klein, J. R. The Interaction Between Noble Gases and the Basal Plane Surface of Graphite. Surf. Sci. 1983, 124, 547− 554.
(27) Humphrey, W.; Dalke, A.; Schulten, K. VMD - Visual Molecular Dynamics. J. Mol. Graphics 1996, 14, 33−38.
(28) Deringer, V. L.; Merlet, C.; Hu, Y.; Lee, T. H.; Kattirtzi, J. A.; Pecher, O.; Csányi, G.; Elliott, S. R.; Grey, C. P. Towards an Atomistic Understanding of Disordered Carbon Electrode Materials.
Chem. Commun. 2018, 54, 5988−5991.
(29) Deringer, V. L.; Csányi, G. Machine Learning Based Interatomic Potential for Amorphous Carbon. Phys. Rev. B 2017, 95, No. 094203.
(30) Palmer, J. C.; Llobet, A.; Yeon, S.-H.; Fischer, J. E.; Shi, Y.; Gogotsi, Y.; Gubbins, K. E. Modeling the Structural Evolution of Carbide-Derived Carbons Using Quenched Molecular Dynamics. Carbon 2010, 48, 1116−1123.
Micropore Exchange Using Molecular Dynamics. Geochim. Cosmo-chim. Acta 2007, 71, 5089−5101.
(35) Rajput, N. N.; Monk, J.; Singh, R.; Hung, F. R. On the Influence of Pore Size and Pore Loading on Structural and Dynamical Heterogeneities of an Ionic Liquid Confined in a Slit Nanopore. J. Phys. Chem. C 2012, 116, 5169−5181.
(36) Wang, C.; Wang, Y.; Lu, Y.; He, H.; Huo, F.; Dong, K.; Wei, N.; Zhang, S. Height-Driven Structure and Thermodynamic Proper-ties of Confined Ionic Liquids Inside Carbon Nanochannels from Molecular Dynamics Study. Phys. Chem. Chem. Phys. 2019, 21, 12767−12776.
(37) Singh, R.; Monk, J.; Hung, F. R. A Computational Study of the
Behavior of the Ionic Liquid [BMIM+][PF
6−] Confined Inside
Multiwalled Carbon Nanotubes. J. Phys. Chem. C 2010, 114, 15478− 15485.
(38) Singh, R.; Monk, J.; Hung, F. R. Heterogeneity in the Dynamics
of the Ionic Liquid [BMIM+][PF
6
−] Confined in a Slit Nanopore. J.
Phys. Chem. C 2011, 115, 16544−16554.
(39) Merlet, C.; Péan, C.; Rotenberg, B.; Madden, P. A.; Daffos, B.; Taberna, P. L.; Simon, P.; Salanne, M. Highly Confined Ions Store Charge More Efficiently in Supercapacitors. Nat. Commun. 2013, 4, No. 2701.
(40) Stukowski, A. Visualization and Analysis of Atomistic Simulation Data with OVITO - the Open Visualization Tool. Modelling Simul. Mater. Sci. Eng. 2010, 18, No. 015012.
(41) Chmiola, J.; Yushin, G.; Gogotsi, Y.; Portet, C.; Simon, P.; Taberna, P. L. Anomalous Increase in Carbon Capacitance at Pore Sizes Less Than 1 Nanometer. Science 2006, 313, 1760−1763.
(42) Raymundo-Piñero, E.; Kierzek, K.; Machnikowski, J.; Béguin, F. Relationship Between the Nanoporous Texture of Activated Carbons and their Capacitance Properties in Different Electrolytes. Carbon 2006, 44, 2498−2507.
(43) Lee, Y.; Barthel, S. D.; Dlotko, P.; Moosavi, S. M.; Hess, K.; Smit, B. Quantifying Similarity of Pore-Geometry in Nanoporous Materials. Nat. Commun. 2017, 8, No. 15396.